Market Snapshot
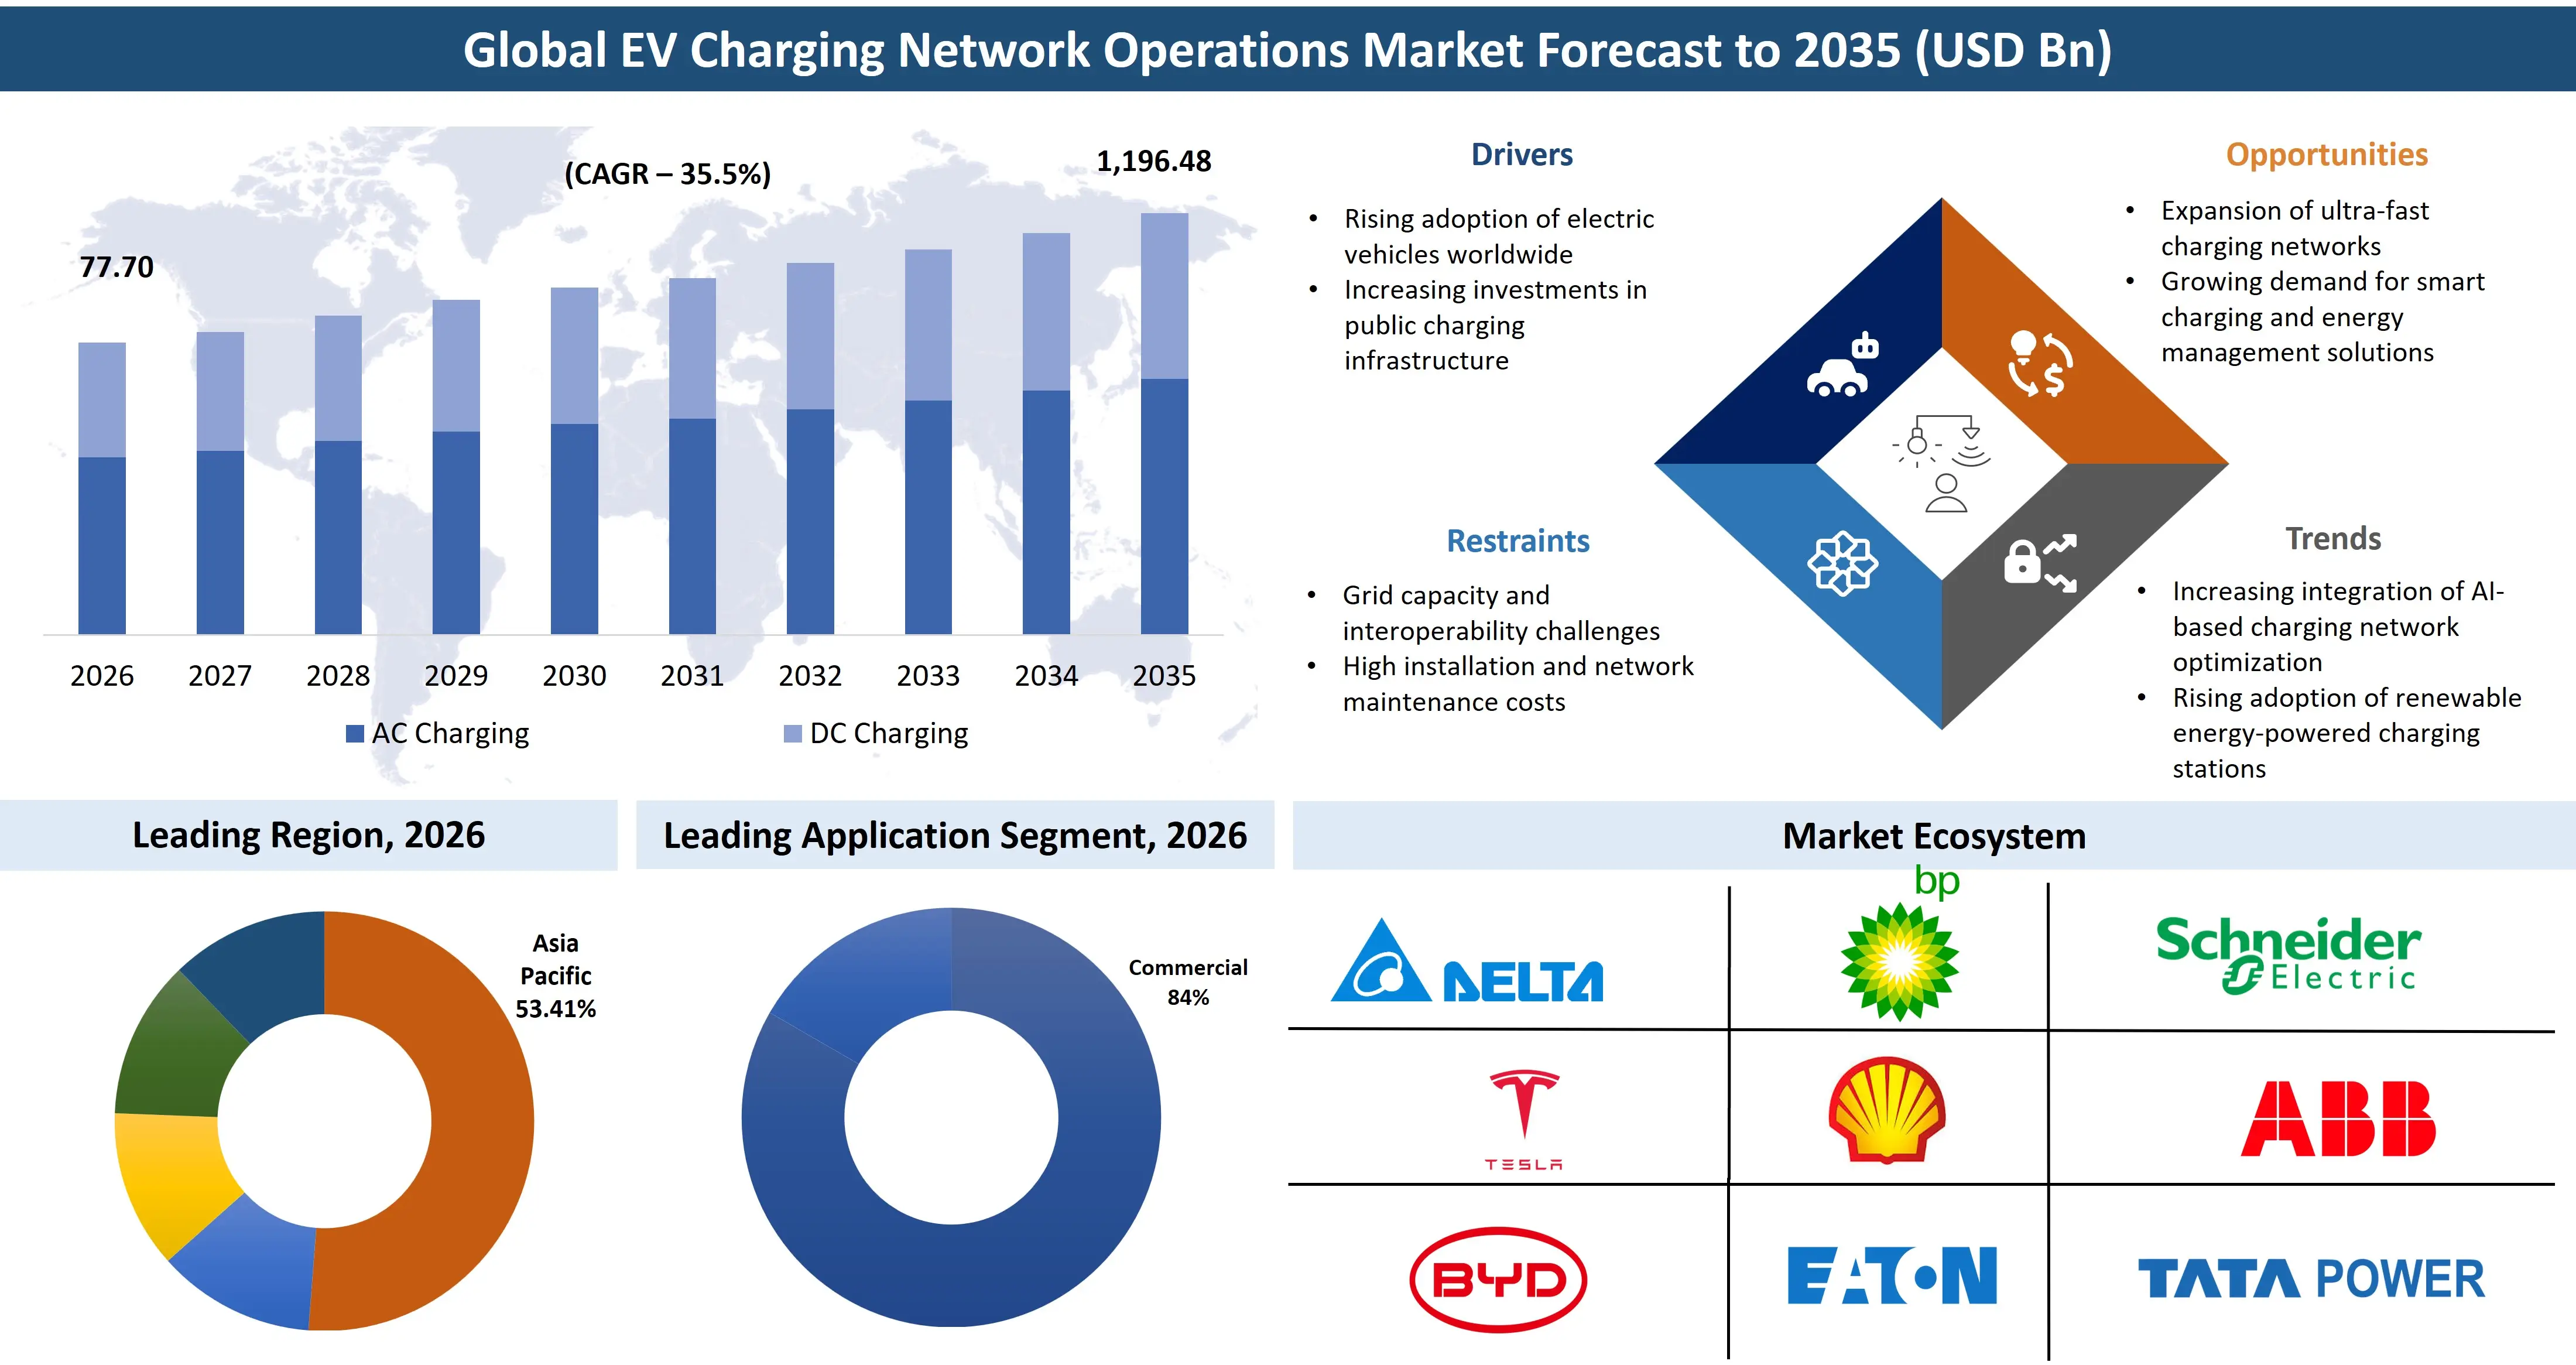
- The EV Charging Network Operations market size is USD 57.34 Billion in 2025, reached USD 77.70 Billion in 2026, and is projected to hit USD 1,196.48 Billion by 2035 at a CAGR of 35.5%.
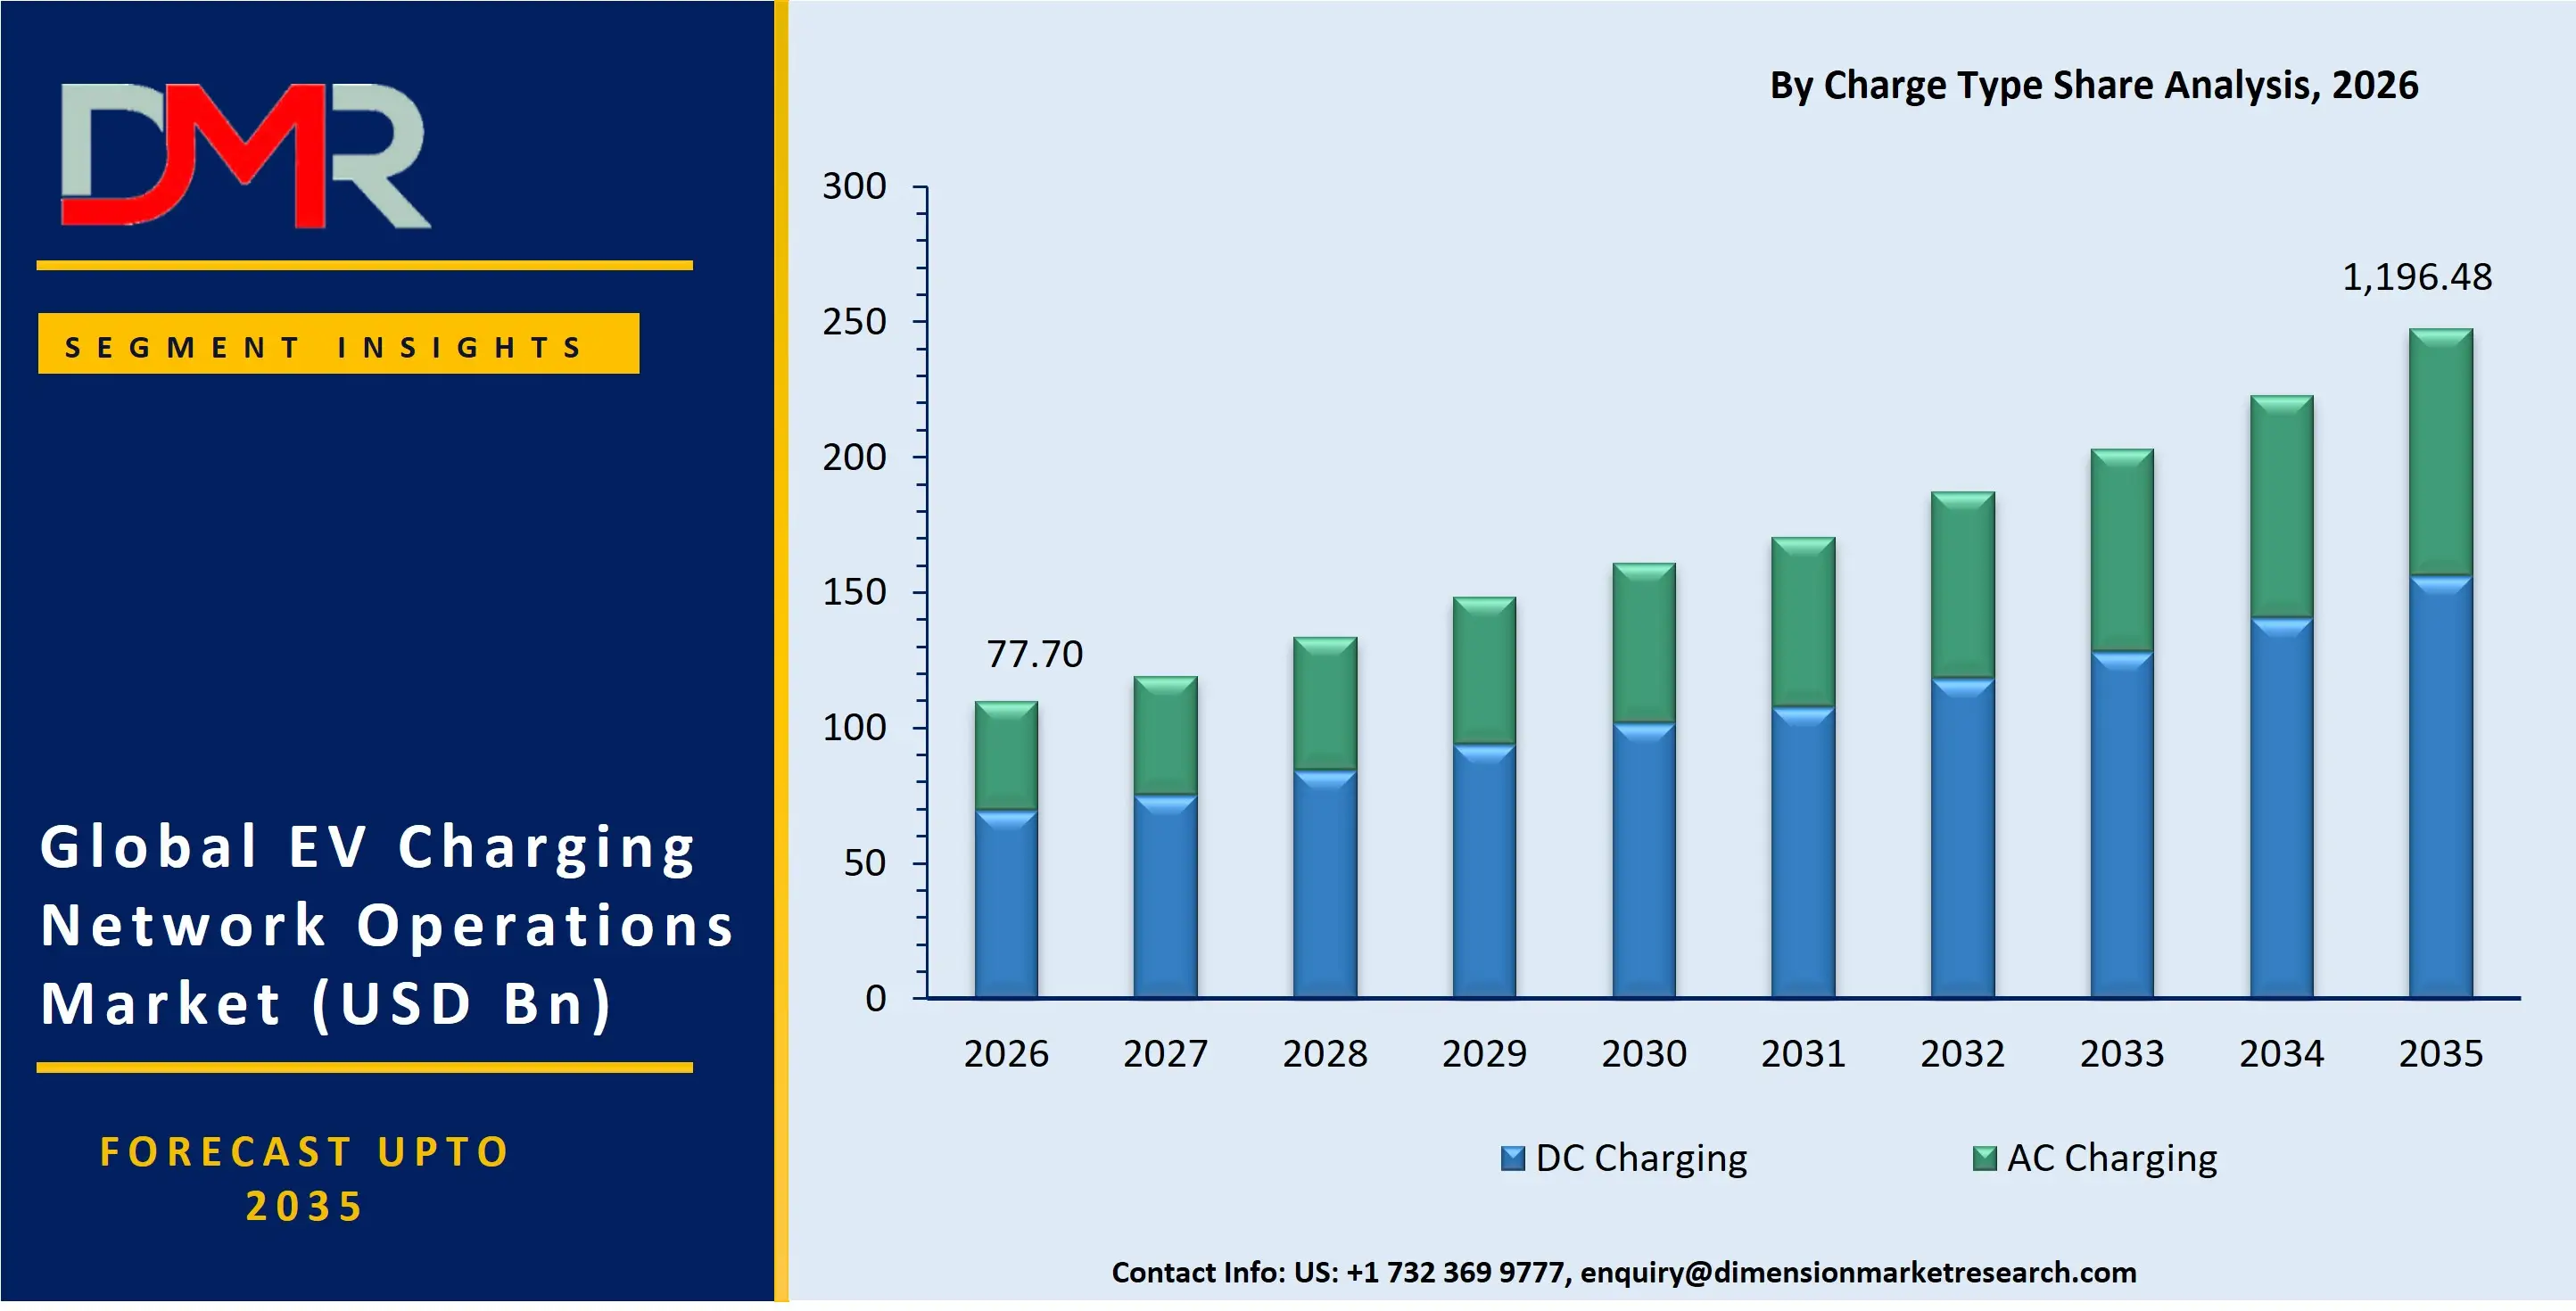
- By Charger Type: DC Charging led with a 89.6% share in 2026.
- By Connector Type: Combined Charging System (CCS) led the connector segment in 2026.
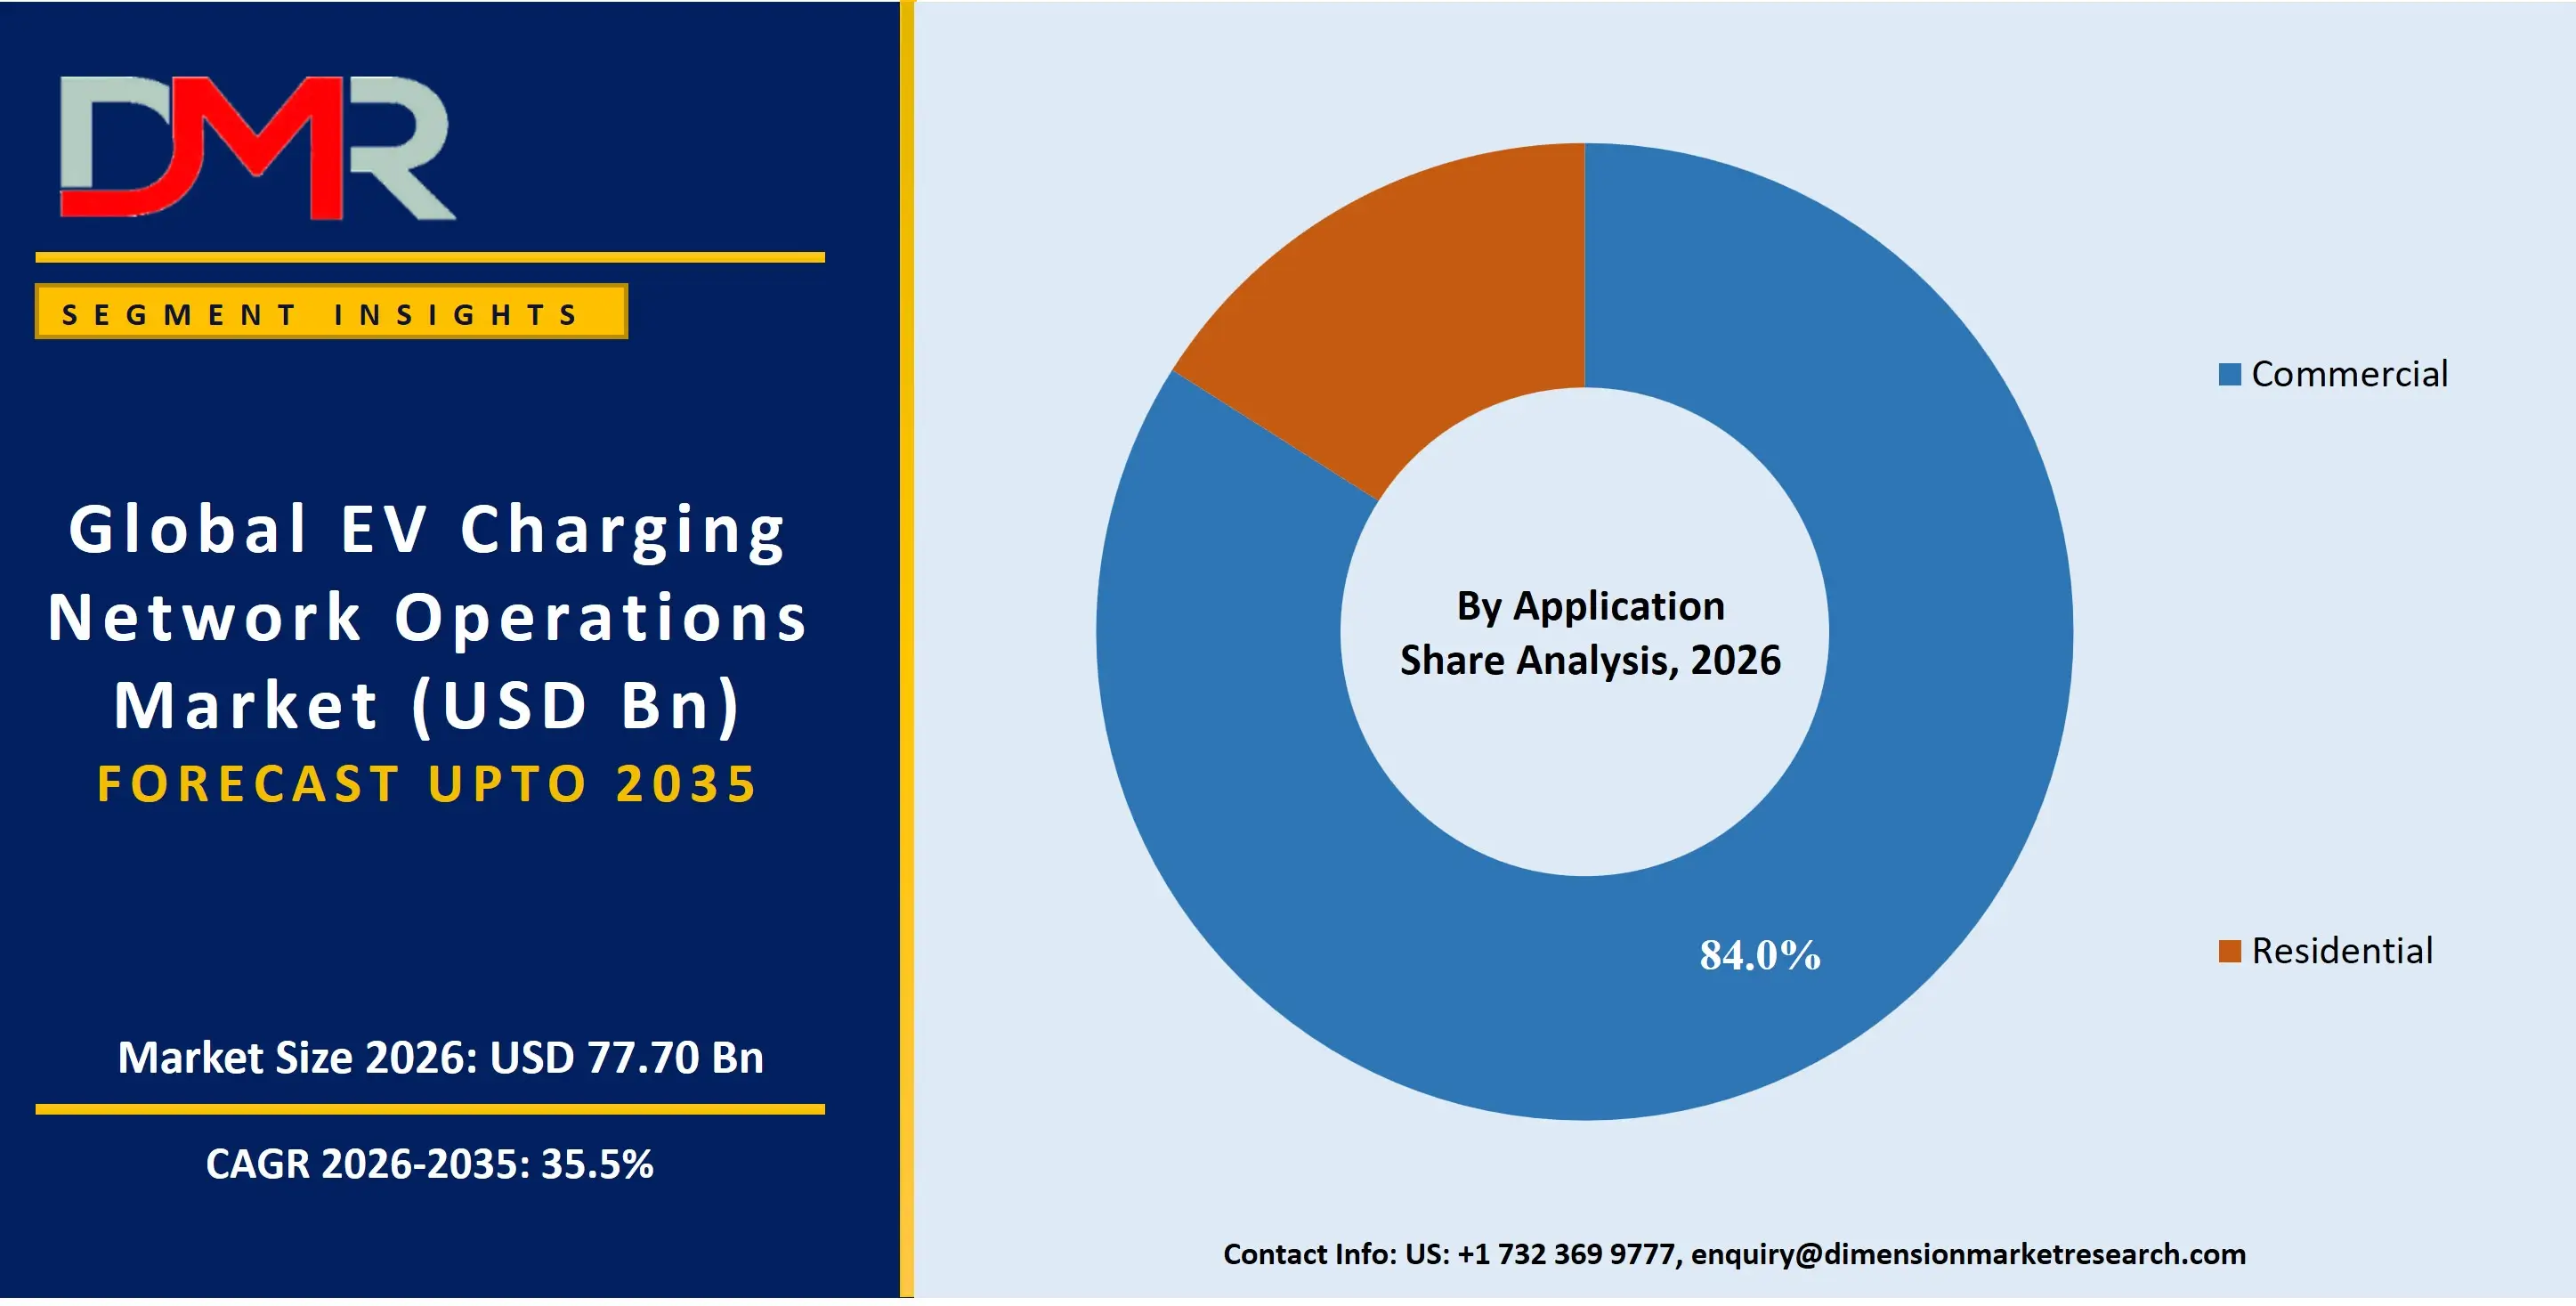
- By Application: Commercial led with a 84% share in 2026.
- By Installation: Fixed Charging led the installation segment in 2026.
- By Charging Location: Home Charging led with a 92% unit-based share in 2026.
- By Charging Method: Wired Charging led the charging method segment in 2026.
- By Charge Port Tier: DC Fast Charging Ports (DCFC) led the charge port tier segment in 2026.
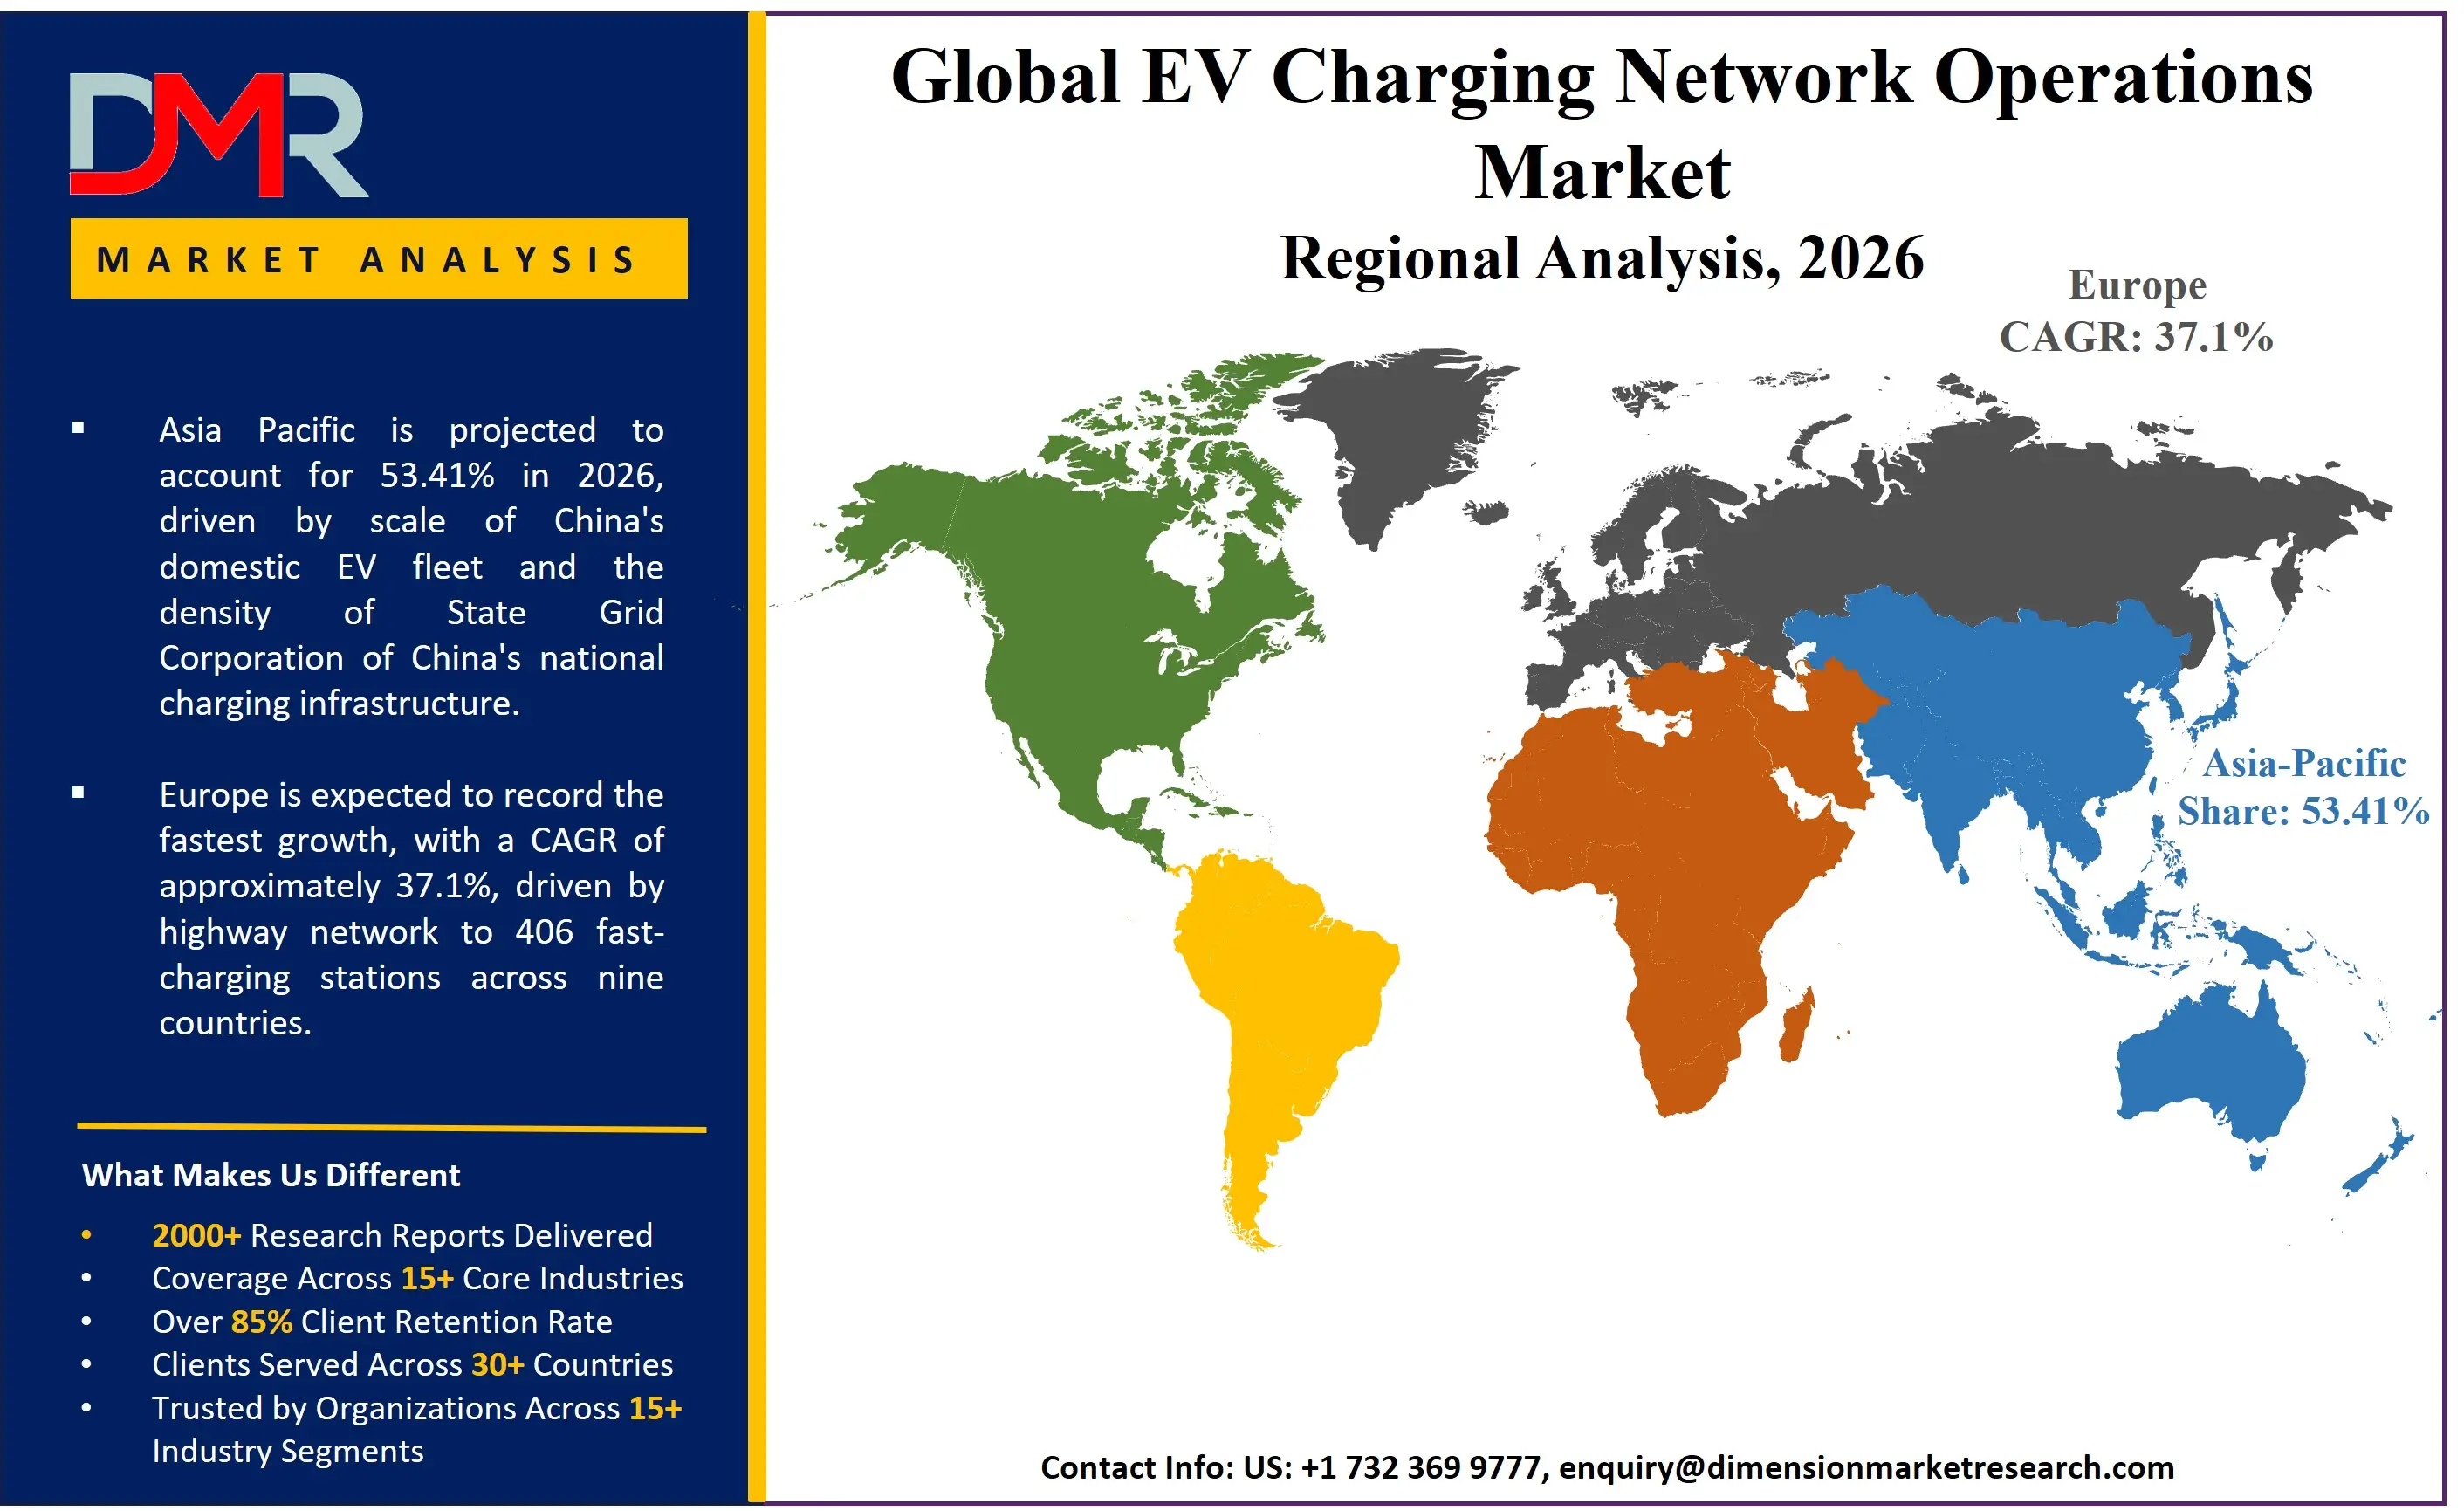
- By Region: Asia Pacific led with a 53.41% share in 2026.
- The U.S. market was valued at USD 7.0 Billion in 2025, growing at a CAGR of 30.3% through 2030.
Market Overview
The EV Charging Network Operations market covers the deployment, management, and optimization of physical and software infrastructure that delivers electrical energy to battery electric vehicles. The scope spans hardware assets including DC and AC chargers, network management platforms, subscription services, and demand response systems. Fleet telematics integration, grid connection agreements, and uptime compliance contracts all fall within the operational boundary. Consumer electronics charging and stationary battery storage not connected to EV delivery are excluded.
ℹ
To learn more about this report –
Download Your Free Sample Report Here
Network operators now sit at the center of a broader energy transition ecosystem, connecting automakers, utilities, real estate developers, and government agencies. Revenues flow from session fees, cloud-based software subscriptions, hardware sales, and capacity service agreements. Fastned's multi-country network delivered 183.0 gigawatt-hours of renewable energy to electric vehicles across its highway installations in 2025, demonstrating that operators capable of scaling renewable energy throughput are attracting both institutional capital and long-term fleet contracts.
Artificial intelligence is reshaping backend operations at speed. Operators are deploying AI-native agents to automate error diagnosis, metadata validation, and real-time session troubleshooting across distributed port networks. Operators who embed predictive uptime management into their platforms now carry a structural cost advantage over those still relying on reactive field maintenance. The ability to meet 97% uptime SLA thresholds at scale, without proportionally expanding field service headcount, separates the operators building durable margin from those spending into growth.
Market Size and Forecast
The Global EV Charging Network Operations Market size is estimated at USD 77.70 Billion in 2026 from USD 57.34 Billion in 2025, and is projected to reach USD 1,196.48 Billion by 2035, exhibiting a CAGR of 35.5% during the forecast period.
The scale of this trajectory becomes clearest when measured against session volume growth. National fast-charging sessions across U.S. networks climbed to 141 million annually in 2025, as reported by charging infrastructure tracking bodies, signaling that operator revenue bases are accumulating real utilization density, not just port count. Fastned crossed the €100 million annual revenue threshold for the first time in 2025, recording €122.4 million in charging revenue, a 47% year-over-year gain per its 2026 financial disclosure. Both data points show that operator economics are improving even before the bulk of the forecast period's EV fleet expansion arrives.
The forecast assumes continued policy deployment in the U.S. and EU, sustained automaker EV production ramp-ups, and accelerating replacement of older slow-charge infrastructure with high-power dispensers. A downside scenario exists if domestic manufacturing mandates delay hardware procurement cycles. An upside scenario exists if automaker-operator partnerships accelerate multi-thousand-port rollouts at rates exceeding current planning assumptions.
Charger Type Analysis
DC Charging accounted for 89.6% of charger type demand in 2026, the highest of any category.
DC Charging's near-total dominance reflects a structural shift in buyer priorities. Fleet operators and highway corridor developers both prioritize session speed above all other specifications. A 30-minute fast charge window fits commercial vehicle duty cycles in ways that AC overnight charging cannot. ChargePoint's networked charging systems generated $52.6 million in revenue in Q4 of fiscal year 2025 alone, as reported by the company, confirming that hardware-linked to high-power DC delivery remains the primary commercial anchor for subscription platform growth.
ℹ
To learn more about this report –
Download Your Free Sample Report Here
AC Charging retains a clear role in residential and workplace settings where dwell times are long and grid connection costs must stay low. Mixed-connector assemblies combining NACS and CCS ports accumulated 18% of all newly deployed infrastructure ports in Q4 2025, per industry tracking data, showing that connector standardization is pulling new DC deployments toward universal compatibility rather than proprietary lock-in. Vendors positioned across both DC and AC categories capture the full addressable base, while DC-only specialists capture the higher-margin, higher-throughput commercial corridor segment.
Connector Type Analysis
Combined Charging System (CCS) led the connector type segment with the highest deployment share in 2026.
CCS dominance is under active pressure from NACS adoption. All large automakers committed to transitioning to the North American Charging Standard, and non-Tesla networks doubled their installed NACS connector bases to over 2,100 ports by Q4 2025. Operators who delay mixed-connector upgrades risk stranding new NACS-equipped EV buyers at CCS-only locations, a friction point that directly reduces session volumes and per-port revenue.
CHAdeMO's installed base continues to shrink as Japanese automakers align to global standards. Type 2 retains relevance across European AC markets and managed workplace charging contexts. The connector transition is less a technology choice than a commercial deadline: networks that complete NACS integration before 2027 will capture the growing population of Ford, GM, and Toyota EV buyers without requiring those drivers to carry adapters.
Application Analysis
With an 84% share in 2026, Commercial outpaced all other application categories.
Commercial dominance reflects who controls the capital decision. Fleet operators, logistics companies, and retail destination hosts all treat charging infrastructure as a productivity asset, not a convenience amenity. Uptime SLA requirements built into commercial contracts enforce 97% availability standards, which drives operators toward higher-quality hardware and professional network management platforms. That operational discipline, in turn, produces the session volume density that justifies further capital deployment.
ℹ
To learn more about this report –
Download Your Free Sample Report Here
Residential applications retain strategic importance as a complementary channel, particularly in multi-family contexts where landlord-tenant charging access is an emerging regulatory mandate in several U.S. states. Growth in residential will not displace commercial revenue leadership, but it does open a separately contractable base of recurring software subscribers for network operators capable of managing mixed portfolios.
Installation Analysis
Fixed Charging led the installation segment with the dominant revenue share in 2026.
Fixed installations generate predictable recurring revenue because they are tied to specific site contracts, grid connection agreements, and maintenance SLAs. A fixed asset at a high-traffic corridor location compounds in value as EV penetration in that catchment area grows. Operators who secured premium fixed locations early, particularly along highway corridors and near logistics hubs, now hold site exclusivity that new entrants cannot easily replicate.
Portable Charging remains a niche category serving event deployments, emergency response, and temporary construction site access. The segment's commercial ceiling is low, but its operational flexibility makes it relevant for operators building service contracts with municipalities and utilities that need guaranteed backup delivery capacity.
Charging Location Analysis
Home Charging captured 92% of the charging location segment in 2026, ahead of all rivals.
The 92% unit-based share reflects volume, not revenue leadership. Home charging units are low-cost, low-power Level 2 devices installed in high quantities. The network operations revenue opportunity in home charging is thin compared to public fast-charging, because session fees, cloud subscriptions, and demand response revenues are all smaller per unit. However, home charging data feeds into network intelligence platforms that optimize grid demand forecasting, making it a strategic data asset even when the hardware margin is minimal.
Workplace Charging, Public Station Charging, and Multifamily Charging each address distinct demand windows. Workplace delivers high dwell-time utilization during business hours. Public stations capture range-anxiety-driven fast charging on corridors. Multifamily is the most underserved of the three, constrained by shared infrastructure ownership complexity. Operators who solve multi-tenant access billing and grid connection cost allocation for multifamily buildings will capture a segment that competing public networks cannot reach.
Charging Method Analysis
Wired Charging led the charging method segment with the dominant share in 2026.
Wired charging infrastructure delivers higher energy transfer efficiency and lower capital cost per kilowatt of installed capacity than wireless alternatives at current technology maturity levels. Every major fast-charging corridor deployment relies on wired connections, and no automaker has committed to removing the charge port from production vehicles in the near term.
Wireless Charging is advancing through strategic mergers rather than organic deployment. Electreon's acquisition of InductEV's high-power stationary charging portfolio in March 2026 positions the combined entity to scale wireless infrastructure targeting heavy-duty transit and freight fleets. Wireless will not displace wired charging in the forecast period, but the technology's ability to serve automated and autonomous freight applications creates a credible long-term commercial case for fleet operators building 10-year infrastructure plans.
Charge Port Tier Analysis
DC Fast Charging Ports (DCFC) led the charge port tier segment with the dominant revenue share in 2026.
DCFC dominance is self-reinforcing. High-power ports generate higher per-session revenue, attract commercial fleet contracts, and justify the grid upgrade investments that further increase site capacity. U.S. open DCFC locations grew by 30% year-over-year to over 18,000 open locations in 2025, per industry tracking data, confirming that the infrastructure buildout is tracking ahead of earlier federal deployment timelines.
Level 2 Public Ports serve lower-throughput demand in retail parking, hospitality, and multifamily settings. Revenue per port is lower, but portfolio diversification across both tiers gives network operators a wider site-type addressable market. Operators concentrated exclusively in DCFC face higher capital intensity and longer payback periods on new sites, while those with mixed-tier portfolios spread that risk across a broader customer base.
Key Market Segments
By Charger Type
By Connector Type
- Combined Charging System (CCS)
- CHAdeMO
- Type 2
By Application
By Installation
- Fixed Charging
- Portable Charging
By Charging Location
- Home Charging
- Workplace Charging
- Public Station Charging
- Multifamily Charging
By Charging Method
- Wired Charging
- Wireless Charging
By Charge Port Tier
- DC Fast Charging Ports (DCFC)
- Level 2 Public Ports
Regional Analysis
Asia Pacific led all regions with a 53.41% revenue share in 2026, the dominant position in the global EV Charging Network Operations market.
Asia Pacific's leadership reflects the scale of China's domestic EV fleet and the density of State Grid Corporation of China's national charging infrastructure. China's combination of government-owned network assets, high-volume EV production, and urban density creates utilization rates that no other region can yet match. Tata Power's expansion in India and BYD's integrated charging ecosystem across Southeast Asia confirm that the region's dominance is multi-country in structure, not solely Chinese in origin.
ℹ
To learn more about this report –
Download Your Free Sample Report Here
Europe is advancing rapidly across multiple fronts. Fastned grew its highway network to 406 fast-charging stations across nine countries by December 31, 2025, up from 346 locations at year-end 2024. France reached 59 operational Fastned stations, while Germany finished 2025 with 54 active locations, both countries crossing the 50-station threshold that signals corridor coverage maturity. High-density Netherlands markets sustained average station revenue of €331,000 per station in 2025, up from €270,000 in 2024, confirming that European operator economics improve as fleet penetration rises. North America trails Asia Pacific and Europe in network density but holds structural advantages in NEVI-funded corridor development and private capital access that will narrow the gap through 2030.
Key Regions and Countries
North America
Europe
- Germany
- France
- The UK
- Spain
- Italy
- Rest of Europe
Asia Pacific
- China
- Japan
- South Korea
- India
- Australia
- Rest of APAC
Latin America
- Brazil
- Mexico
- Rest of Latin America
Middle East & Africa
- GCC
- South Africa
- Rest of MEA
Market Dynamics
Driver: Federal Funding and Fast-Charging Port Expansion Accelerate Network Buildout
U.S. open DCFC locations grew 30% year-over-year to over 18,000 open locations in 2025, with non-Tesla networks adding 184 micro-hubs carrying 10 or more ports each, per industry deployment tracking. The U.S. Federal Highway Administration approved 52 state plan updates and released $885 million in NEVI Formula Funding through July 2024, converting federal authorization into shovel-ready site construction at a pace most operators had not modeled. Non-Tesla networks doubled installed NACS connector bases to over 2,100 ports by Q4 2025, confirming that standardization is accelerating deployment, not slowing it.
Session throughput confirms that new infrastructure is being used, not just built. EVgo's network delivered 366 gigawatt-hours of energy across its stalls in 2025, a 32% increase over the 277 gigawatt-hours recorded in 2024, as reported by the company in March 2026. Fastned's European highway installations recorded 6.8 million fast-charging sessions in 2025, a 26% year-over-year increase, per Fastned's 2026 annual disclosure. EVgo's Q4 2025 throughput of 99 gigawatt-hours, up 18% from the 84 gigawatt-hours delivered in Q4 2024, signals that the peak utilization window is compressing into fewer months of each year as fleet penetration deepens. AMPECO's November 2024 Series B raise of $26 million, backed by BMW i Ventures, confirmed that software-layer operators building network management capacity are attracting institutional capital alongside hardware-focused players.
Restraint: Procurement Mandates and Uptime Obligations Compress Operator Margins
The U.S. FHWA's "Build America, Buy America" enforcement, requiring 100% domestic steel and iron housings and domestic component costs exceeding 55% beginning July 2024, added procurement friction at exactly the moment when operators needed to accelerate hardware sourcing. Fastned's annual network operation costs climbed to €52.5 million in 2025, a 47% increase year-over-year matching its expanded grid connectivity obligations, as reported in its 2026 annual disclosure. That cost structure reveals the margin compression that arrives when physical expansion outpaces software-driven efficiency gains.
ChargePoint reduced its full-year non-GAAP operating expenses by 5% to $230.6 million in fiscal year 2026, down from $243.4 million in fiscal year 2025, per the company's fiscal year 2026 financial results. That reduction signals platform optimization at scale, but it also reflects the ceiling that state-level NEVI contracts impose: mandatory 5-year maintenance SLAs securing 97% minimum uptime require sustained field service investment that limits how aggressively operators can cut costs without risking contract penalties.
Opportunity: Discretionary Capital Reallocation and Fleet Partnership Models Create New Revenue Channels
The U.S. Department of Transportation opened its second round of the Charging and Fueling Infrastructure Grant Program in May 2024 with $1.3 billion in infrastructure funding. EVgo added over 93,000 new user accounts in Q4 2025 alone, closing the year with 1.6 million total customer accounts, as reported by the company in March 2026. Those two data points together indicate that public capital is creating the infrastructure base while consumer adoption is filling it with paying sessions faster than operators had forecast.
The Ionna fast-charging network, launched by automaker partners targeting 30,000 high-powered ports, represents a structural shift in how capital reaches charging infrastructure. Automaker-backed networks carry balance sheet strength and guaranteed vehicle ecosystem demand that independent operators cannot match. Independent operators who secure co-branded agreements with automakers, as EVgo did with Toyota's 350 kW multi-vehicle dedicated public sites in March 2025, convert competitive pressure into a contracted revenue stream. The U.S. Federal Highway Administration's August 2025 guidance allowing fully built-out alternative fuel corridors to shift discretionary funds to public roads statewide further extends the addressable geography for operators ready to deploy quickly.
Market Trends
High-Power Dispensers and Automated Session Management Define the Next Network Generation
250 kW-plus superchargers reached 55% of new non-Tesla network deployments in Q1 2026, per industry tracking data, confirming that high-power delivery has crossed from premium to standard. U.S. fleet operators scaled average port-to-station ratios from 3.6 to 4.5 ports per location by Q4 2025, a structural shift that turns each station into a higher-throughput revenue hub. EVgo's 5,100 operational fast-charging stalls by December 2025, up 25% year-over-year from 4,080 stalls, shows physical scale tracking alongside power-tier upgrades. EVgo's Autocharge+ protocol initiated 30% of all public fast-charging sessions conducted across its grid in Q4 2025, signaling that frictionless automated identification is no longer a differentiator but a baseline expectation. AMPECO's March 2026 launch of CoOperator, an AI-native conversational operations agent, moves backend diagnostics from reactive ticket management to predictive automated resolution, cutting mean-time-to-repair across distributed port estates.
Market Competition Overview
The EV Charging Network Operations market is moderately fragmented, with a small number of scaled operators controlling the high-traffic corridor and commercial fleet segments, while hundreds of regional players compete for residential, workplace, and municipal contracts. Scale economics increasingly favor operators with proprietary software platforms, because subscription revenue offsets hardware margin volatility and creates recurring cash flow that funds further network expansion. EVgo's total corporate revenue reached $384.1 million for full year 2025, up 50% from $256.8 million in 2024, as reported by the company in March 2026, demonstrating that operators who combine public fast-charging scale with software-linked fleet services can achieve growth rates that purely hardware-focused competitors cannot match.
Software platform stickiness is becoming the primary competitive moat. ChargePoint's Q4 fiscal year 2026 subscription revenue of $42.5 million represented an 11% year-over-year increase, per the company's fiscal year 2026 results. The Netherlands-anchored Fastned network sustained an average station revenue of €331,000 per site in 2025, up from €270,000 in 2024, per Fastned's 2026 annual disclosure, proving that high-density, high-uptime networks in mature EV markets generate compounding per-asset revenue without proportional capital additions. Operators who cannot demonstrate software-layer differentiation will face sustained margin compression as hardware commoditizes.
Company Profiles
Tesla, Inc. controls the largest proprietary fast-charging network globally through its Supercharger infrastructure. Tesla's strategic opening of the Supercharger network to non-Tesla vehicles, combined with accelerating V4 500 kW Supercharger deployments nationwide, converts a captive fleet asset into a public revenue-generating network. The competitive risk is network dependency: Tesla's charging revenue is structurally linked to its vehicle sales trajectory, and any slowdown in Tesla vehicle adoption directly reduces Supercharger utilization density.
ChargePoint Holdings, Inc. built its competitive position around software platform breadth rather than owned infrastructure. ChargePoint generated $162.4 million in network subscription revenues for full fiscal year 2026, a 13% increase over the $144.3 million recorded in fiscal year 2025, per the company's fiscal year 2026 financial results. Full fiscal year 2026 revenue reached $411.2 million, nearly flat against $417.1 million in fiscal year 2025, indicating that hardware revenue has plateaued while subscription revenue is the active growth engine. In March 2026, ChargePoint finalized a multi-year technology contract valued at $7.5 million with UK operator RAW Charging to deploy over 300 new high-speed DC fast-charging stations running on the ChargePoint platform, confirming international platform expansion as a growth vector.
Key Players
- Tesla, Inc.
- ChargePoint Holdings, Inc.
- ABB Ltd.
- Siemens AG
- Schneider Electric SE
- Eaton Corporation
- EVgo Inc.
- Blink Charging Co.
- BP plc
- Shell plc
- Wallbox N.V.
- EVBox Group
- BYD Company Ltd.
- Delta Electronics, Inc.
- State Grid Corporation of China
- Tata Power Company Ltd.
- TGOOD Global Ltd.
- Tritium DCFC Ltd.
- Leviton Manufacturing Co., Inc.
- Webasto SE
Supply Chain and Value Chain Analysis
Raw material inputs include electrical steel for transformer cores, copper for wiring and busbars, and high-grade aluminum for housing and heat management components. These flow through power electronics manufacturers who produce inverters, rectifiers, and EVSE controllers, then to charging equipment assemblers who integrate hardware into networked dispensers. Site developers and electrical contractors handle grid connection and civil works before operators take ownership of deployed assets. End users, including fleet managers, commercial property operators, and individual EV drivers, access energy through session-based or subscription payment models managed by cloud platforms sitting atop the physical stack.
Maximum value creation concentrates at two points: the software platform layer managing network operations and the high-power hardware tier producing premium per-session revenue. The biggest bottleneck sits at grid connection. Utility interconnection queues in high-demand corridors regularly delay site commissioning by 6 to 18 months, limiting how quickly operators can convert capital investment into revenue-generating assets. Operators who build utility relationships and pre-negotiate grid capacity ahead of site selection compress this bottleneck faster than competitors relying on standard application timelines.
Regulatory Landscape
The U.S. regulatory framework centers on the National Electric Vehicle Infrastructure Formula Program, which enforces minimum 97% uptime requirements, mandatory 5-year maintenance SLAs, domestic component sourcing thresholds, and real-time data reporting obligations on all federally funded stations. The "Build America, Buy America" mandate requires 100% domestic steel and iron housing and domestic component costs above 55% beginning July 2024, directly affecting procurement strategy for operators receiving NEVI capital. Operators who source non-compliant components risk contract clawbacks that eliminate project economics entirely.
Europe's regulatory environment is advancing through the Alternative Fuels Infrastructure Regulation, which sets binding charging point deployment targets along the Trans-European Transport Network by 2025 and 2030. EU member state compliance creates mandated public investment in corridor infrastructure that reduces site-risk for private operators deploying alongside government-funded networks. Combined, U.S. and EU regulatory frameworks act as both a barrier to entry for operators who cannot meet compliance obligations and a competitive moat for those who can.
Investment and White Space Analysis
Fastned raised €110 million through retail bond issuances across three tranches in 2025 to finance capital-intensive high-power charging network expansion across Western Europe, per its 2026 annual disclosure. That financing structure signals that institutional debt markets are now accessible for scaled operators with demonstrated station-level EBITDA and contracted utilization. The investable white space concentrates in three areas: multi-family residential where access billing complexity has held back deployment, heavy-duty freight corridors where wireless and high-power stationary charging infrastructure remains thin, and Southeast Asian markets where EV fleet growth is accelerating ahead of public charging buildout.
Recent Developments
- May 2026: ChargePoint and infrastructure developer OBE Power formalized a North American partnership to deploy 2,500 turnkey EV charging ports across multi-family residential housing properties using an integrated hardware, software, and end-to-end driver support service model.
- 2026: Belgium expanded its intercity fast-charging network to 52 operational Fastned highway charging stations by December 31, 2025, accelerating high-power accessibility along key European shipping routes.
- October 2025: Spain initiated premium commercial fast-charging corridor development with the deployment of its first operational Fastned fast-charging station along the C-32 transport corridor south of Barcelona.
- February 2025: Italy integrated its first high-power highway charging hub within the Fastned network at Truck Park Brescia Est along the heavy-freight A4 Brescia-Verona economic corridor.
Report Details
| Report Characteristics |
| Market Value (2025) |
USD 57.34 Billion |
| Market Value (2026) |
USD 77.70 Billion |
| Forecast Revenue (2035) |
USD 1,196.48 Billion |
| CAGR (2026 to 2035) |
35.5% |
| Base Year for Estimation |
2025 |
| Historic Period |
2020 to 2024 |
| Forecast Period |
2026 to 2035 |
| Report Coverage |
Revenue Forecast, Market Dynamics, Competitive Landscape, Recent Developments |
| Segments Covered |
By Charger Type (DC Charging, AC Charging), By Connector Type (CCS, CHAdeMO, Type 2), By Application (Commercial, Residential), By Installation (Fixed Charging, Portable Charging), By Charging Location (Home Charging, Workplace Charging, Public Station Charging, Multifamily Charging), By Charging Method (Wired Charging, Wireless Charging), By Charge Port Tier (DC Fast Charging Ports, Level 2 Public Ports) |
| Regional Analysis |
North America – US and Canada; Europe – Germany, France, The UK, Spain, Italy, and Rest of Europe; Asia Pacific – China, Japan, South Korea, India, Australia, and Rest of APAC; Latin America – Brazil, Mexico, and Rest of Latin America; Middle East & Africa – GCC, South Africa, and Rest of MEA |
| Competitive Landscape |
Tesla Inc., ChargePoint Holdings Inc., ABB Ltd., Siemens AG, Schneider Electric SE, Eaton Corporation, EVgo Inc., Blink Charging Co., BP plc, Shell plc, Wallbox N.V., EVBox Group, BYD Company Ltd., Delta Electronics Inc., State Grid Corporation of China, Tata Power Company Ltd., TGOOD Global Ltd., Tritium DCFC Ltd., Leviton Manufacturing Co. Inc., Webasto SE |
| Customization Scope |
Customization for segments and region or country level will be provided. Additional customization can be done based on requirements. |
| Purchase Options |
Three license options: Single User License, Multi-User License (Up to 5 Users), Corporate Use License (Unlimited Users and Printable PDF). |
Frequently Asked Questions
What is the biggest investment opportunity in EV Charging Network Operations market?
▾ Multi-family residential charging represents the most underserved high-growth segment. ChargePoint and OBE Power's May 2026 agreement to deploy 2,500 ports across multi-family properties signals that operators with turnkey billing and installation capabilities are moving to capture this gap before regulation mandates access across U.S. states. Heavy-duty freight corridor wireless infrastructure is a secondary opportunity with a longer capital payback window.
Who are the top companies in EV Charging Network Operations market?
▾ Tesla, Inc. controls the largest proprietary fast-charging network globally. ChargePoint Holdings, Inc. leads in network software subscriptions with $162.4 million in subscription revenues for fiscal year 2026. EVgo, ABB, Siemens, Fastned, and State Grid Corporation of China hold significant positions across public fast-charging, hardware manufacturing, and grid-connected network operations respectively.
Which segment is growing fastest and why?
▾ Wireless Charging is the fastest-growing method segment from a low base, accelerating through strategic consolidation including Electreon's acquisition of InductEV's high-power stationary portfolio in March 2026. Within established segments, DC Fast Charging Ports are growing fastest in revenue terms as 250 kW-plus dispensers reach 55% of new non-Tesla network deployments, raising per-port revenue benchmarks across commercial corridor locations.
Which region is growing fastest and why?
▾ Asia Pacific leads in absolute revenue share at 53.41%, but Europe is growing fastest in per-station revenue productivity. Fastned's European network averaged €331,000 in revenue per station in 2025, up from €270,000 in 2024, as fleet penetration deepens across Germany, France, and the Benelux corridor. North America is the fastest-growing region by new port count, driven by NEVI funding deployment and NACS standardization.
What is the biggest challenge holding EV Charging Network Operations market back?
▾ Grid interconnection queues and domestic component sourcing mandates create the sharpest constraints on deployment velocity. The "Build America, Buy America" requirements enforced from July 2024 forced operators to restructure hardware procurement at exactly the moment federal NEVI funding was accelerating site construction timelines. Mandatory 97% uptime SLAs on federally funded stations add sustained field service cost that limits margin expansion, even as session volumes grow.