Market Snapshot
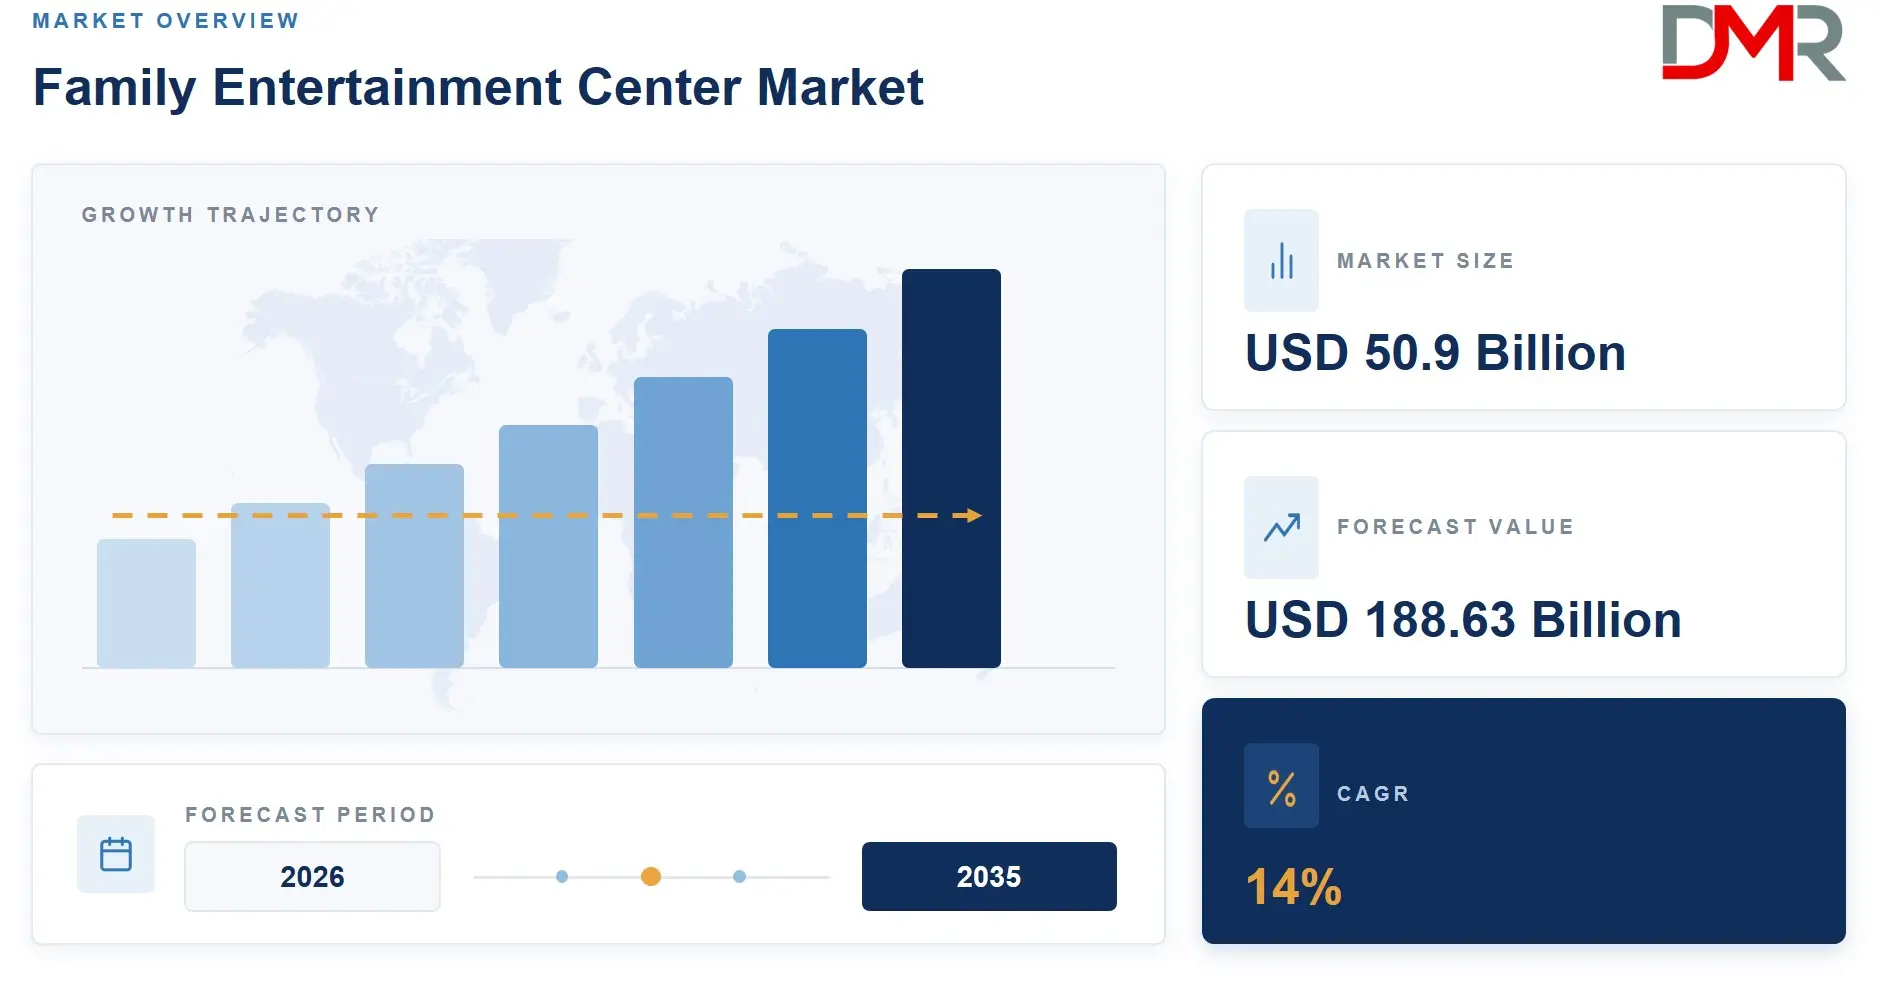
- The global family entertainment center market size reached USD 50.9 billion in 2025
- The market is projected to grow at a CAGR of 14% through 2035
- Skill and Competition Games led activity types with a 42.7% revenue share
- Entry Fees and Ticket Sales led revenue sources with a 45.7% share
- Facilities sized 5,001 to 20,000 sq. ft. led with a 34.8% share
- Families with children aged 0 to 8 led visitor demographics with a 34.4% share
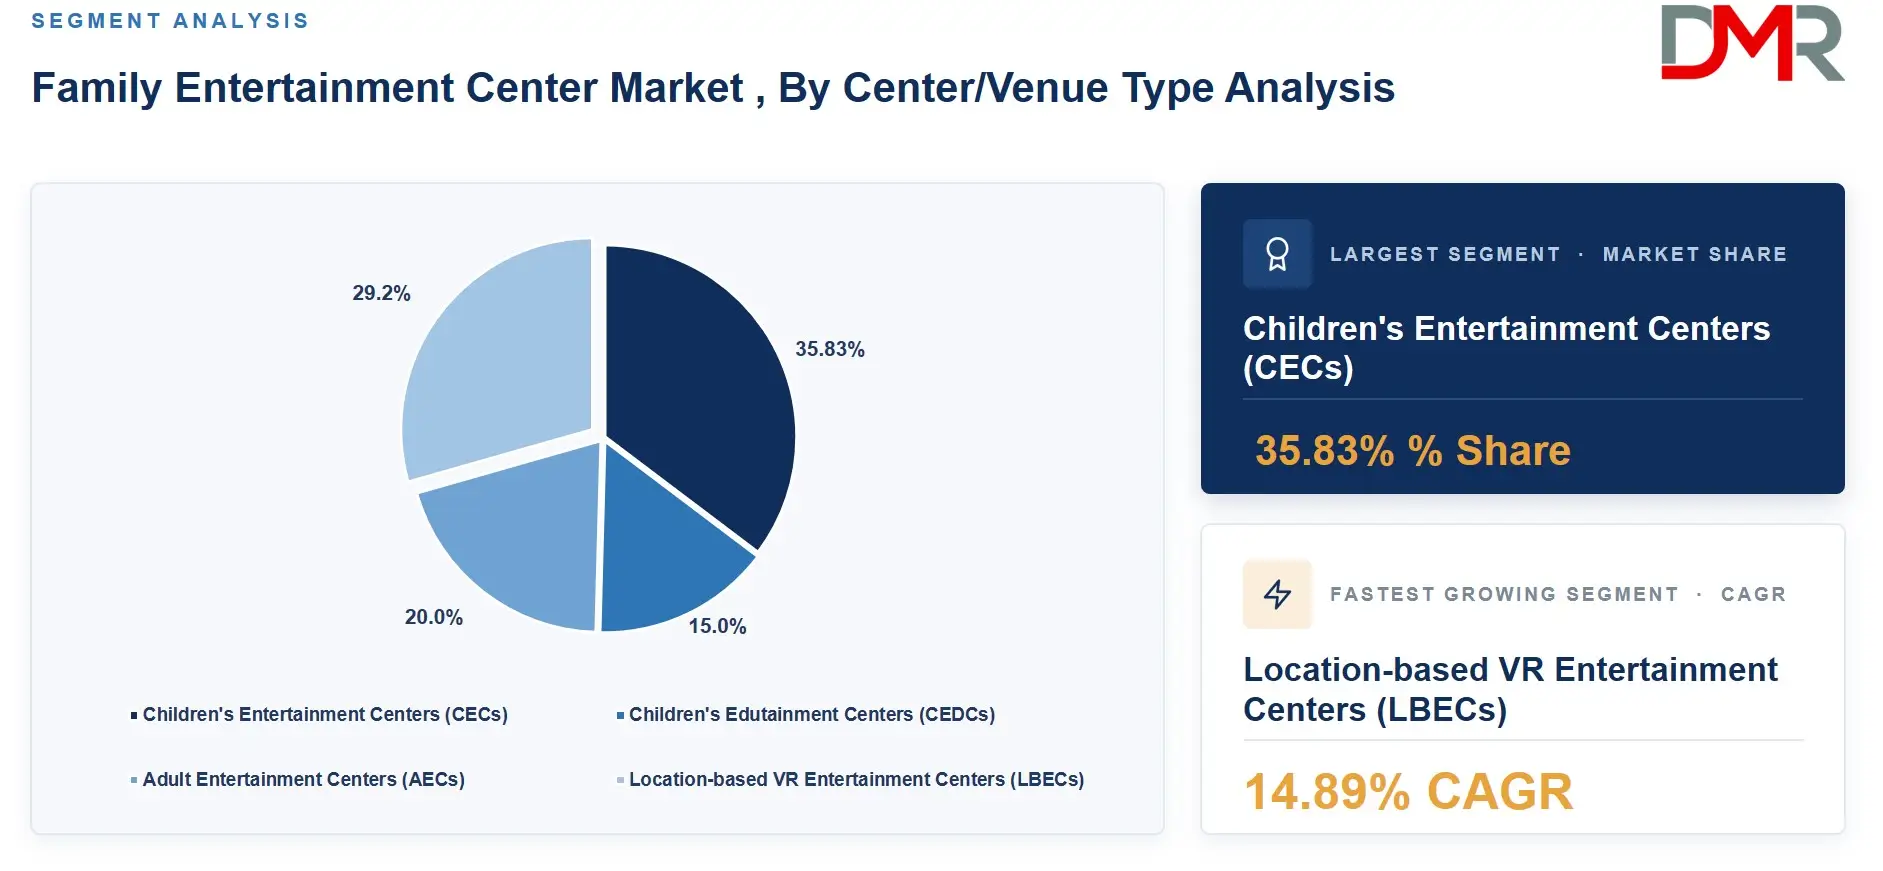
- Children's Entertainment Centers led venue types with a 35.83% share
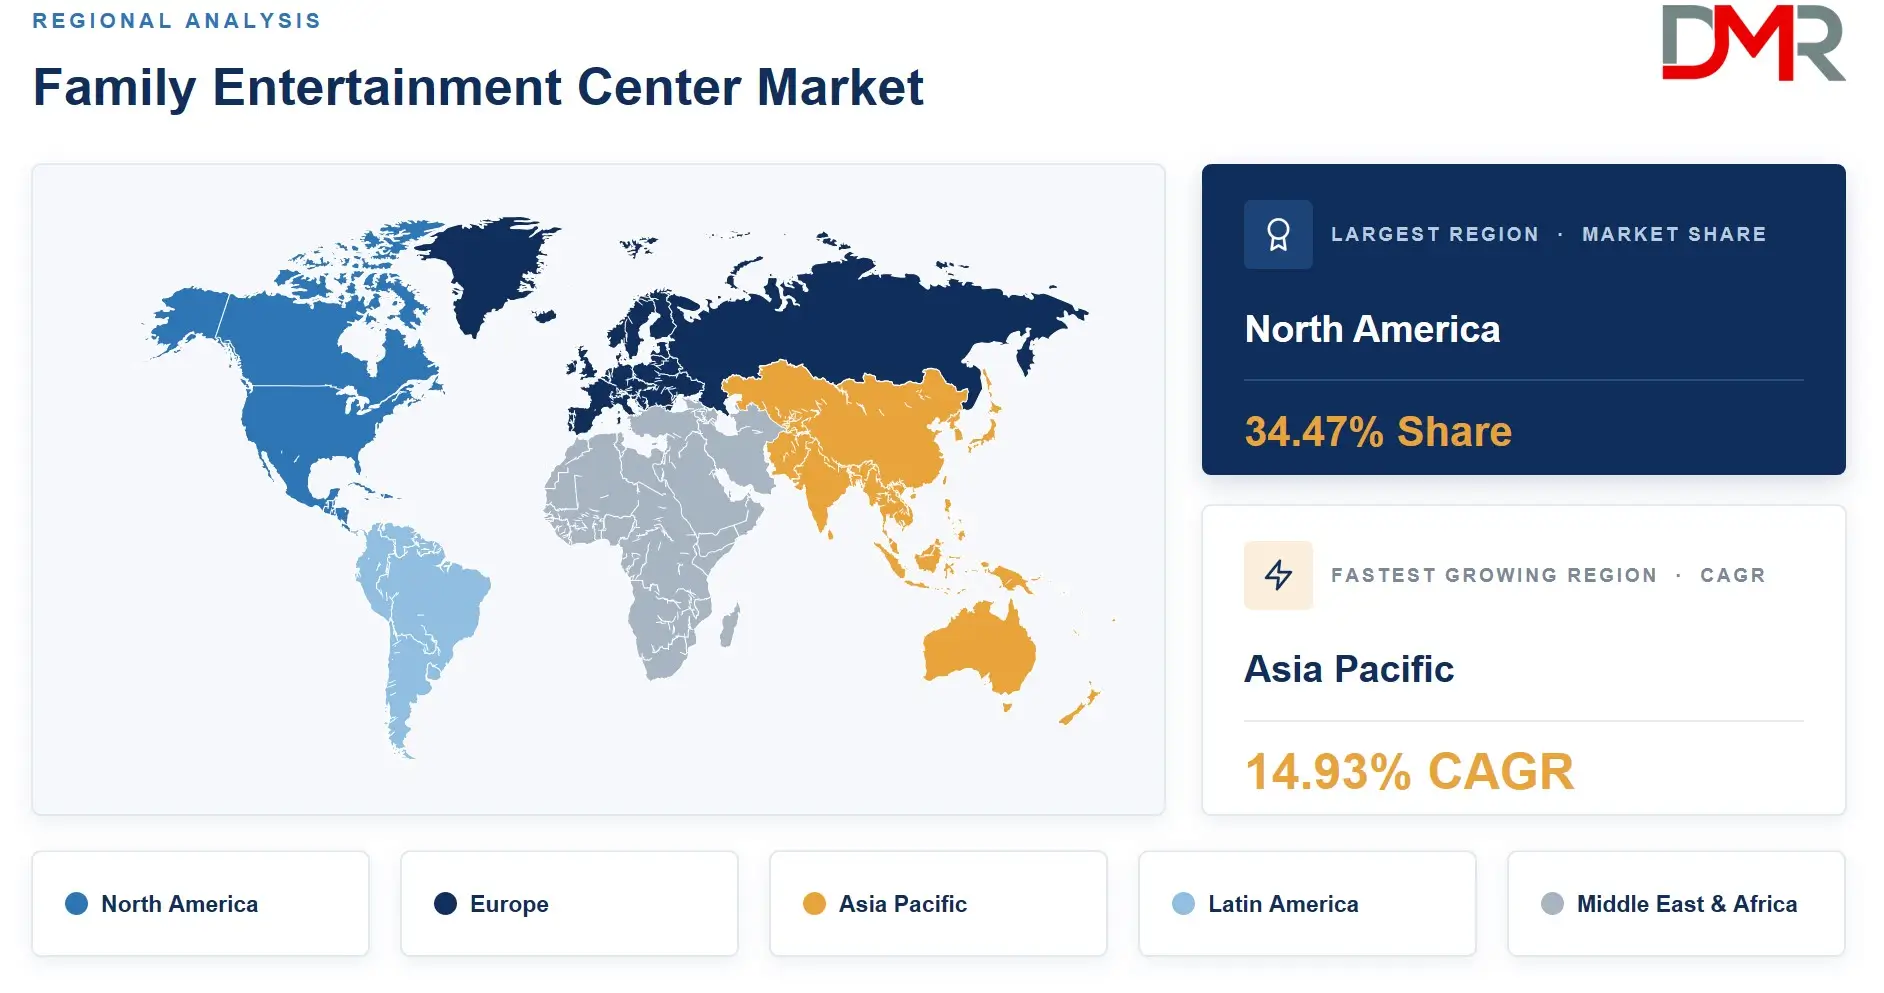
- North America led regional demand with a 34.47% share
Market Overview
The family entertainment center market covers indoor and mixed-use venues built around arcade gaming, trampoline parks, go-kart tracks, bowling, and immersive AR or VR attractions. It excludes standalone movie theaters, traditional theme parks, and outdoor water parks operated as separate business lines. Operators bundle play, food, and events under one roof to capture longer visit durations and higher per-guest spend.
Members at attraction venues visit an average of 4.9 times per year, compared to 1.3 visits among non-members. That gap shows operators with structured loyalty programs convert casual footfall into repeat revenue far more reliably than venues running on walk-in traffic alone. As reported by ROLLER's 2025 Pulse Report, 90% of guests want self-service options such as mobile ordering and kiosk check-in, and the same share prefers booking online. Venues that delay digital self-service investment risk losing guests to competitors offering faster entry.
Broader leisure spending has shifted toward experiences over goods, pulling FEC demand into the same growth lane as live events and competitive socializing. Mall developers now treat entertainment anchors as a substitute for declining retail traffic, linking FEC expansion directly to commercial real estate strategy.
Market Size and Forecast
The Global Family Entertainment Center Market size is estimated at USD 58.03 Billion in 2026 from USD 50.9 Billion in 2025, and is projected to reach USD 188.63 Billion by 2035, exhibiting a CAGR of 14% during the forecast period.
Online bookings generate 45% of total venue revenue despite accounting for only 33% of total bookings, confirming that guests who book ahead spend more per visit than walk-ins. Digital wallet users add to that gap. Findings from ROLLER's 2026 benchmark report show digital wallets made up nearly 23% to 25% of online transactions, with those guests spending 1.96 times more per transaction than card payers. Forecast assumptions rest on continued membership and digital payment adoption rather than new venue construction alone.
ℹ
To learn more about this report –
Download Your Free Sample Report Here
In November 2024, Merlin Entertainments confirmed a USD 110 million Minecraft partnership with Microsoft, signaling that branded IP licensing is becoming a core growth lever for large operators. Smaller chains without licensing budgets face a widening gap against IP-backed venues through 2035.
Activity Type Analysis
Skill and Competition Games led the activity type segment with a 42.7% share in 2026.
Skill and competition formats such as arcade studios and AR or VR gaming zones convert repeat play into measurable spend per visit. Operators favor these formats because score-based games drive social sharing and repeat challenge attempts within a single visit.
Physical play activities, bowling alleys, indoor go-kart tracks, and sports arcades fill out the remaining share. Go-kart and adventure center formats draw teenagers and young adults, a demographic less served by traditional arcade floors. Operators building mixed-format venues now pair skill games with physical attractions to widen their visitor age range beyond families with young children.
Revenue Source Analysis
With a 45.7% share in 2026, Entry Fees and Ticket Sales outpaced all other revenue source categories.
Ticket and entry revenue remains the financial backbone of most venues, particularly where attractions charge per ride or per session. Operators use this base revenue to fund food and beverage expansion, which carries higher margins once installed.
Food and beverages, merchandising and redemption, advertising and sponsorship, and other ancillary streams make up the balance. Birthday party guests show a 41% repeat visit rate at venues offering party packages, compared to 26% at venues without them, a gap that pushes operators to treat parties as a loyalty channel rather than a one-time transaction.
Facility Size Analysis
Facilities sized 5,001 to 20,000 sq. ft. accounted for 34.8% of facility size demand in 2026, the highest of any category.
Mid-sized footprints balance attraction variety against real estate cost, letting operators fit multiple game zones without taking on the capital risk of acre-scale venues.
Smaller venues up to 5,000 sq. ft. suit dense urban locations, while properties spanning 1 to 10 acres and beyond serve outdoor-adjacent formats like go-kart tracks. Franchise operators increasingly favor the mid-size bracket because it scales into suburban strip retail without requiring anchor-tenant leases.
Visitor Demographics Analysis
Families with Children aged 0 to 8 captured 34.4% of the visitor demographics segment in 2026, ahead of all rivals.
Young families anchor weekday and weekend traffic because birthday parties and school holidays cluster around this age group, giving operators predictable demand patterns to plan staffing around.
Older demographics, including teenagers, young adults, and families with children aged 9 to 12, are pulling operators toward competitive socializing formats. Adults aged 25 and above remain underserved, leaving room for adult-only evening programming that does not compete with daytime family traffic.
Center Type Analysis
A 35.83% share made Children's Entertainment Centers the clear leader across center type categories in 2026.
Classic CEC formats built around play structures and arcade floors remain the default model because construction costs are lower than VR-led venues.
Edutainment centers, adult entertainment centers, and location-based VR venues are growing faster off a smaller base. Operators entering the adult and VR categories target evening and corporate audiences that traditional CECs rarely reach.
ℹ
To learn more about this report –
Download Your Free Sample Report Here
Key Market Segments
By Activity/Facility Type
- Skill and Competition Games
- Arcade Studios
- AR and VR Gaming Zones
- Physical Play Activities
- Bowling Alleys
- Indoor Go-Kart Tracks
- Sports Arcades/Adventure Centers
By Revenue Source
- Entry Fees and Ticket Sales
- Food and Beverages
- Merchandising and Redemption
- Advertising and Sponsorship
- Other Ancillary Revenue
By Facility Size
- Up to 5,000 sq. ft.
- 5,001 to 20,000 sq. ft.
- 20,001 to 40,000 sq. ft.
- 1 to 10 Acres
- Over 10 Acres
By Visitor Demographics
- Families with Children aged 0–8
- Families with Children aged 9–12
- Teenagers aged 13–19
- Young Adults aged 20–25
- Adults aged 25 and above
By Center/Venue Type
- Children's Entertainment Centers (CECs)
- Children's Edutainment Centers (CEDCs)
- Adult Entertainment Centers (AECs)
- Location-based VR Entertainment Centers (LBECs)
Regional Analysis
North America led regional demand with a 34.47% share, supported by dense mall-based and standalone venue networks.
US operators benefit from an established franchise infrastructure and a US market valued at USD 6.4 Billion in 2024, growing at an 8.1% CAGR. Mall redevelopment projects across the region continue to favor entertainment anchors over vacant retail space.
Europe and Asia Pacific follow with faster growth off smaller bases, as urban middle-class households in both regions shift leisure budgets toward experience-based outings. Latin America and the Middle East and Africa remain underpenetrated, leaving room for first-mover franchise operators. Guests cite a great past experience as the top reason for returning to a venue at a 79% rate, ahead of price or location, which means regional operators expanding into new markets should prioritize attraction quality over discounting.
ℹ
To learn more about this report –
Download Your Free Sample Report Here
Key Regions and Countries
North America
Europe
- Germany
- France
- The UK
- Spain
- Italy
- Rest of Europe
Asia Pacific
- China
- Japan
- South Korea
- India
- Australia
- Rest of APAC
Latin America
- Brazil
- Mexico
- Rest of Latin America
Middle East & Africa
- GCC
- South Africa
- Rest of MEA
Market Dynamics
Experience Spending Pulls Demand From Retail Goods
Urban middle-class households now route discretionary income toward leisure experiences rather than physical purchases, a shift that benefits FEC operators directly. Venues offering birthday party packages capture this shift best, posting a 41% repeat visit rate among party guests against 26% at venues without packages.
Mall and mixed-use developers reinforce the trend by signing FEC anchors to offset declining retail footfall. In August 2024, Chuck E. Cheese launched its Fun Pass membership program, a direct response to operators chasing recurring revenue instead of single-visit ticket sales.
Real Estate Costs Compress Mid-Sized Operator Margins
High fit-out costs and rising prime-location rents squeeze return on investment for mid-sized venues entering dense urban markets. Capital requirements for technology-enhanced attractions add to that pressure before a venue opens its doors.
Checkout friction compounds the cost problem on the revenue side. As per ROLLER's 2025 Pulse Report, 62% of guests have abandoned an online booking due to a frustrating checkout process, a conversion gap that erodes returns operators already calculated on thin margins.
Tier-2 Expansion and Adult Socializing Open New Demand
Tier-2 and suburban corridors with rising disposable income and few organized indoor leisure options give first-mover operators room to build franchise networks without competing against established urban venues. Eventbrite's 2026 Social Study found 79% of 18 to 35 year olds plan to attend more live events in 2026, a signal that competitive socializing formats can pull young adults away from children-only programming.
Data from ROLLER's 2025 Pulse Report shows 80% of guests feel they receive exceptional value when a venue offers something unique, and 76% say they would pay more for premium experiences. Operators building hybrid formats around food, drinks, and skill-based competition stand to capture that premium willingness directly.
Market Trends
Mobile-First Booking Becomes the Default Guest Journey
Mobile devices now account for 84% of all online bookings at attraction venues, pushing operators to rebuild ticketing, waivers, and check-in around a phone-first experience. Venues still relying on front-desk transactions risk losing share to competitors offering app-based entry, advance booking, and cashless checkout as standard features rather than premium add-ons.
Market Competition Overview
The market remains fragmented across independent operators, regional chains, and a small set of large branded players. Independent venues compete on local pricing and community ties, while corporate chains use scale to fund technology upgrades and IP licensing deals that smaller operators cannot match.
Guest satisfaction scores climbed to 4.29 out of 5 in the 2026 benchmark period, up from 3.95 the year before, showing that operators investing in service quality are pulling ahead of competitors still running on legacy attractions. Acquisitions remain the fastest path to scale, as larger chains buy regional venues to add geographic density rather than build new locations from the ground up.
Company Profiles
Dave and Buster's Entertainment, Inc. anchors its positioning around combining arcade gaming with a full bar and dining format, targeting adult and corporate group visitors rather than children-only audiences. Mobile food and beverage order values at venues like these run 3.3 times higher than counter purchases, reinforcing why operators push mobile ordering across their footprint.
Lucky Strike Entertainment built scale through acquisition rather than organic build-out, rebranding from Bowlero in December 2024 after absorbing Raging Waves Waterpark and later adding five additional parks in July 2025. As per ROLLER's 2025 Pulse Report, 79% of guests now factor sustainability into venue decisions, a pressure point that newly acquired legacy properties will need to address to stay competitive against newer, purpose-built venues.
Key Players
- Dave and Buster's Entertainment, Inc.
- Round One Entertainment Inc.
- Cinergy Entertainment Group
- Scene 75 Entertainment Centers
- Andretti Indoor Karting and Games
- TEEG (Timezone)
- Merlin Entertainments
- Altitude Trampoline Park
- Launch Family Entertainment
- The Walt Disney Company
- Funriders Leisure and Amusement
- Tenpin
- Golfland Entertainment Centers, Inc.
- KidZania S.A.P.I. de C.V.
- The LEGO Group
Recent Developments
- May 2024, Bowlero acquired Raging Waves Waterpark, adding an outdoor water park line to its indoor entertainment portfolio.
- December 2024, Bowlero rebranded as Lucky Strike Entertainment, repositioning its venues under a single premium brand identity.
- July 2025, Lucky Strike Entertainment acquired Raging Waters Los Angeles, Wet 'n Wild Emerald Pointe, Castle Park, Boomers Vista, and 5 total properties in one expansion move.
Report Details
| Report Characteristics |
| Market Value (2025) |
USD 50.9 Billion |
| Market Value (2026) |
USD 58.03 Billion |
| Forecast Revenue (2035) |
USD 188.63 Billion |
| CAGR (2026–2035) |
14% |
| Base Year for Estimation |
2025 |
| Historic Period |
2020 – 2024 |
| Forecast Period |
2026 – 2035 |
| Report Coverage |
Revenue Forecast, Market Dynamics, Competitive Landscape, Recent Developments |
| Segments Covered |
By Activity/Facility Type (Skill and Competition Games, Physical Play Activities), By Revenue Source (Entry Fees and Ticket Sales, Food and Beverages, Merchandising), By Facility Size, By Visitor Demographics, By Center/Venue Type, By Ownership, By Event and Booking Type |
| Regional Analysis |
North America – US, Canada; Europe – Germany, France, The UK, Spain, Italy, Rest of Europe; Asia Pacific – China, Japan, South Korea, India, Australia, Rest of APAC; Latin America – Brazil, Mexico, Rest of Latin America; Middle East & Africa – GCC, South Africa, Rest of MEA |
| Competitive Landscape |
Dave and Buster's Entertainment, Round One Entertainment, Cinergy Entertainment Group, Scene 75, Andretti Indoor Karting and Games, TEEG (Timezone), Merlin Entertainments, Altitude Trampoline Park, Launch Family Entertainment, The Walt Disney Company, Funriders Leisure and Amusement, Tenpin, Golfland Entertainment Centers, KidZania, The LEGO Group |
| Customization Scope |
Customization for segments and region or country level will be provided. Additional customization can be done based on requirements. |
| Purchase Options |
Three license options: Single User License, Multi-User License (Up to 5 Users), and Corporate Use License (Unlimited Users and Printable PDF). |
Frequently Asked Questions
What is the biggest investment opportunity in Family Entertainment Center Market ?
▾ Tier-2 and suburban corridors with rising disposable income and few organized indoor leisure venues offer the clearest opening for first-mover franchise operators, particularly with low-capex modular formats.
Who are the top companies in Family Entertainment Center Market ?
▾ Dave and Buster's Entertainment and Lucky Strike Entertainment lead through scale and acquisition activity, while Merlin Entertainments and The Walt Disney Company compete through branded IP partnerships.
Which segment is growing fastest in Family Entertainment Center Market and why?
▾ AR and VR Gaming Zones within the skill and competition category are gaining ground fastest as operators chase the 42.7% share already held by skill-based attractions through richer, technology-led formats.
Which region is growing fastest in Family Entertainment Center Market and why?
▾ Asia Pacific is expanding faster than its current base suggests, as urban middle-class households adopt experience-led leisure spending patterns similar to those driving North America's 34.47% share.
What is the biggest challenge holding Family Entertainment Center Market back?
▾ High fit-out costs and rising prime-location rents compress returns for mid-sized operators, a problem compounded by a 62% online checkout abandonment rate that costs venues revenue before guests ever arrive.