Market Overview
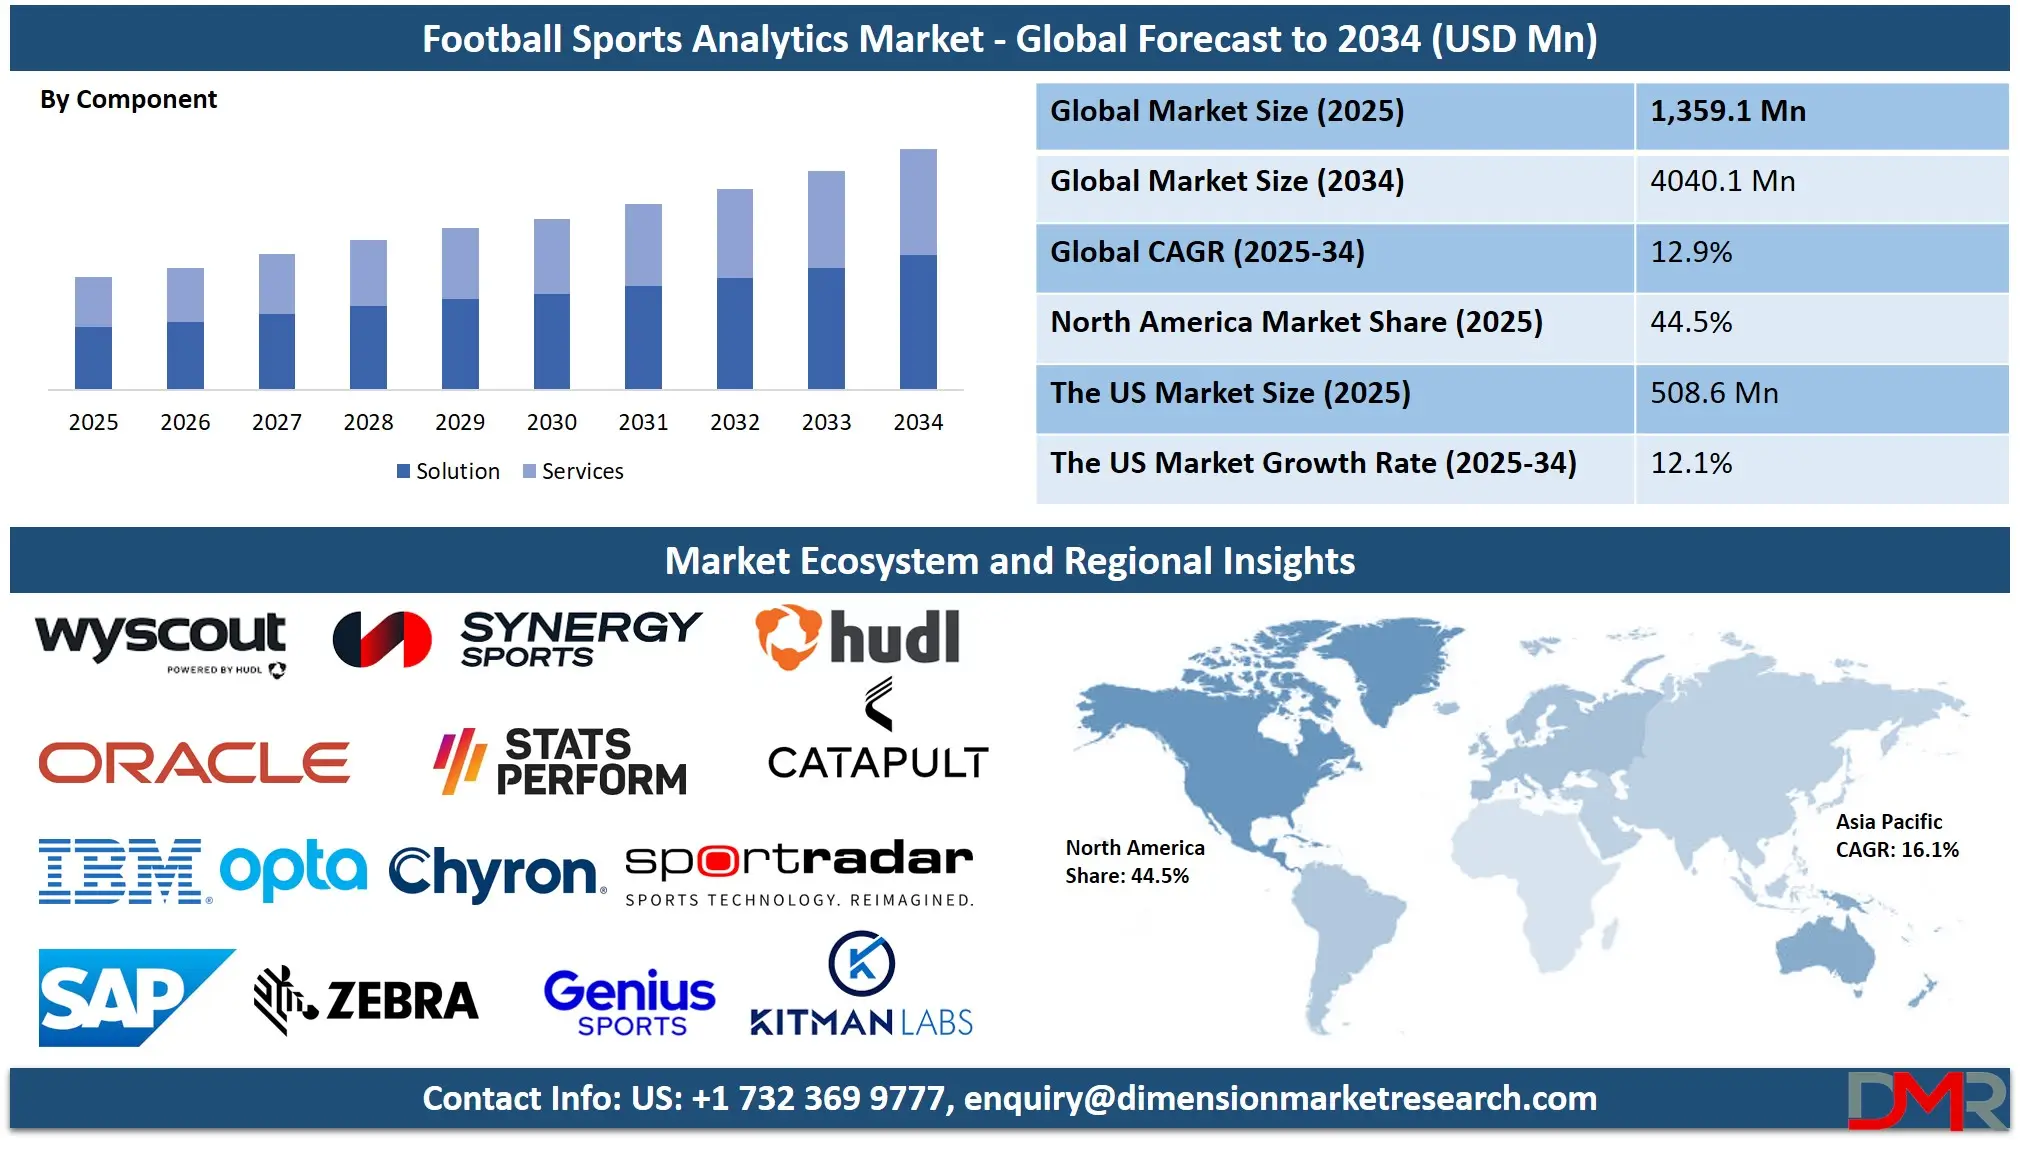
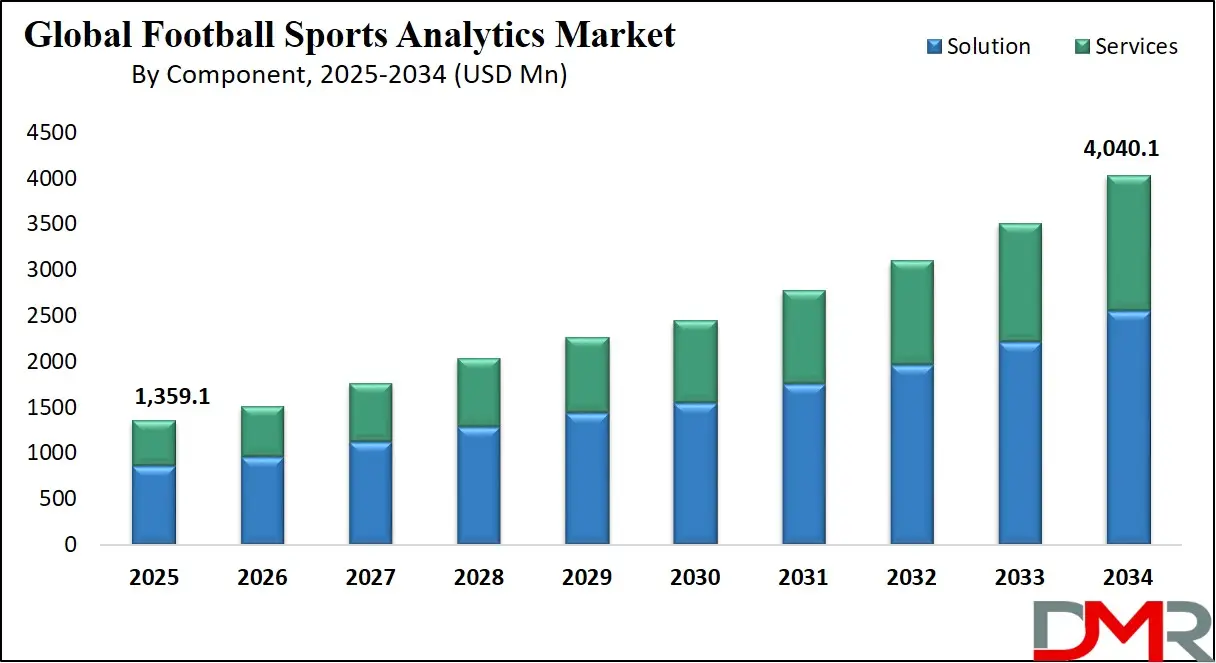
The Global Football Sports Analytics Market is projected to reach USD 1,359.1 million in 2025 and grow at a compound annual growth rate of 12.9% from there until 2034 to reach a value of USD 4040.1 million.
The global football sports analytics market is experiencing a strong surge in adoption, driven by rapid advancements in artificial intelligence, wearable tracking devices, computer vision, and cloud-based data processing. These technologies are transforming how clubs, leagues, and federations evaluate player performance, plan match strategies, enhance fan engagement, and optimize operational decision-making.
Key trends shaping the sector include the integration of predictive analytics for player injury prevention, the use of machine learning for opponent scouting, and real-time data visualization for tactical adjustments. The increasing popularity of immersive fan experiences through augmented reality, interactive match statistics, and personalized content continues to influence investments. Clubs are also adopting advanced biometric monitoring systems to optimize player health, workload, and recovery cycles.
Opportunities are emerging in both elite and grassroots football, with lower-tier clubs embracing affordable cloud-based analytics platforms and mobile data collection tools. Expansion into women’s football, youth academies, and emerging football nations is widening the analytics customer base. Enhanced broadcast integrations and sports betting applications also offer new monetization avenues for data insights.
However, market expansion is tempered by challenges. Smaller organizations face budgetary constraints, and there remains a need for data standardization to ensure interoperability between tracking devices, software platforms, and historical performance records. Privacy concerns, particularly in biometric data management, also require robust governance and compliance measures.
The outlook remains highly positive, with growing alignment between sports science, digital technology, and commercial strategy. As analytics evolve from post-match reviews to real-time decision-making tools, the market is set to deepen its role in shaping competitive outcomes, talent development, and fan connection across global football ecosystems.
The US Football Sports Analytics Market
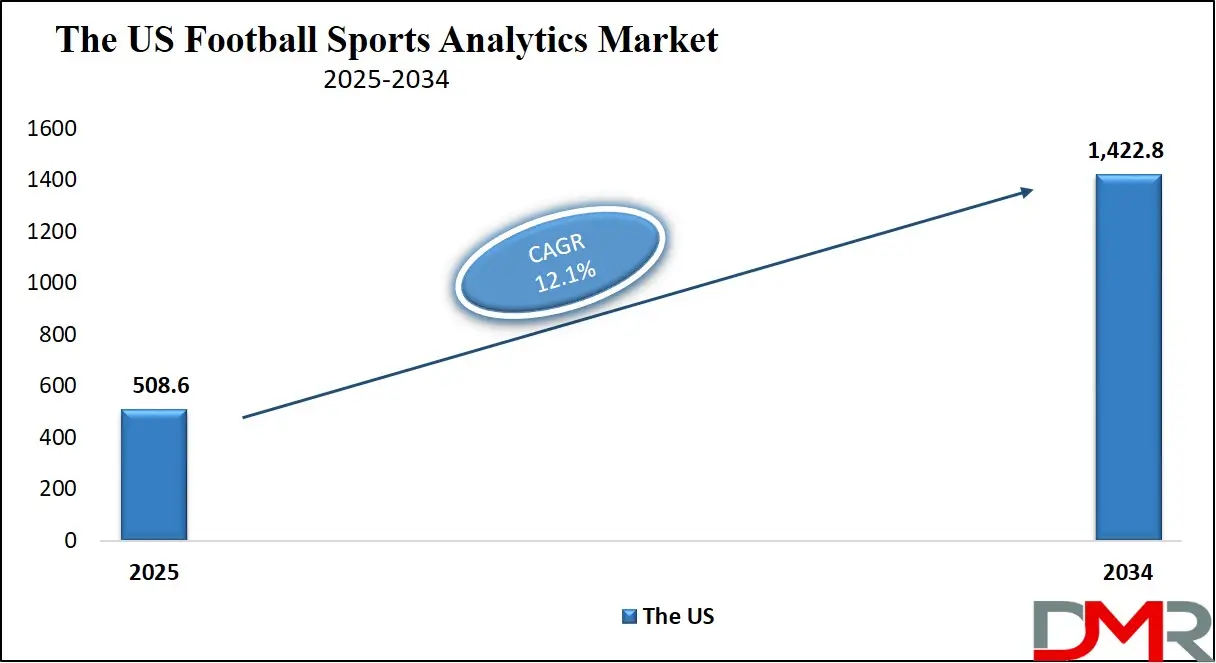
The US Football Sports Analytics Market is projected to reach USD 508.6 million in 2025 at a compound annual growth rate of 12.1% over its forecast period.
The U.S. football sports analytics market benefits from unparalleled data infrastructure, a multi-tiered competition system, and a deep-rooted culture of performance measurement. Youth participation data from national health and education agencies offers detailed insight into early engagement trends, while structured player pathways from high school programs to collegiate leagues generate longitudinal datasets essential for talent development analytics.
Collegiate competitions, particularly under the NCAA, serve as a unique data reservoir, offering performance statistics, biometric information, and tactical analysis opportunities across hundreds of programs. This structured environment supports the development of advanced models for player valuation, recruitment decisions, and injury prevention.
The nation’s demographic diversity further enhances analytics potential, allowing for audience segmentation based on geography, socioeconomic status, and cultural preferences. Fan engagement strategies are increasingly informed by regional participation patterns, stadium attendance metrics, and digital content consumption data from public sports bodies.
Publicly accessible government databases and educational institution records offer a consistent, standardized foundation for analytics, bypassing the need for proprietary market research. Combined with strong investment from professional leagues, advanced wearable tech adoption, and collaboration between sports science departments and analytics vendors, the U.S. stands out as a prime environment for innovation. This integration of demographic insight with technology adoption provides a decisive edge for football analytics adoption nationwide.
The Europe Football Sports Analytics Market
The Europe Football Sports Analytics Market is estimated to be valued at USD 203.8 million in 2025 and is further anticipated to reach USD 521.8 million by 2034 at a CAGR of 11.0%.
Europe’s football analytics ecosystem thrives on its historically entrenched club structures, open competition formats, and comprehensive public sports statistics. From grassroots associations to elite clubs in top-tier leagues, participation data is meticulously gathered by national federations and EU-level agencies, ensuring broad coverage and comparability across countries.
The European Sport Model fosters a continuous pipeline of talent, supported by community-based clubs and structured competitions. This grassroots-to-professional pathway enables analytics systems to track player performance, fitness progression, and match impact over extended careers. Eurostat data on sports participation, physical activity levels, and live sports attendance offers further demographic insights that strengthen audience targeting and engagement analytics.
Football’s cultural prominence across the continent creates an exceptionally rich dataset for tactical and commercial analysis. Clubs leverage fan attendance trends, merchandise preferences, and regional loyalty indicators to fine-tune revenue strategies. Advanced player tracking is increasingly complemented by biomechanical assessments, video analysis, and AI-driven tactical simulations to gain a competitive advantage.
The diversity of football styles from possession-oriented approaches in Southern Europe to high-press systems in Northern leagues also presents unique datasets for comparative performance studies. This regional variation in playing philosophy creates fertile ground for analytics vendors to develop adaptive, context-sensitive models. Combined with strong public investment in sports infrastructure and policy frameworks encouraging technology in sport, Europe remains one of the most dynamic environments for football analytics innovation.
The Japan Football Sports Analytics Market
The Japan Football Sports Analytics Market is projected to be valued at USD 81.5 million in 2025. It is further expected to witness subsequent growth in the upcoming period, holding USD 225.8 million in 2034 at a CAGR of 12.0%.
Japan’s football sports analytics landscape is shaped by an organized governance system, a rapidly expanding fan base, and a strong emphasis on youth development. The Japan Football Association’s centralized oversight of professional, amateur, and school football provides structured, high-quality data pipelines, enabling consistent integration of performance analytics across all competition levels.
High participation rates in youth football, especially among primary and secondary school students, feed directly into academy systems and high school competitions. These competitions, known for their rigorous schedules and technical emphasis, offer rich datasets for evaluating player progression, match influence, and injury trends. The transition from high school and university leagues to the J.League creates a seamless data continuum, beneficial for scouting and player development analytics.
Japan’s strong sports science culture ensures that biometric tracking, GPS-enabled performance monitoring, and video-assisted tactical reviews are integrated into training regimes. Collaboration between universities, sports tech firms, and professional clubs fosters innovation in AI-driven match simulations, opponent analysis, and injury prevention models.
Culturally, Japan’s commitment to discipline, precision, and incremental improvement aligns closely with analytics-based performance optimization. Fan engagement is supported by detailed match statistics, interactive platforms, and broadcast enhancements that cater to an increasingly data-literate audience. With the rising popularity of football among younger demographics and a governance model conducive to technology adoption, Japan is positioned to remain a leader in integrating analytics into every layer of its football ecosystem.
Global Football Sports Analytics Market: Key Takeaways
- Global Market Size Insights: The Global Football Sports Analytics Market size is estimated to have a value of USD 1,359.1 million in 2025 and is expected to reach USD 4040.1 million by the end of 2034.
- The Global Market Growth Rate: The market is growing at a CAGR of 12.9 percent over the forecasted period of 2025.
- The US Market Size Insights: The US Football Sports Analytics Market is projected to be valued at USD 508.6 million in 2025. It is expected to witness subsequent growth in the upcoming period as it holds USD 1,422.8 million in 2034 at a CAGR of 12.1%.
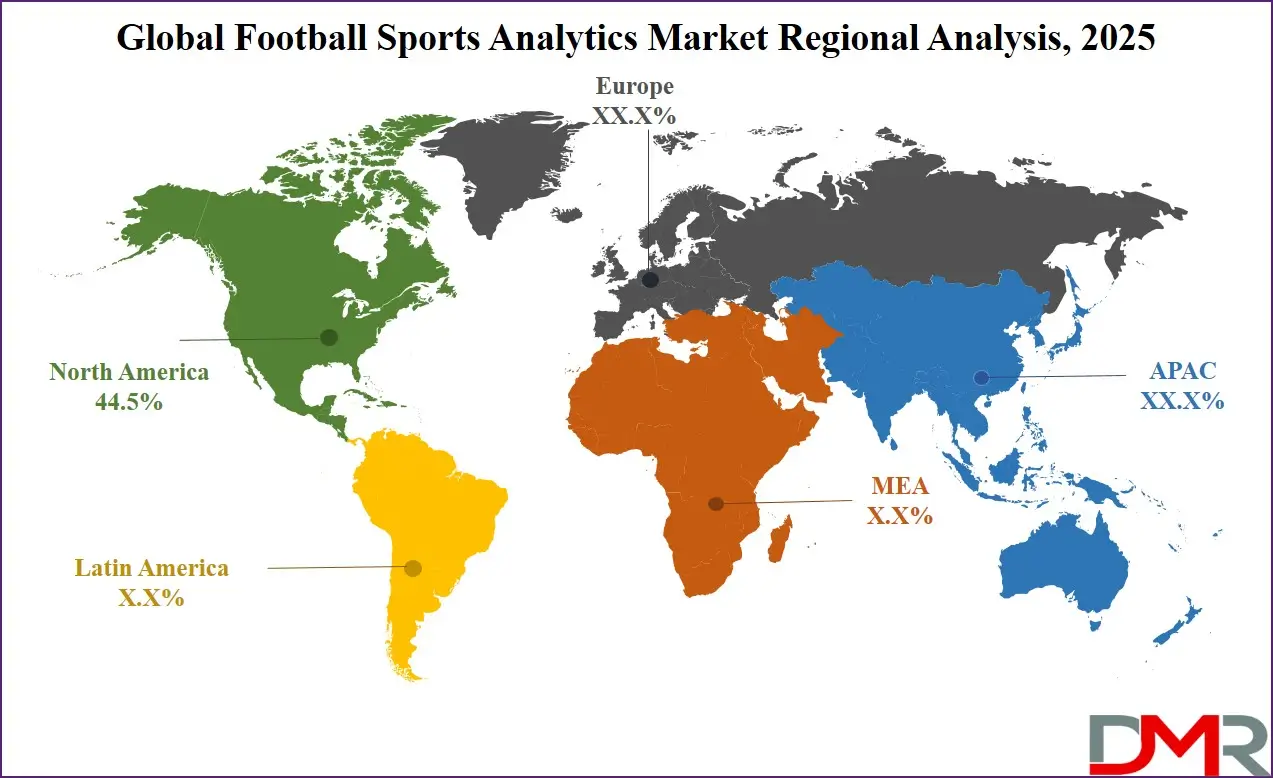
- Regional Insights: North America is expected to hold the largest market share in the Global Football Sports Analytics Market, with a share of approximately 44.5% in 2025.
- Key Players: Some of the major key players in the Global Football Sports Analytics Market are Hudl, Stats Perform, Catapult Sports, Sportradar AG, Genius Sports Group, Zebra Technologies Corporation, ChyronHego Corporation, and many others.
Global Football Sports Analytics Market: Use Cases
- Injury Prevention and Recovery: Real-time biometric monitoring detects fatigue, muscular strain, and overtraining indicators, enabling medical teams to adjust workloads, reduce injury risks, and accelerate rehabilitation through data-driven recovery programs.
- Tactical Match Analysis: AI tools process live match footage to identify formation gaps, pressing triggers, and opposition weaknesses, providing coaches with actionable strategies during play.
- Talent Scouting and Development: Integrated performance databases track youth and semi-professional players’ metrics, highlighting potential recruits overlooked by traditional scouting.
- Fan Engagement Enhancement: Interactive dashboards and personalized match statistics deepen supporter involvement, increasing loyalty and boosting digital engagement across multiple platforms.
- Commercial Optimization: Predictive sales models leverage attendance patterns, opponent appeal, and seasonal trends to optimize ticket pricing, merchandise promotion, and sponsorship placements for maximum revenue.
Global Football Sports Analytics Market: Stats & Facts
FIFA (Fédération Internationale de Football Association)
- FIFA has 211 member associations worldwide.
- The FIFA World Cup 2022 engaged ~5 billion people globally (reach/engagement across platforms).
- The Qatar 2022 final achieved a global live audience of ~1.5 billion.
- Semi-Automated Offside Technology (SAOT) at Qatar 2022 used 12 dedicated tracking cameras per stadium.
- SAOT tracked 29 data points per player at 50 frames per second.
- The match ball IMU sampled ball data at 500 Hz to assist offside decisions.
- VAR was first used at a FIFA senior tournament at the 2017 FIFA Confederations Cup.
- VAR was implemented across all matches of the 2018 FIFA World Cup.
- Electronic Performance & Tracking Systems (EPTS) were formally permitted under Law 4 and covered by the FIFA Quality Programme for wearables.
- FIFA TMS has reported continuous year-on-year growth in women’s international transfers, with new annual records in recent seasons.
IFAB (International Football Association Board)
- VAR was incorporated into the Laws of the Game in 2018 after trials under a formal VAR protocol.
- Goal-line technology (GLT) has been authorized in the Laws since 2012 after successful testing.
- EPTS (wearable/optical tracking) usage is authorized under Law 4 – The Players’ Equipment.
- Concussion substitution trials and temporary concussion assessment protocols have been sanctioned in specific competitions.
UEFA (Union of European Football Associations)
- UEFA comprises 55 national associations in Europe.
- VAR was introduced in the UEFA Champions League knockout phase in 2018/19 and expanded to the group stage in 2019/20.
- Women’s EURO 2022 used VAR in all matches.
- Semi-Automated Offside was introduced in UEFA club competitions in 2022/23.
- UEFA’s club licensing and Financial Fair Play framework requires centralized data reporting on clubs’ sporting and financial KPIs annually.
The FA (Football Association – England)
- VAR was introduced in the FA Cup beginning 2018/19 (used at Premier League venues in early phases).
- The FA operates centralized GPS and performance data guidance for national teams through St. George’s Park high-performance staff.
Premier League (England)
- The Premier League adopted Goal-Line Technology in 2013/14 (Hawk-Eye) across all stadiums.
- VAR has been used in the Premier League since 2019/20.
- A Premier League broadcast typically deploys 20+ match cameras with multiple high-frame-rate angles used operationally for officiating review.
- Centralized “offside lines” calibration is conducted on every televised match for consistency in VAR offside checks.
DFL (Deutsche Fußball Liga – Bundesliga)
- The Bundesliga introduced VAR in 2017/18.
- The league operates centralized match-data feeds (official event and tracking data) distributed to clubs and media partners in real time.
- Historical DFL communications detail league-wide optical tracking deployment across all Bundesliga venues.
Serie A (Lega Serie A – Italy)
- VAR was introduced in Serie A in 2017/18.
- Serie A has run centralized officiating technology hubs to coordinate VAR operations across fixtures.
LaLiga (Spain)
- VAR has been in operation in LaLiga since 2018/19.
- LaLiga’s tech programs have rolled out league-wide optical tracking and central cloud data distribution for clubs and broadcasters.
MLS (Major League Soccer – USA/Canada)
- VAR was implemented in MLS during the 2017 season.
- MLS operates centralized data partnerships to deliver live event data and tracking to clubs, media, and fan platforms.
CONMEBOL (South America)
- CONMEBOL consists of 10 member associations.
- VAR was introduced in the CONMEBOL Libertadores from 2017 (knockout phase) and expanded to all matches in later seasons.
AFC (Asian Football Confederation)
- AFC has 47 member associations.
- VAR debuted at the AFC Asian Cup 2019 (from quarterfinals) and has since been expanded to earlier rounds in subsequent editions.
CAF (Confédération Africaine de Football)
- CAF includes 54 member associations.
- AFCON 2021 (played in 2022) featured VAR in all matches after initial staged rollouts in previous editions.
Global Football Sports Analytics Market: Market Dynamics
Driving Factors in the Global Football Sports Analytics Market
Rising Demand for Competitive Edge in Professional Football
In an industry where minute performance margins can determine championships, the demand for a competitive edge is driving widespread adoption of football analytics. Clubs, national teams, and player agencies recognize that analytics can uncover hidden patterns, identify undervalued talent, and improve match strategies with evidence-backed insights. From optimizing substitution timings to evaluating opponent weaknesses, analytics tools are becoming integral to tactical planning.
The financial stakes are enormous; success on the pitch directly influences revenue from broadcasting rights, sponsorship deals, and merchandise sales. For example, a data-informed scouting decision can secure a cost-effective player acquisition, improving on-field performance while maximizing transfer value appreciation. Additionally, player valuation models, powered by analytics, allow clubs to negotiate smarter contracts and avoid overpaying in transfers. The growing focus on high-return investments in talent acquisition and match performance is ensuring that football analytics is no longer an optional enhancement; it is now a critical operational necessity for sustained success in both sporting and financial terms.
Expansion of Broadcast and Digital Fan Engagement Platforms
Football is no longer confined to the stadium; it thrives in the digital ecosystem. Broadcasters and streaming platforms are integrating real-time analytics into match coverage, providing fans with richer, more interactive viewing experiences. On-screen graphics showcasing player heat maps, pass accuracy, and expected goals (xG) are making analytics a mainstream part of fan engagement. This trend boosts demand for analytics solutions capable of delivering accurate, high-speed data. Furthermore, social media engagement strategies are increasingly data-driven, with clubs analyzing fan sentiment and interaction patterns to tailor digital content.
Data also plays a role in monetizing fan engagement through targeted advertising and personalized experiences, driving new revenue streams. Enhanced digital integration benefits clubs, leagues, and sponsors alike, making analytics an essential tool for modern football’s commercial ecosystem. The interplay between analytics, broadcasting, and fan engagement is creating a cycle where better data generates more immersive experiences, which in turn fuels fan loyalty and revenue growth.
Restraints in the Global Football Sports Analytics Market
High Implementation and Maintenance Costs for Advanced Analytics Systems
Deploying advanced football analytics infrastructure requires significant capital investment, particularly for smaller clubs and organizations. Costs encompass not only the acquisition of hardware such as wearable sensors, high-speed cameras, and tracking systems but also the licensing of specialized software platforms and ongoing technical support. Additionally, data storage, integration, and cybersecurity requirements add to the expense, as analytics systems handle sensitive performance and biometric data. For many lower-tier clubs, youth academies, or federations in developing markets, these costs can be prohibitive, limiting widespread adoption.
Furthermore, the benefits of analytics may take multiple seasons to fully materialize, making it challenging to justify the upfront investment to stakeholders focused on short-term returns. Without cost-effective, scalable solutions, the gap between well-funded elite clubs and financially constrained teams may widen, creating disparities in competitive fairness. This high-cost barrier remains a critical challenge for industry players seeking to democratize football analytics adoption across all levels of the sport.
Resistance to Cultural and Organizational Change in Football Management
While the benefits of football analytics are increasingly evident, cultural resistance remains a notable barrier. Many traditional managers, coaches, and even players may perceive analytics as undermining their experiential judgment or intuition. This skepticism is particularly strong in regions or leagues with a long-standing reliance on conventional scouting and coaching methods. Implementing analytics requires not only technological integration but also organizational mindset shifts, which can be slow to develop.
Additionally, interpreting complex datasets requires specialized expertise, and without proper training, stakeholders may misinterpret insights, leading to mistrust in the system. In some cases, decision-makers may selectively use analytics only when they align with pre-existing beliefs, reducing the objectivity of their application. Overcoming this resistance involves comprehensive education, change management strategies, and clear demonstration of analytics’ tangible benefits in match outcomes and player development, but until these efforts are widespread, adoption may remain inconsistent across the football industry.
Opportunities in the Global Football Sports Analytics Market
Expansion into Women’s Football and Emerging Leagues
The rapid growth of women’s football presents a significant untapped market for sports analytics solutions. With increasing investments, broadcasting deals, and global tournaments such as the FIFA Women’s World Cup gaining massive audiences, women’s football is becoming a commercial force. Analytics adoption in this segment remains comparatively low, offering solution providers a clear entry point. By applying the same data-driven methodologies used in men’s football, such as injury prevention models, tactical analysis, and performance tracking, clubs and federations in women’s football can gain competitive advantages.
Additionally, emerging football leagues in Africa, Southeast Asia, and the Middle East are investing heavily in infrastructure and talent development. These leagues are keen to leapfrog traditional development stages by directly integrating advanced analytics into their training, scouting, and broadcast operations. For analytics providers, this dual growth in women’s football and new leagues represents a vast opportunity to expand global market penetration while shaping the competitive landscape from the ground up.
Integration of Augmented Reality (AR) and Virtual Reality (VR) for Training and Fan Engagement
The adoption of AR and VR technologies in football offers a new frontier for analytics-driven applications. In training, VR systems can simulate match scenarios using real performance data, enabling players to rehearse decision-making without physical strain. AR can be used on the training pitch to overlay tactical instructions or real-time performance metrics onto the player’s field of view. These immersive tools combine analytics with experiential learning, accelerating skill acquisition and tactical awareness.
From a fan perspective, AR-powered stadium apps can provide live player statistics, positional data, and interactive match replays during live games, enhancing spectator engagement. Clubs and leagues that invest in AR/VR-enabled analytics will differentiate themselves in terms of both performance optimization and fan loyalty. As hardware costs decrease and adoption rises, this convergence of immersive tech and analytics is poised to open new monetization pathways while enhancing the overall football experience at both elite and grassroots levels.
Trends in the Global Football Sports Analytics Market
Integration of Artificial Intelligence (AI) and Machine Learning (ML) in Football Analytics
The increasing integration of AI and ML into football sports analytics is transforming how data is processed, interpreted, and applied in decision-making. AI algorithms can analyze massive datasets from player tracking systems, video feeds, biometric sensors, and historical match statistics in real time, producing actionable insights on performance, injury risk, and tactical adjustments. This shift is moving analytics from purely descriptive insights to predictive and prescriptive capabilities, enabling coaches and analysts to foresee player fatigue, adapt formations mid-match, and predict opponents’ strategies.
Additionally, AI-powered video analysis tools are speeding up post-match reviews, allowing instant tagging and categorization of events. Clubs in the English Premier League, La Liga, and MLS increasingly use AI-assisted tools to enhance scouting precision, evaluate potential signings, and even assess fan sentiment through social media analytics. The result is a more data-driven ecosystem where subjective decision-making is supported by objective, quantifiable evidence, ultimately leading to higher performance consistency and reduced injury downtime.
Growing Use of Wearable Technology and IoT in Player Performance Monitoring
Wearable devices embedded with GPS, accelerometers, gyroscopes, and heart rate monitors are revolutionizing player monitoring in football. These devices, connected through IoT systems, track critical metrics such as distance covered, sprint speed, heart rate variability, and workload intensity during training and matches. Coaches and sports scientists analyze this data to customize training loads, reduce overtraining risk, and optimize recovery protocols. Leading football clubs are also integrating wearable data into broader analytics platforms, correlating it with match outcomes, tactical formations, and environmental factors such as weather conditions or playing surface type.
The data’s granularity allows teams to pinpoint fatigue patterns, identify biomechanical inefficiencies, and implement individualized conditioning programs. Moreover, wearable technology adoption has extended beyond elite clubs into youth academies and grassroots football, enhancing talent development pipelines. This growing IoT-enabled data ecosystem provides real-time feedback loops, significantly improving decision-making during matches and enabling continuous player performance optimization while reducing the long-term risk of chronic injuries.
Global Football Sports Analytics Market: Research Scope and Analysis
By Component Analysis
Solutions is projected to dominate the Football Sports Analytics Market because football organizations increasingly rely on sophisticated analytics software to gain actionable insights into player performance, tactical strategies, and opponent behavior. Modern platforms integrate artificial intelligence (AI), machine learning (ML), and computer vision to deliver real-time analytics, video breakdowns, and predictive modeling. Clubs like Manchester City and Liverpool have set benchmarks in adopting AI-powered tools such as STATSports and Hudl, enabling them to measure key performance indicators (KPIs) like sprint speed, passing accuracy, heat maps, and stamina tracking.
These analytics help in identifying tactical inefficiencies, optimizing formations, and adjusting strategies mid-match. Beyond player performance, solutions also contribute to fan engagement through interactive match insights, data-driven storytelling, and virtual viewing enhancements. The ability to integrate multiple data sources, from GPS trackers to video feeds, into a unified interface makes solutions indispensable for decision-makers. In an era where marginal gains can determine championship outcomes, football clubs see advanced analytics platforms not as optional but as essential competitive tools. The growing commercialization of football, combined with pressure for continuous performance optimization, ensures the dominance of solutions over service-led models.
By Deployment Mode Analysis
Cloud-based deployment is anticipated to lead the football sports analytics sector due to its scalability, real-time accessibility, and cost efficiency. Unlike on-premises solutions that require heavy infrastructure, cloud platforms offer seamless data processing and sharing across devices and locations. This capability is especially vital for large-scale events such as the FIFA World Cup and UEFA Champions League, where analysts, coaching staff, and medical teams operate from multiple locations. Cloud solutions enable real-time streaming of match data, allowing instant tactical adjustments, remote collaboration, and live injury assessments.
The subscription-based model also makes high-end analytics accessible to mid-tier clubs and national teams without significant upfront costs. Advanced security protocols, AI-powered cloud computing, and integration with IoT devices (such as GPS trackers and wearable sensors) further enhance the model’s appeal. Cloud technology also supports AI-driven predictive analytics and historical data archiving, enabling longitudinal player performance studies. In the post-pandemic era, where remote operations and virtual collaborations have become the norm, cloud-based analytics offer unmatched flexibility. With football clubs looking to expand their global operations and engage fans through digital platforms, the cloud model remains the backbone of scalable, efficient, and accessible analytics.
By Type of Data Analysis
On-field data is poised to dominate the football sports analytics market as it provides real-time, high-precision insights critical for both tactical decision-making and player management. This category encompasses GPS tracking, optical tracking systems, and wearable sensors that measure speed, distance covered, acceleration, heart rate, and positional heat maps. Technologies from providers like Catapult, STATSports, and ChyronHego allow coaching staff to monitor performance live during matches and training sessions, enabling immediate adjustments to strategy or substitutions to prevent fatigue-related injuries.
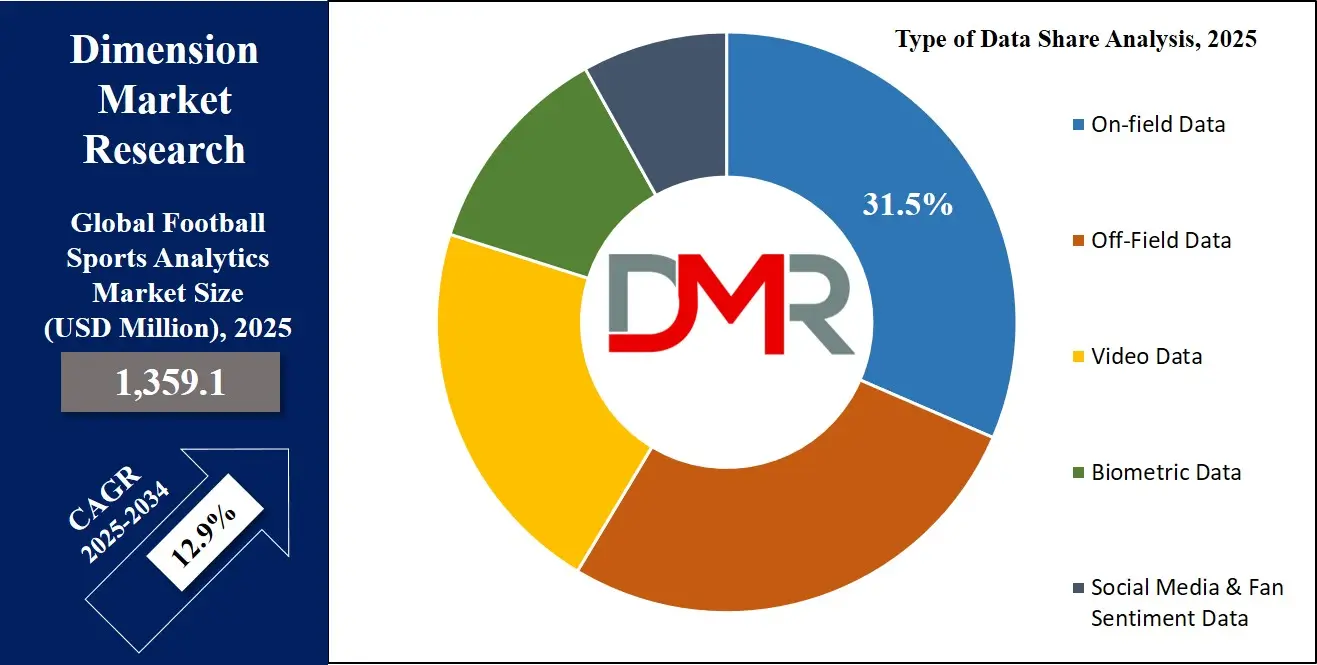
On-field data supports in-depth post-match analysis, helping to evaluate the effectiveness of formations, individual player contributions, and opponent weaknesses. The immediacy and accuracy of this data make it invaluable for optimizing pressing intensity, managing workloads, and tailoring recovery protocols. In modern football, where game intensity is higher and fixture congestion more demanding, the ability to track real-time physical output is a competitive necessity. Additionally, broadcasters and fan engagement platforms use on-field data to create interactive match visuals, enhancing viewer experience. As AI-powered analytics refine the granularity and predictive power of on-field metrics, this data type will continue to be the cornerstone of both professional performance analysis and sports science innovation.
By Application Analysis
Performance analysis is anticipated to be the leading application within football sports analytics, as clubs aim to continuously improve tactical execution, player conditioning, and match readiness. Using AI-driven platforms like Second Spectrum, Wyscout, and Catapult, analysts break down match footage frame-by-frame to assess passing networks, defensive shape, attacking patterns, and transition phases. Data visualizations, such as passing heat maps and expected goals (xG) models, enable coaches to identify inefficiencies and craft tailored training programs. Performance analysis is not limited to match days; it extends into training sessions, where wearables and tracking systems measure workload, injury risk, and recovery efficiency.
In high-stakes competitions, where margins of victory can be minimal, performance analysis offers actionable insights that can turn draws into wins. Beyond player development, it influences scouting decisions, opposition research, and tactical planning against specific teams. Clubs also leverage performance analysis to demonstrate player value in contract negotiations and transfer market dealings. The integration of AI, VR simulations, and machine learning ensures that performance analysis continues to evolve, delivering increasingly predictive and granular insights. In modern football, where physical intensity and tactical complexity are higher than ever, performance analysis remains the foundation for maintaining competitive advantage.
By End User Analysis
Football clubs & teams are expected to dominate the end-user segment of the global football sports analytics market due to their direct responsibility for player performance optimization, tactical strategy development, and injury prevention. Clubs such as Manchester City, FC Barcelona, and Bayern Munich are heavily investing in advanced analytics platforms to gain a competitive edge in domestic leagues and international tournaments. These teams utilize on-field data, video analytics, and biometric tracking to monitor player movements, workload, and recovery patterns, enabling personalized training programs.
A major factor behind this dominance is the increasing adoption of wearable devices and AI-powered analytics tools by clubs to extract real-time performance insights during training and matches. The ability to integrate data from multiple sources GPS trackers, video analysis software, and biometric sensors, allows clubs to make precise tactical adjustments. Clubs also employ analytics for opponent scouting and match prediction, giving them a strategic advantage before each game.
Additionally, financial stakes in professional football are extremely high, with clubs competing for prize money, sponsorship deals, and global fan engagement. Analytics-driven decisions in recruitment and player valuation help clubs invest wisely in talent acquisition, reducing the risks of costly transfers. Furthermore, injury prevention analytics significantly lowers medical expenses and ensures player availability for critical fixtures.
The Global Football Sports Analytics Market Report is segmented on the basis of the following:
By Component
- Solution
- Video Analysis
- Player Tracking & Performance Analysis
- Match & Event Analysis
- Opponent Scouting
- Team Performance Analysis
- Injury Prediction & Prevention
- Tactical & Strategic Planning Tools
- Services
- Consulting
- Implementation & Integration
- Support & Maintenance
- Data Management & Visualization
By Deployment Mode
By Type of Data
- GPS Tracking
- Ball Movement
- Heatmaps
- Pass Completion Rates
- Training Performance
- Nutrition
- Recovery Stats
- Video Data
- Biometric Data
- Heart Rate
- Fatigue Levels
- Injury Risks
- Social Media & Fan Sentiment Data
By Application
- Performance Analysis
- Player & Team Valuation
- Fan Engagement
- Match Predictions & Forecasting
- Video Analysis & Highlight Generation
- Injury Analysis & Prevention
- Tactical Analysis
- Referee Decision Support (VAR & AI-assisted tools)
By End User
- Football Clubs & Teams
- Sports Associations & Federations
- Leagues & Tournament Organizers
- Broadcasting & Media Companies
- Sports Betting Companies
- Athlete Management Agencies
Impact of Artificial Intelligence in the Global Football Sports Analytics Market
- Real-Time Player Tracking and Performance Optimization: AI enables real-time player tracking, analyzing movements, fatigue levels, and tactical positioning, helping coaches make data-driven substitutions, formation changes, and game strategies that optimize team performance and reduce injury risks during high-intensity matches.
- Predictive Opponent Analysis and Tactical Preparation: Advanced AI algorithms process vast historical match data to predict opponent tactics, identify weaknesses, and simulate scenarios, allowing football teams to prepare more efficiently and adapt game plans dynamically for improved win probabilities.
- Automated Video Analysis and Event Tagging: AI-powered video analysis automates event tagging, identifying passes, shots, and defensive actions instantly, drastically reducing manual analysis time and enabling analysts to focus on deeper performance insights and tactical optimization.
- Injury Prediction and Prevention: Machine learning in football analytics supports injury prediction by monitoring biometrics, movement patterns, and workload data, allowing medical teams to design personalized recovery programs and prevent costly player absences in competitive seasons.
- Enhanced Fan Engagement and Revenue Growth: AI-driven fan engagement platforms personalize match insights, interactive content, and real-time statistics for supporters, boosting audience interaction, brand loyalty, and commercial revenue for football clubs through targeted marketing and merchandise campaigns.
Global Football Sports Analytics Market: Regional Analysis
Region with the Largest Revenue Share
North America is projected to dominate the global football sports analytics market with 44.5% of the total market revenue by the end of 2025, due to its advanced sports infrastructure, high adoption of technology in professional leagues, and the presence of major analytics solution providers. The U.S. and Canada are home to top-tier sports franchises and leagues, such as the NFL, MLS, and NCAA football programs, which invest heavily in performance optimization, injury prevention, and tactical analysis.
These organizations have the financial capacity to integrate AI, big data, and IoT-based solutions into training and match analysis. Furthermore, strong collaboration between sports teams, universities, and tech companies accelerates innovation in analytics platforms. Supportive government initiatives for sports science research and the presence of leading companies like IBM, Catapult Sports, and Zebra Technologies strengthen the regional market position. The widespread use of real-time tracking devices, player monitoring wearables, and video analysis tools is driven by a data-driven culture in sports management.
Additionally, North America benefits from a large fan base demanding in-depth match statistics and interactive engagement platforms, pushing clubs to invest further in analytics. Media partnerships and sports broadcasters also leverage analytics for enriched content delivery, increasing adoption rates. Overall, North America’s dominance stems from a blend of advanced technological integration, strong financial resources, and a sports culture that prioritizes data for competitive advantage.
Region with the Highest CAGR
Asia Pacific is expected to register the highest CAGR in the football sports analytics market due to rapidly increasing investments in sports infrastructure, rising popularity of football, and growing adoption of advanced analytics solutions in emerging economies like China, India, and Japan. Governments and sports federations are actively promoting football through grassroots programs, professional league expansion, and technology adoption to boost player performance and fan engagement.
The rise of domestic leagues such as the Indian Super League (ISL) and the Chinese Super League (CSL) has created demand for player tracking, tactical analytics, and injury prevention tools to match global performance standards. Affordable wearable devices, AI-powered platforms, and cloud-based analytics solutions are making high-level sports data analysis accessible to more teams in the region. Increasing partnerships between European football clubs and Asian teams further drive technology transfer and knowledge sharing. Moreover, a growing middle-class population with higher disposable incomes is fueling fan engagement, stadium attendance, and digital sports content consumption.
Regional broadcasters are adopting advanced analytics for match presentation, attracting more sponsors and advertisers. The expansion of sports tech startups and local innovation hubs accelerates market penetration. With ongoing digital transformation in sports, the Asia Pacific’s growth trajectory is supported by a young, tech-savvy population and rising commercialization of football, making it a key hotspot for analytics adoption in the coming years.
By Region
North America
Europe
- Germany
- The U.K.
- France
- Italy
- Russia
- Spain
- Benelux
- Nordic
- Rest of Europe
Asia-Pacific
- China
- Japan
- South Korea
- India
- ANZ
- ASEAN
- Rest of Asia-Pacific
Latin America
- Brazil
- Mexico
- Argentina
- Colombia
- Rest of Latin America
Middle East & Africa
- Saudi Arabia
- UAE
- South Africa
- Israel
- Egypt
- Rest of MEA
Global Football Sports Analytics Market: Competitive Landscape
The global football sports analytics market is moderately fragmented, with the presence of established technology providers, niche sports analytics startups, and specialized solution developers. Key players compete by offering advanced AI, machine learning, and cloud-based analytics platforms that cater to performance analysis, tactical optimization, and fan engagement. Companies like Catapult Sports, Stats Perform, Hudl, and IBM lead through continuous innovation, partnerships with elite football clubs, and integration of wearable technologies for real-time player monitoring.
Zebra Technologies, known for its RFID tracking solutions, collaborates with major leagues to enhance in-game data capture. Emerging firms focus on offering cost-effective, customizable analytics solutions for smaller teams and leagues, particularly in developing markets. Strategic alliances between technology providers and football federations are common, enabling large-scale deployment of analytics tools at national and club levels. Mergers and acquisitions are also shaping the competitive dynamics, with larger firms acquiring niche startups to expand their capabilities and market reach. Moreover, partnerships with broadcasters and media companies allow analytics firms to extend their influence into fan engagement, offering interactive data visualizations and real-time statistics.
As competition intensifies, companies are investing in R&D, user-friendly interfaces, and AI-driven insights to differentiate their offerings. The competitive environment favors players who can combine technological sophistication with affordability and scalability, catering to both elite clubs and grassroots football organizations.
Some of the prominent players in the Global Football Sports Analytics Market are:
- Hudl
- Stats Perform
- Catapult Sports
- Sportradar AG
- Genius Sports Group
- Zebra Technologies Corporation
- ChyronHego Corporation
- SAP SE
- Oracle Corporation
- IBM Corporation
- Opta Sports
- Synergy Sports Technology
- InStat Sport
- Wyscout (Hudl subsidiary)
- Kitman Labs
- Kinexon GmbH
- Sportsradar US LLC
- SAS Institute Inc.
- TruMedia Networks
- Xampion
- Other Key Players
Recent Developments in the Global Football Sports Analytics Market
- July 2024: Stats Perform enhanced its Opta Vision AI platform, enabling real-time football analytics for broadcasters and betting operators, integrating advanced tracking, player movement insights, and tactical data to improve match coverage and fan engagement experiences worldwide.
- May 2024: Catapult Sports partnered with FC Barcelona, integrating AI-powered wearable tracking in training sessions, providing precise performance metrics, injury prevention insights, and workload management tools to optimize player output and tactical readiness ahead of competitive matches.
- March 2024: Hudl launched a video analysis suite with AI-driven tagging and computer vision, enabling football coaches to quickly assess tactics, identify weaknesses, and streamline match review processes, boosting preparation efficiency for clubs at all competition levels.
- January 2024: Sportradar introduced AI-based injury prediction tools for football clubs, combining biometric data, match statistics, and historical performance to forecast risks, reduce downtime, and improve player health management in high-intensity league and tournament schedules.
- November 2023: IBM collaborated with the English Premier League, delivering AI-powered fan engagement tools during live broadcasts, enhancing match insights, personalized content, and interactive features to increase viewer interaction across global football audiences.
- September 2023: Genius Sports renewed its partnership with FIFA, expanding the use of advanced data analytics, match statistics, and real-time tracking technology to improve competition analysis, integrity monitoring, and fan engagement during global football tournaments.
Report Details
| Report Characteristics |
| Market Size (2025) |
USD 1,359.1 Mn |
| Forecast Value (2034) |
USD 4040.1 Mn |
| CAGR (2025–2034) |
12.9% |
| Historical Data |
2019 – 2024 |
| The US Market Size (2025) |
USD 508.6 Mn |
| Forecast Data |
2026 – 2034 |
| Base Year |
2024 |
| Estimate Year |
2025 |
| Report Coverage |
Market Revenue Estimation, Market Dynamics, Competitive Landscape, Growth Factors, etc. |
| Segments Covered |
By Component (Solution, Services), By Deployment Mode (On-Premises, Cloud-Based), By Type of Data (On-field Data, Off-Field Data, Video Data, Biometric Data, Social Media & Fan Sentiment Data), By Application (Performance Analysis, Player & Team Valuation, Fan Engagement, Match Predictions & Forecasting, Video Analysis & Highlight Generation, Injury Analysis & Prevention, Tactical Analysis, Referee Decision Support (VAR & AI-assisted tools)), By End User (Football Clubs & Teams, Sports Associations & Federations, Leagues & Tournament Organizers, Broadcasting & Media Companies, Sports Betting Companies, Athlete Management Agencies) |
| Regional Coverage |
North America – US, Canada; Europe – Germany, UK, France, Russia, Spain, Italy, Benelux, Nordic, Rest of Europe; Asia-Pacific – China, Japan, South Korea, India, ANZ, ASEAN, Rest of APAC; Latin America – Brazil, Mexico, Argentina, Colombia, Rest of Latin America; Middle East & Africa – Saudi Arabia, UAE, South Africa, Turkey, Egypt, Israel, Rest of MEA |
| Prominent Players |
Hudl, Stats Perform, Catapult Sports, Sportradar AG, Genius Sports Group, Zebra Technologies Corporation, ChyronHego Corporation, SAP SE, Oracle Corporation, IBM Corporation, Opta Sports, Synergy Sports Technology, InStat Sport, Wyscout, Kitman Labs, Kinexon GmbH, Sportsradar US LLC, SAS Institute Inc., TruMedia Networks, Xampion., and Other Key Players |
| Purchase Options |
We have three licenses to opt for: Single User License (Limited to 1 user), Multi-User License (Up to 5 Users), and Corporate Use License (Unlimited User) along with free report customization equivalent to 0 analyst working days, 3 analysts working days, and 5 analysts working days respectively. |
Frequently Asked Questions
The Global Football Sports Analytics Market size is estimated to have a value of USD 1,359.1 million in 2025 and is expected to reach USD 4040.1 million by the end of 2034.
The market is growing at a CAGR of 12.9 percent over the forecasted period of 2025.
The US Football Sports Analytics Market is projected to be valued at USD 508.6 million in 2025. It is expected to witness subsequent growth in the upcoming period as it holds USD 1,422.8 million in 2034 at a CAGR of 12.1%.
North America is expected to hold the largest market share in the Global Football Sports Analytics Market, with a share of approximately 44.5% in 2025.
Some of the major key players in the Global Football Sports Analytics Market are Hudl, Stats Perform, Catapult Sports, Sportradar AG, Genius Sports Group, Zebra Technologies Corporation, ChyronHego Corporation, and many others.