Market Overview
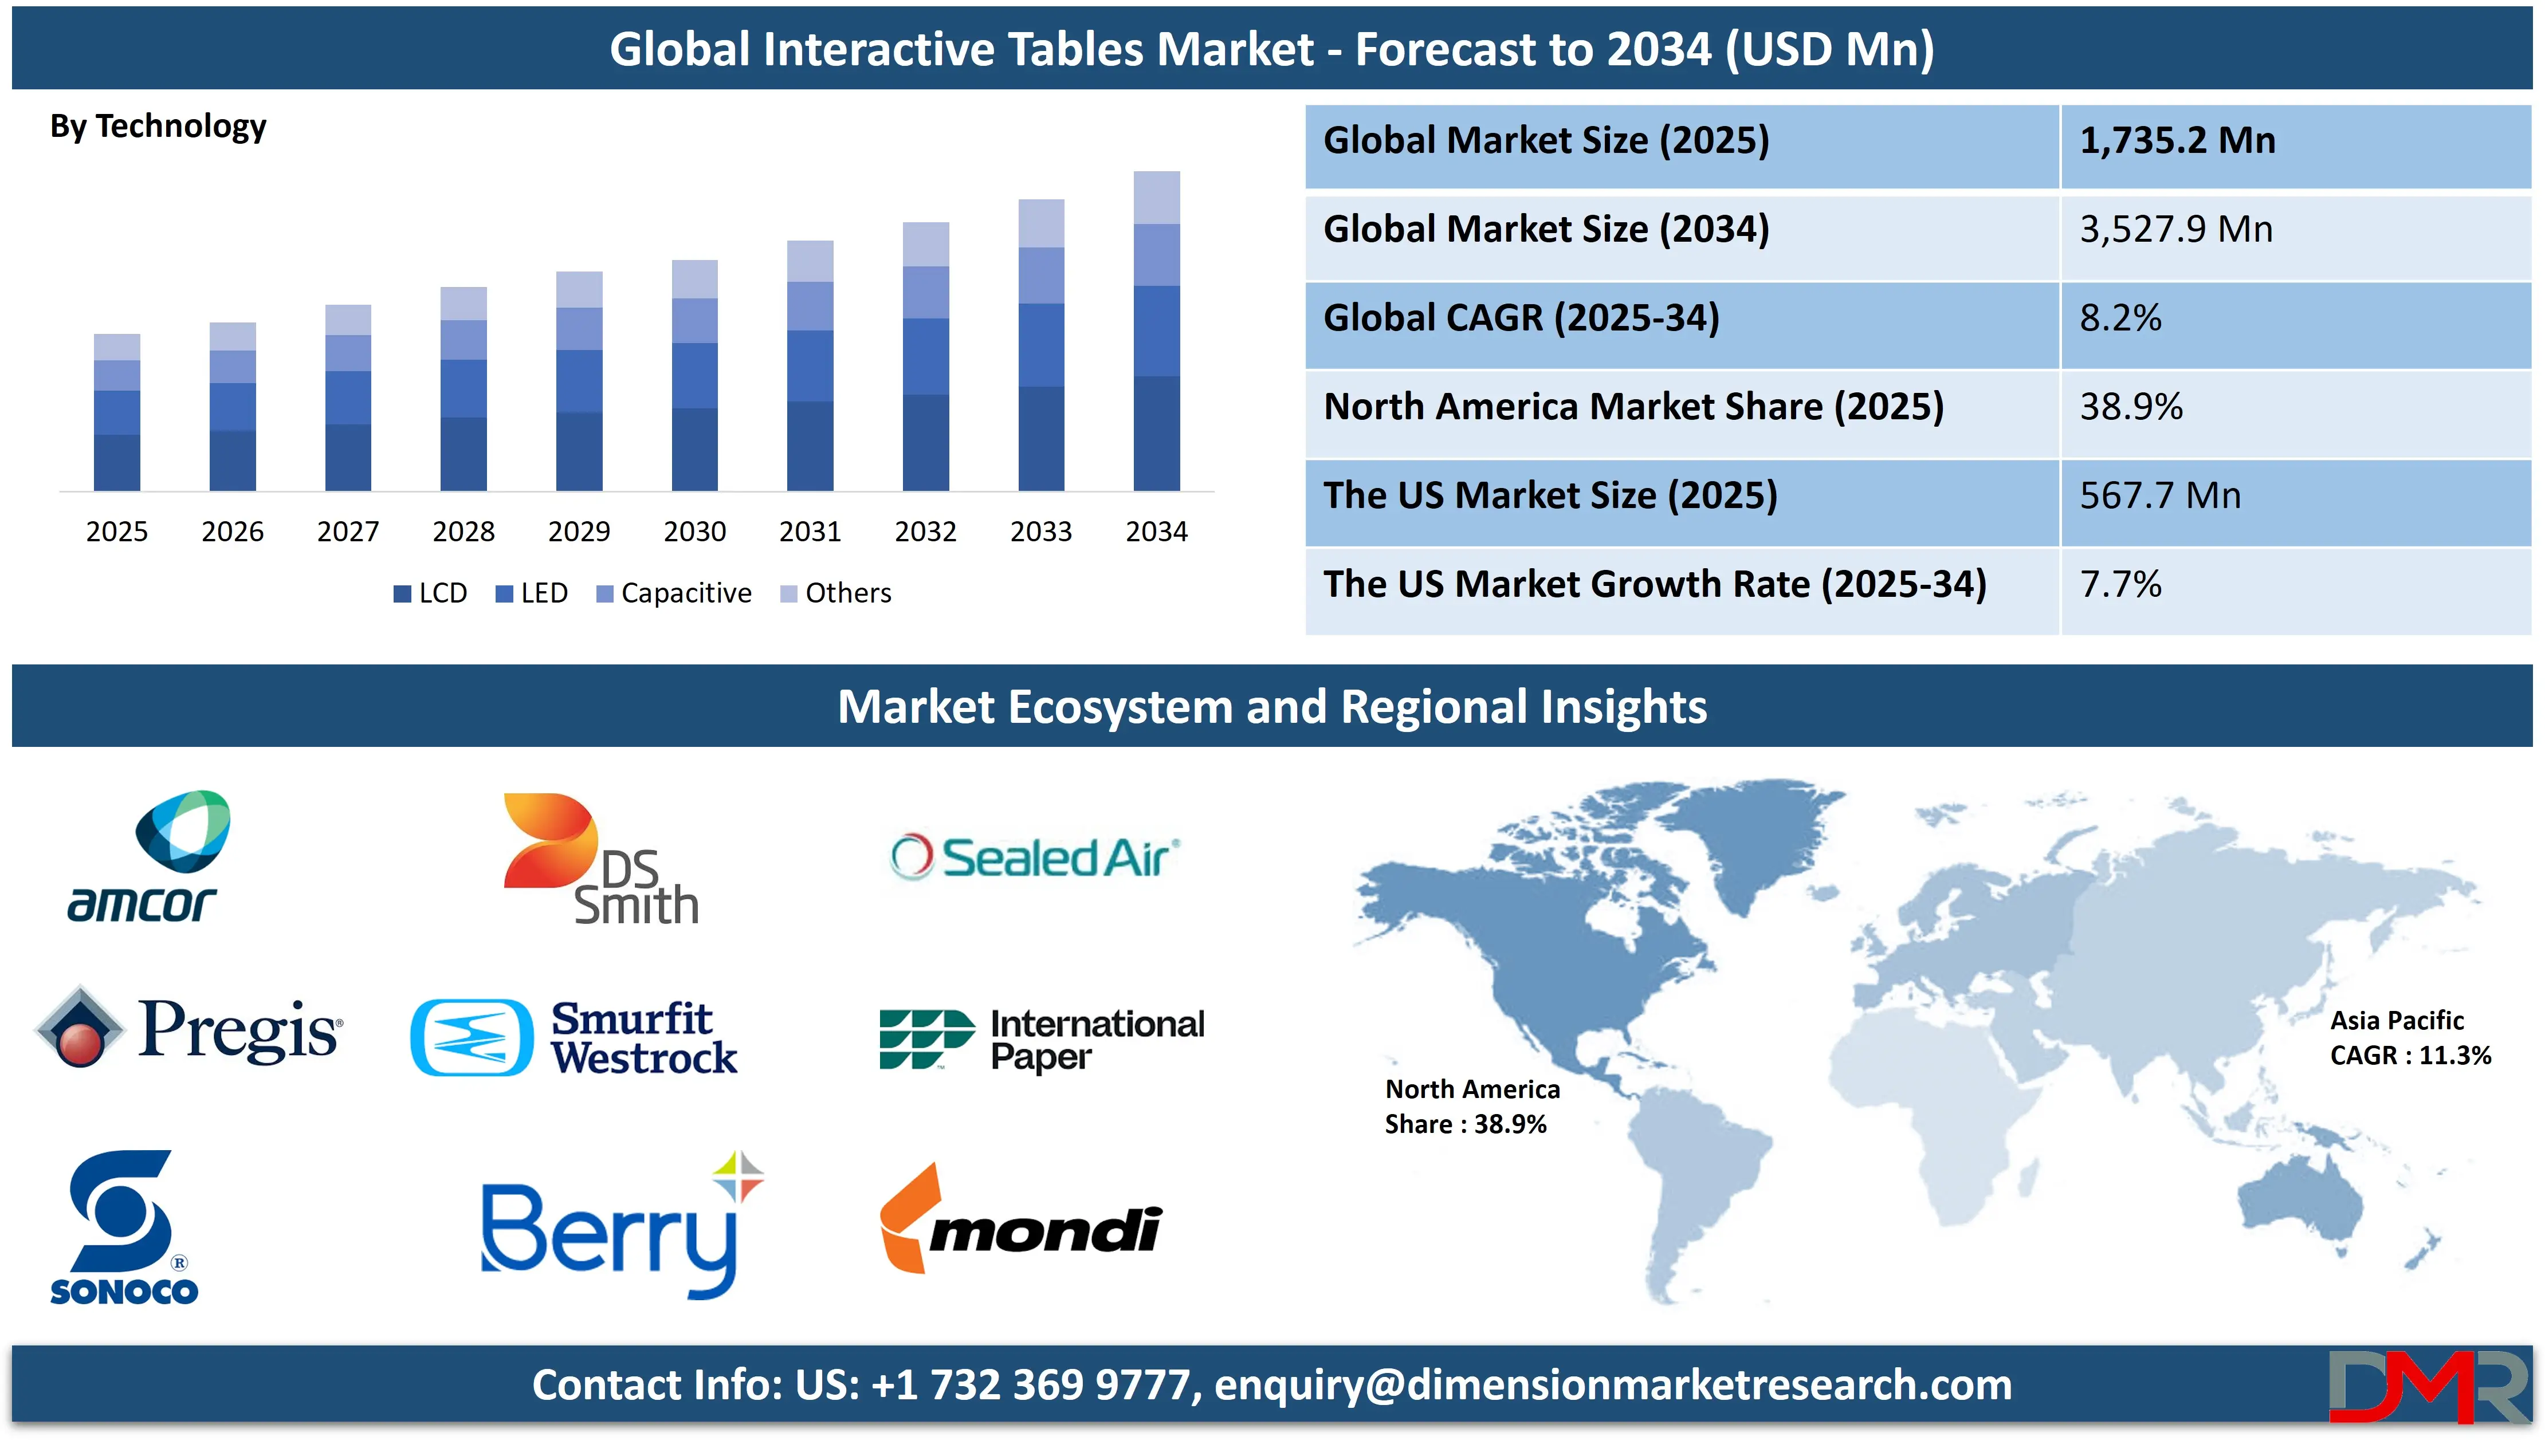
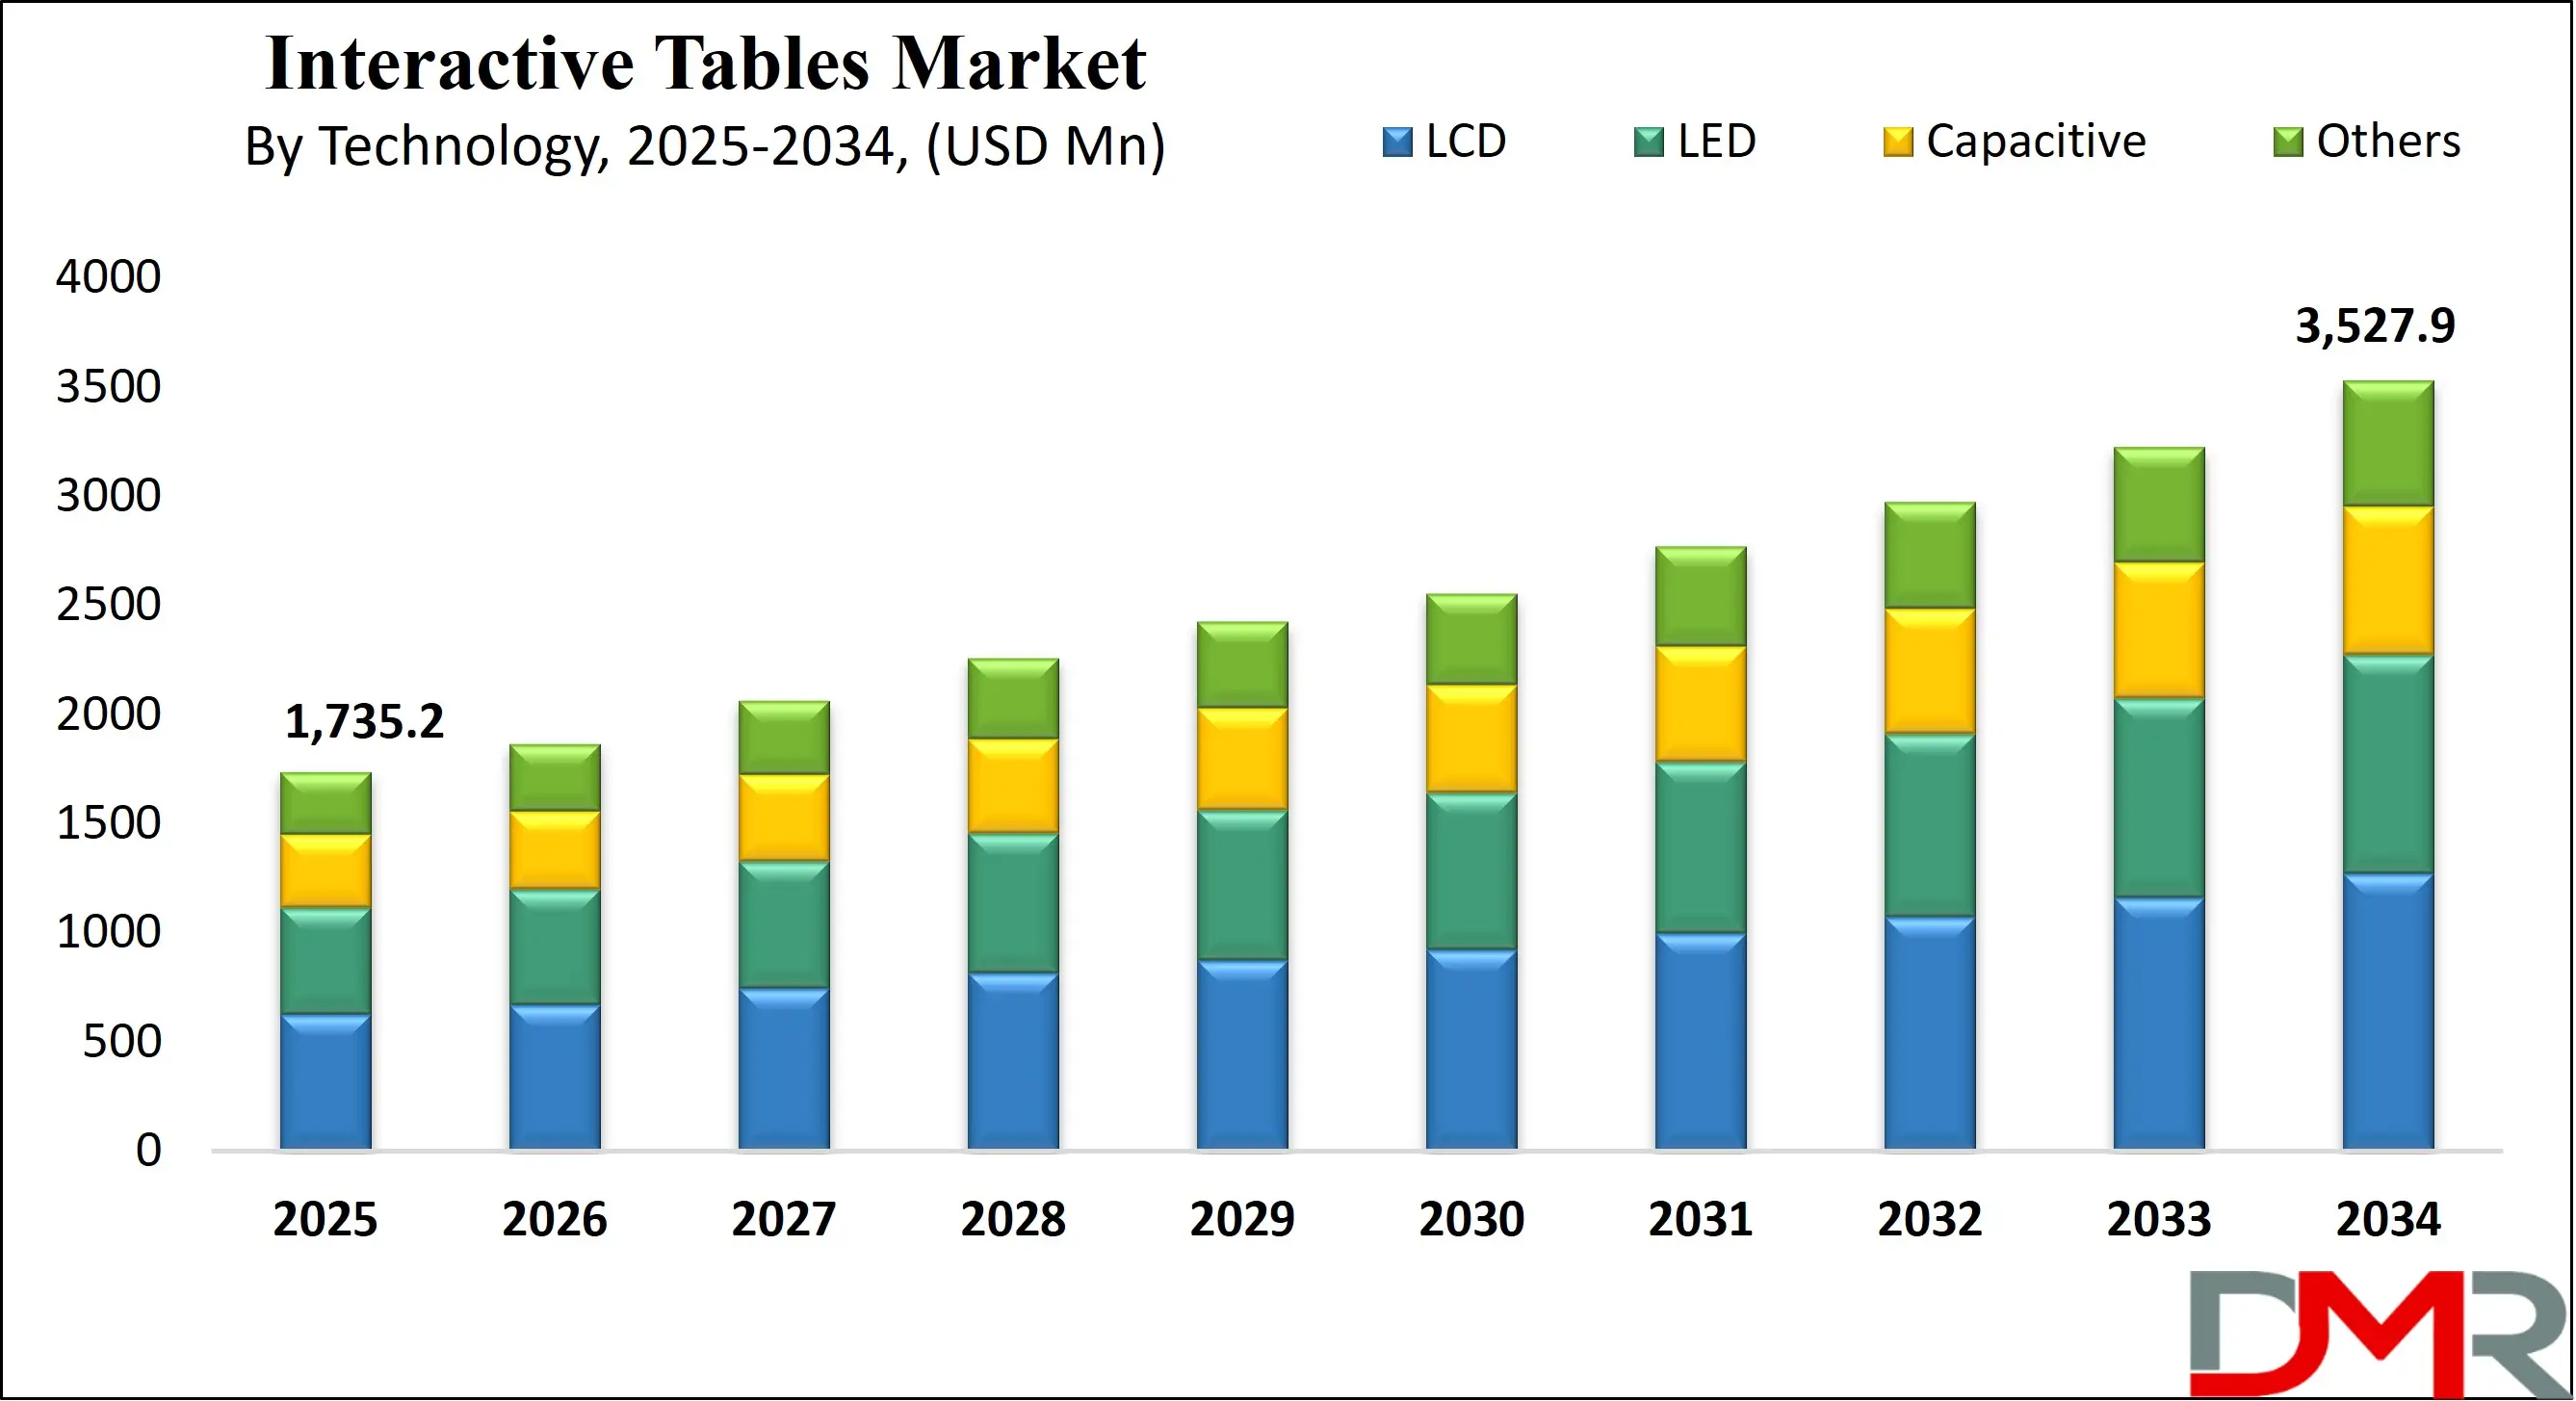
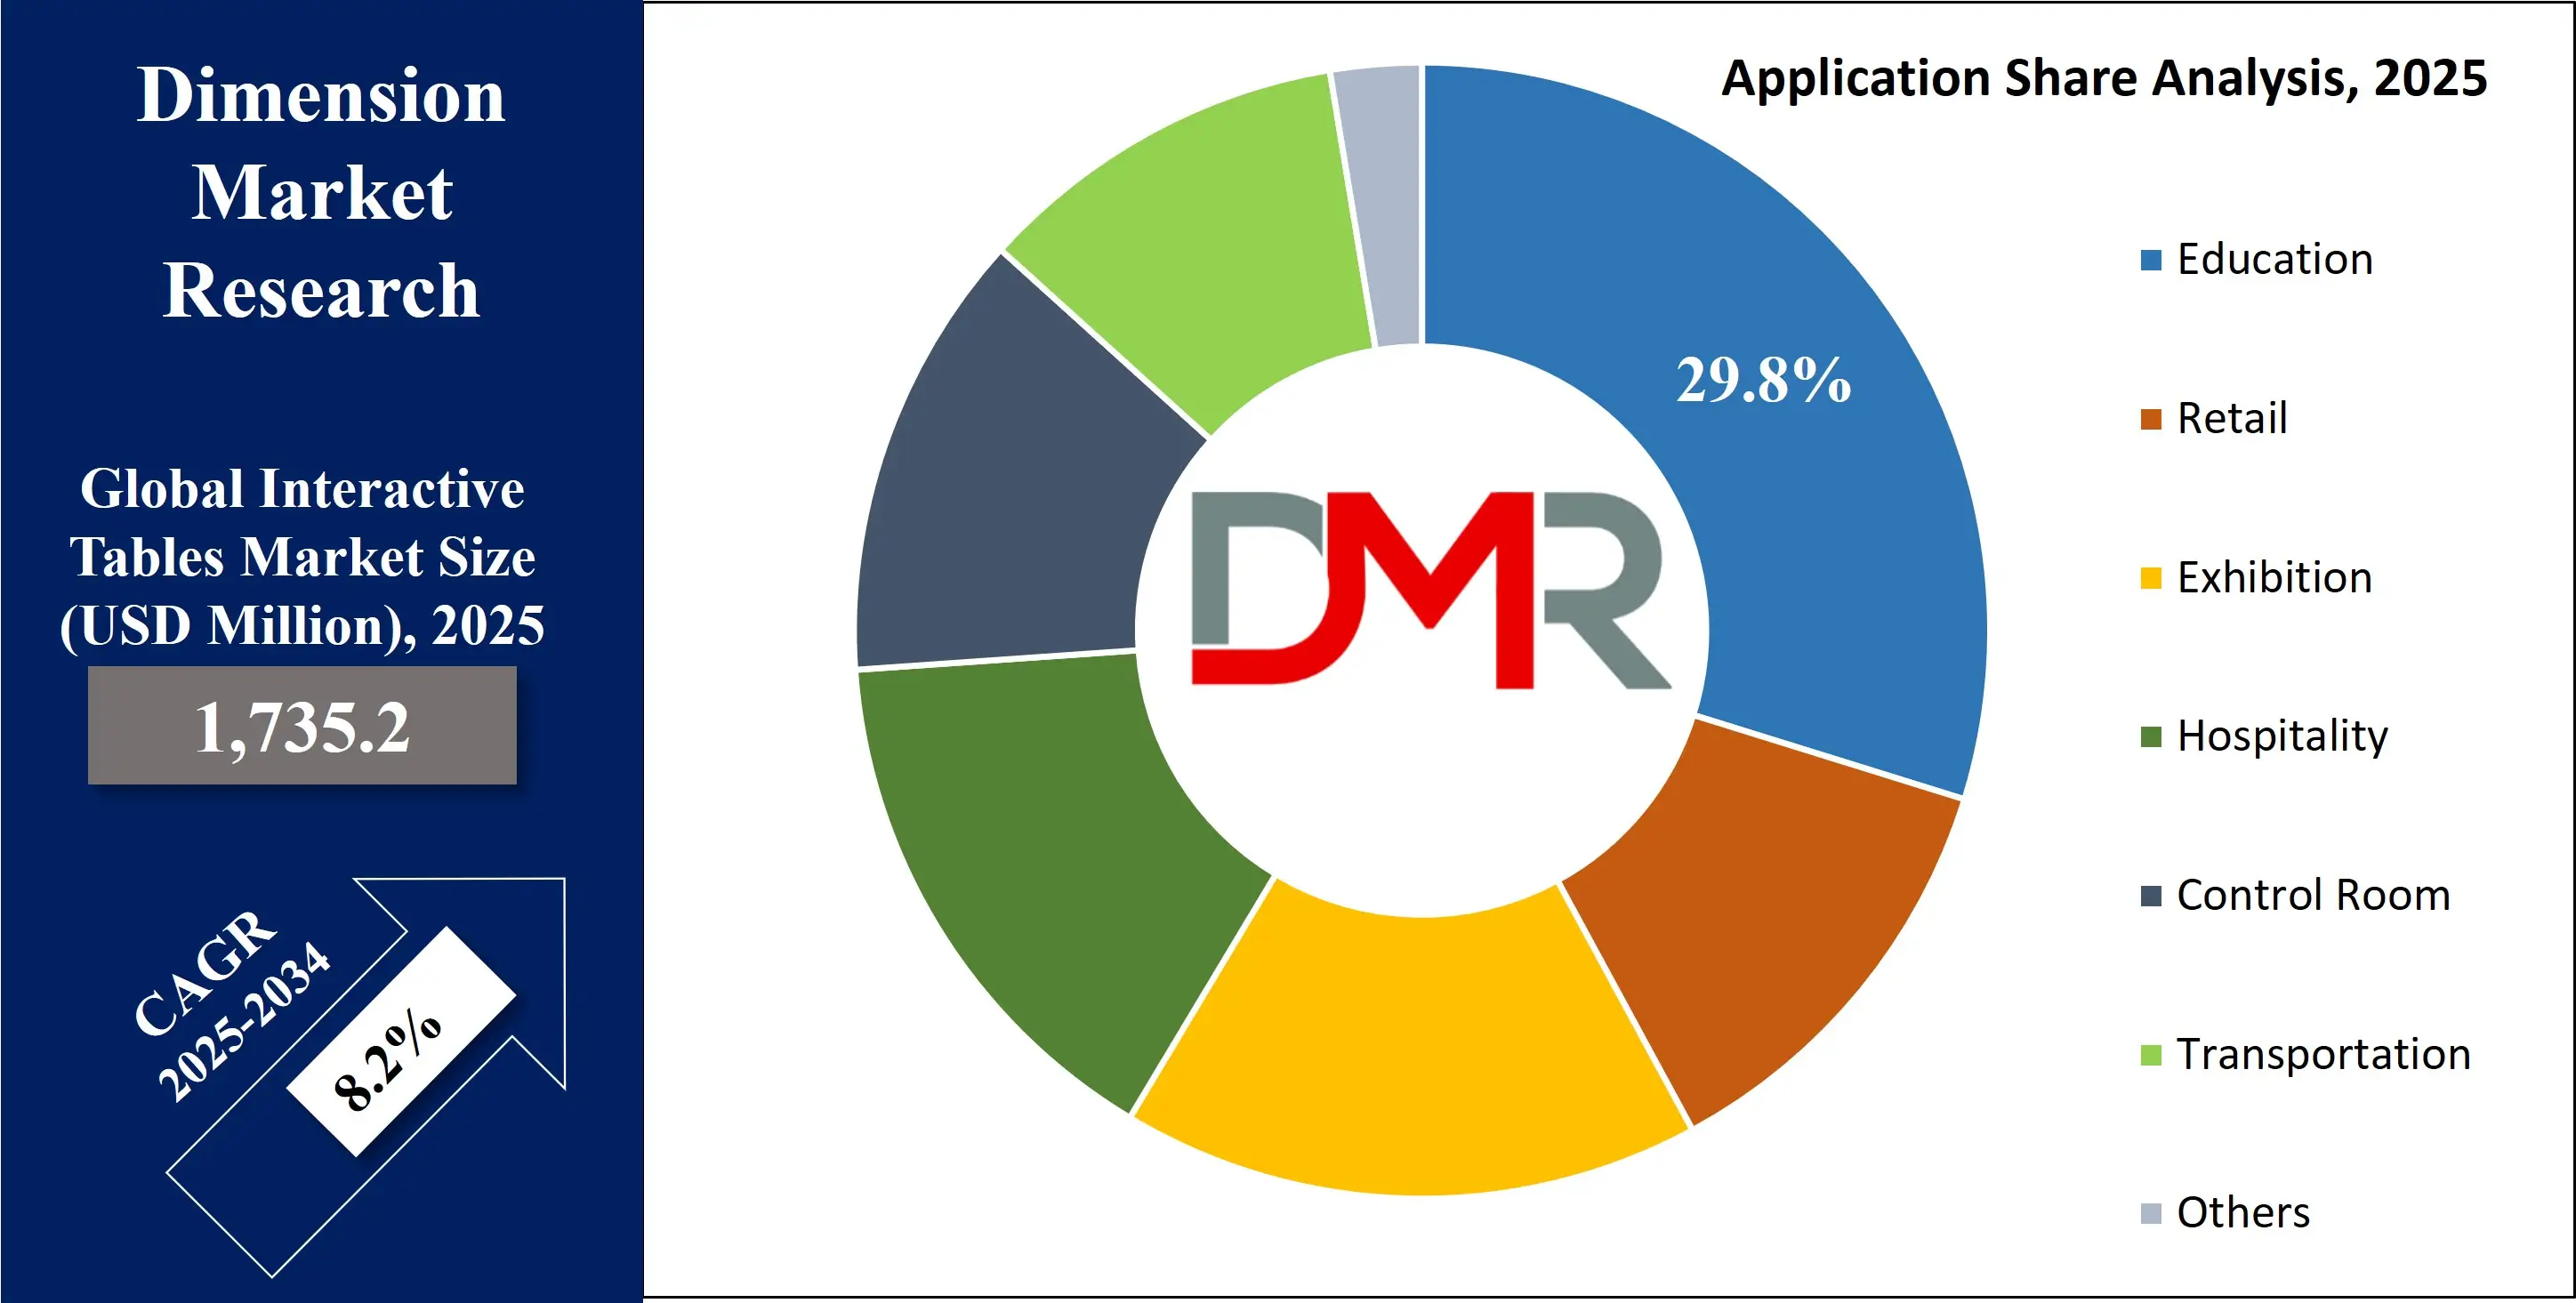
The Global Interactive Tables Market is predicted to be valued at USD 1,735.2 million in 2025 and is expected to grow to USD 3,527.9 million by 2034, registering a compound annual growth rate (CAGR) of 8.2% from 2025 to 2034.
Interactive tables are advanced digital surfaces or displays that allow users to engage with content through touch, gestures, or digital pens. Unlike traditional tables, these tables integrate touchscreen technology, often using capacitive or infrared sensors, enabling multi-user interaction. They are commonly used in educational settings, museums, retail, hospitality, and corporate environments to enhance collaboration, presentations, and customer engagement.
ℹ
To learn more about this report –
Download Your Free Sample Report Here
Interactive tables can display multimedia content, support real-time data manipulation, and connect to other devices or cloud services. Their ability to offer intuitive, engaging user experiences makes them valuable tools for dynamic, tech-driven environments focused on communication, learning, and productivity.
The global interactive tables market is experiencing significant growth, driven by the increasing adoption of digital solutions across various sectors such as education, retail, healthcare, hospitality, and corporate environments. Interactive tables are digital touchscreen surfaces that enable users to interact with content through multi-touch gestures, styluses, or even object recognition. They support collaborative activities, real-time information sharing, and immersive learning, making them valuable tools in both professional and consumer-focused settings.
In the education sector, interactive learning tables are revolutionizing classroom experiences by enhancing student engagement through interactive lessons and collaborative projects. The retail industry is also adopting these smart tables to provide dynamic product presentations and self-service options that improve customer interaction and shopping experiences. In hospitality, touch tables are used for ordering, entertainment, and wayfinding, creating a more personalized guest experience.
The corporate sector benefits from interactive conference tables that facilitate brainstorming, digital whiteboarding, and data visualization during meetings. The healthcare industry is leveraging these technologies in patient education and administrative operations to streamline workflows and improve patient care. Technological advancements such as capacitive touch technology, high-resolution displays, and integration with artificial intelligence are enhancing the functionality and appeal of interactive tables.
ℹ
To learn more about this report –
Download Your Free Sample Report Here
Growing demand for smart classroom infrastructure, rising digitization, and increasing investment in innovative customer engagement solutions are key factors propelling the market forward. Additionally, the integration of augmented reality and Internet of Things (IoT) capabilities into interactive surfaces is expected to open new opportunities. The market is becoming increasingly competitive, with manufacturers focusing on ergonomic design, intuitive interfaces, and robust connectivity features to differentiate their offerings.
The US Interactive Tables Market
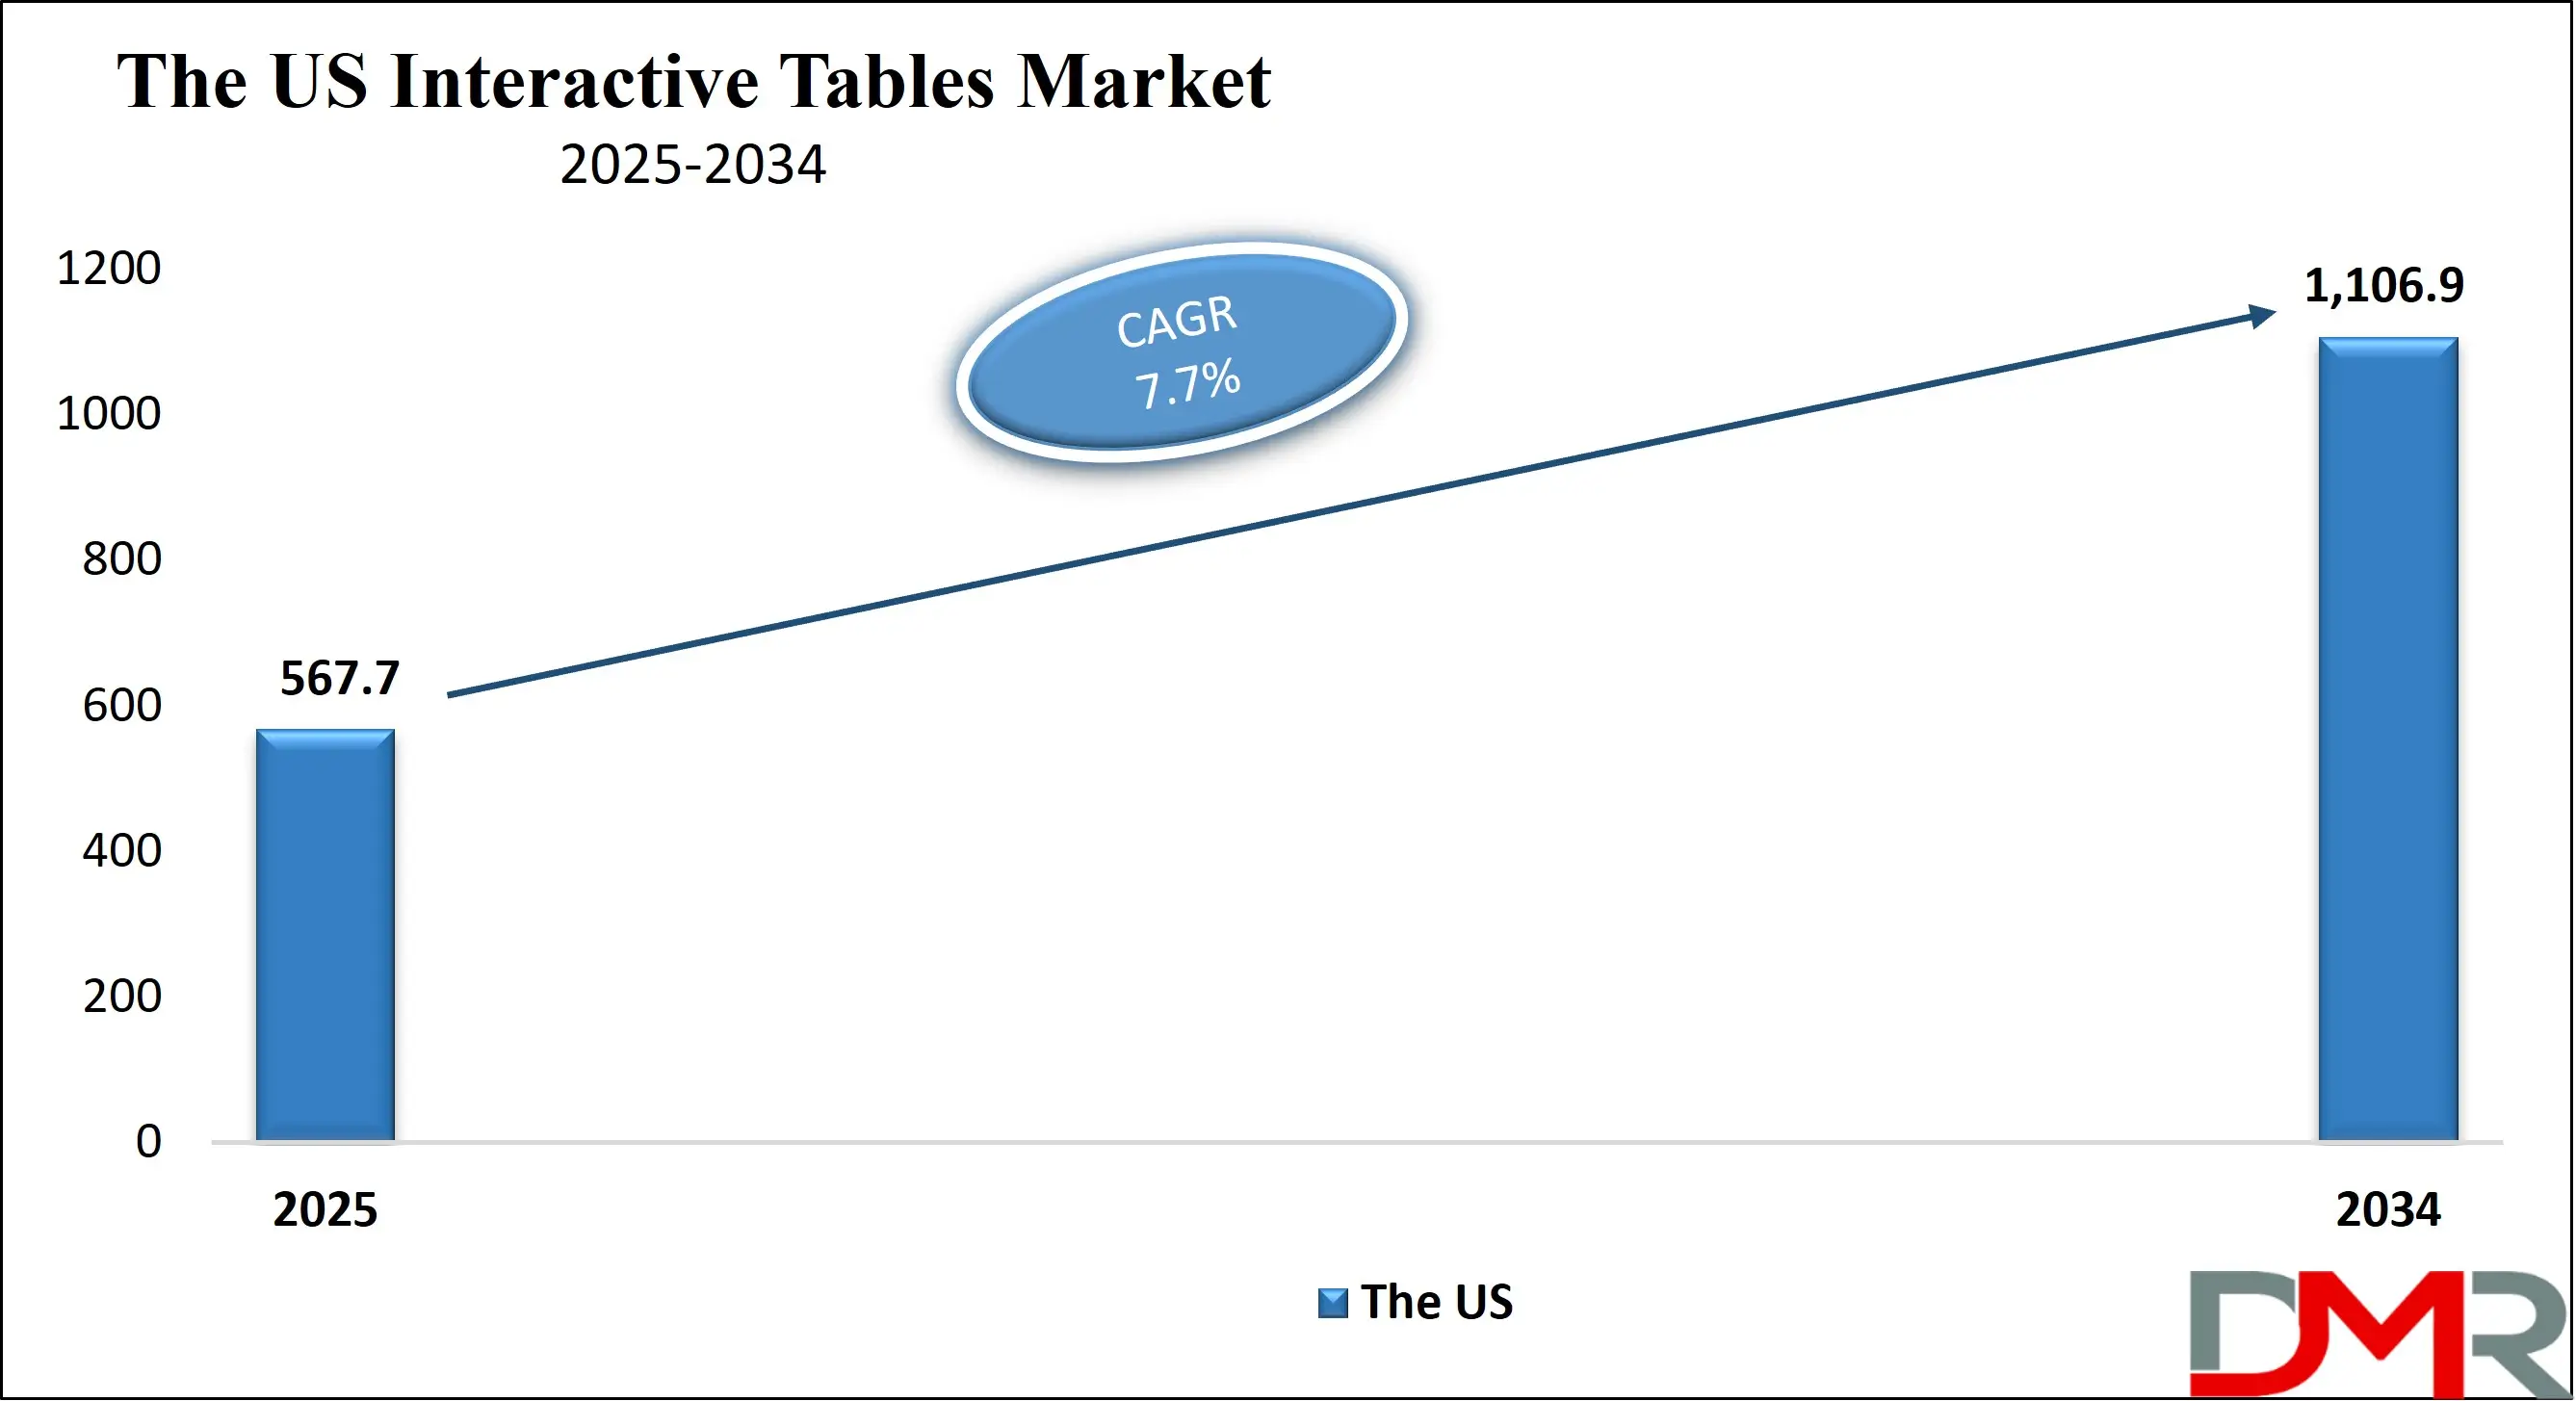
The US Interactive Tables Market is projected to be valued at USD 567.7 million in 2025. It is expected to witness subsequent growth in the upcoming period as it holds USD 1,106.9 million in 2034 at a CAGR of 7.7%.
The U.S. interactive tables market is driven by growing investments in digital classrooms, smart retail environments, and collaborative workspaces. Increasing adoption in education for interactive learning and corporate sectors for real-time collaboration tools has spurred demand. Government initiatives supporting digital infrastructure and increased use of touch-based kiosks in hospitality and healthcare further push adoption.
ℹ
To learn more about this report –
Download Your Free Sample Report Here
The rising preference for user-friendly, multi-touch displays that enhance engagement and productivity in public and private spaces also contributes significantly. Additionally, advancements in display technologies, such as capacitive touch and LED screens, are making interactive tables more efficient, durable, and cost-effective across multiple industry verticals.
A prominent trend in the U.S. interactive tables market is the integration of artificial intelligence and machine learning for enhanced user interaction. There's rising demand for multi-user functionality, especially in sectors like education and retail. Businesses are increasingly adopting these tables in showrooms and customer experience centers.
Gamification of educational content through touch-enabled platforms is also gaining momentum. The use of cloud-based collaboration tools embedded in interactive tables is transforming meeting environments. Moreover, designs are becoming more ergonomic and aesthetically appealing, aligning with modern interior needs. Sustainability and energy-efficient models are also becoming a focal point for manufacturers.
The Japan Interactive Tables Market
The Japan Interactive Tables Market is projected to be valued at USD 180.3 million in 2025. It is expected to witness subsequent growth in the upcoming period as it holds USD 347.5 million in 2034 at a CAGR of 7.3%.
Japan's interactive tables market is driven by the country’s technological sophistication and emphasis on high-tech education and retail experiences. The education sector is increasingly integrating digital tools to facilitate interactive, student-centric learning. Retail and hospitality sectors are adopting these tables for product showcases and customer self-service.
The country's strong electronics manufacturing ecosystem supports innovation in touchscreen technologies. Additionally, public institutions such as libraries and transport hubs are implementing interactive tables for navigation, information dissemination, and accessibility support. Cultural inclination towards automation and efficiency also accelerates adoption across various domains, from corporate environments to elderly care facilities and government services.
In Japan, a significant trend is the miniaturization and aesthetic refinement of interactive tables to suit compact and design-focused interiors. Integration with voice recognition, AR, and gesture control is gaining popularity, particularly in consumer-facing environments. Educational institutions are leveraging interactive tables to support inclusive and remote learning.
In retail, interactive tables are becoming central to immersive brand experiences. There's also a growing trend of customizing interfaces for elderly users, reflecting Japan’s aging population. Seamless integration with mobile devices and real-time translation capabilities are being explored to support multilingual user bases in urban and tourism-centric locations.
The Europe Interactive Tables Market
The Europe Interactive Tables Market is projected to be valued at USD 412.6 million in 2025. It is expected to witness subsequent growth in the upcoming period as it holds USD 347.5 million in 2034 at a CAGR of 7.6%.
In Europe, the growing focus on digital transformation across educational institutions, museums, and retail outlets is a key driver for the interactive tables market. Government-funded smart classroom initiatives and the modernization of public libraries and exhibition spaces are boosting adoption. Retailers are leveraging interactive tables to provide immersive product demonstrations and personalized experiences.
Furthermore, the tourism industry’s increasing adoption of interactive information points at airports, train stations, and hotels also supports market growth. Innovations in touch-sensitive surfaces and robust software platforms further enhance user experience, driving widespread integration across diverse applications in both public and private sectors.
A rising trend in the European interactive tables market is the emphasis on accessibility and multilingual interfaces to cater to diverse populations. Cultural institutions like museums and galleries are adopting these technologies for immersive storytelling and visitor engagement. In the corporate world, hybrid work models are fostering the use of collaborative tools, including interactive tables, for dynamic team interactions.
Green tech integration and compliance with sustainability standards are shaping product development. The growing popularity of educational games and STEM-based learning modules is also influencing adoption. Integration with smart building systems and IoT is expanding the role of these tables beyond standalone devices.
Interactive Tables Market: Key Takeaways
- Market Overview: The global interactive tables market is anticipated to reach a valuation of USD 1,735.2 million by 2025 and is projected to expand significantly, hitting USD 3,527.9 million by 2034. This growth reflects a strong compound annual growth rate (CAGR) of 8.2% over the forecast period from 2025 to 2034.
- By Technology: Among the various technologies, the LCD segment is expected to lead the market by the end of 2025, capturing approximately 38.6% of the total market share.
- By Screen Size: In terms of screen size, interactive tables with displays ranging from 32 to 65 inches are predicted to dominate, accounting for 64.1% of the market share by 2025.
- By Application: The education sector is set to be the leading application area for interactive tables, contributing around 29.8% to the overall market share by the end of 2025.
- Regional Insights: North America is projected to emerge as the top regional market, representing about 38.9% of the global interactive tables market share by 2025.
Interactive Tables Market: Use Cases
- Education & Classrooms: Interactive tables enhance collaborative learning in classrooms, allowing students to engage with digital content through touch-based activities, games, and simulations. Teachers can create interactive lessons, enabling group participation, real-time feedback, and inclusive education, especially in STEM and language learning environments.
- Retail & Showrooms: Retailers use interactive tables to provide immersive product exploration, virtual catalogs, and customization options. Shoppers can compare features, watch demo videos, and access promotions, enhancing engagement and purchase decisions. This technology enriches the in-store experience while seamlessly integrating online and offline retail channels.
- Museums & Exhibitions: In museums and exhibitions, interactive tables offer engaging, multimedia-rich experiences by displaying historical timelines, 3D models, and archival footage. Visitors can touch and explore content, encouraging deeper learning and interaction with artifacts, making educational experiences more immersive and memorable.
- Hospitality & Restaurants: Restaurants and hotels deploy interactive tables for digital menus, entertainment, and ordering systems. Diners can browse food items, place orders, play games, or view chef recommendations. Hotels use them in lobbies for concierge services, local guides, or booking amenities, improving customer satisfaction.
- Corporate & Business Environments: Interactive tables are used in boardrooms and collaborative workspaces for presentations, brainstorming, and data visualization. Teams can simultaneously manipulate content, annotate documents, and plan strategies interactively, improving workflow, decision-making, and employee engagement in meetings and workshops.
Interactive Tables Market: Stats & Facts
- Forbes: Interactive touchscreen solutions, including tables, have seen increased deployment in 65% of Fortune 500 retail stores for customer engagement and self-service applications.
- National Center for Education Statistics (NCES): Around 58% of U.S. K-12 schools have incorporated interactive display technologies, including tables, into their classrooms as of 2022.
- Pew Research Center: 73% of teachers reported that touchscreen technologies such as interactive tables helped improve student engagement and personalized learning outcomes.
- Smithsonian Institution: The Smithsonian Museums have integrated interactive tables in over 20 exhibit areas, enabling users to zoom into high-resolution artifacts and access multimedia narratives.
- MIT Media Lab: A study showed that interactive tables in collaborative learning environments increased group productivity by 30%, thanks to simultaneous multi-user access and visual content sharing.
- Intel: Their digital education platform reported that interactive tables improved real-time feedback and student participation by 42% in pilot schools across India and the Philippines.
- Samsung Newsroom: Samsung's SUR40 interactive table (with Microsoft PixelSense) supports 52 simultaneous touch points, allowing multiple users to interact at once—ideal for retail and museums.
- Google Arts & Culture: The platform has partnered with multiple museums globally to deploy interactive tables that allow users to explore over 6 million artifacts digitally.
- National Retail Federation (NRF): Retailers using interactive tables saw a 23% increase in average dwell time and a 15% rise in product conversions compared to non-interactive setups.
- EdSurge: Classrooms with interactive tables report a 35% boost in collaborative learning outcomes and 25% faster concept retention among students.
- University of Melbourne: Their study showed that students using interactive tables retained visual-spatial tasks 40% more effectively than those using traditional methods.
- Retail Dive: Interactive tables helped brands like Nike and Sephora increase personalized recommendations by 45%, boosting sales per square foot.
- Zebra Technologies: Interactive digital solutions, including tables, are now present in 1 out of 3 major retail stores in North America.
- Philips Healthcare: Hospitals using interactive diagnostic tables for MRI and CT scan data analysis reduced report turnaround time by 22%.
- Johns Hopkins Medicine: Interactive tables are used in surgical planning, allowing multi-disciplinary teams to collaborate with real-time 3D visualizations.
- Smithsonian Magazine: Museums integrating touch tables have seen a 50% increase in user interaction time with exhibits.
- National Museum of Singapore: Their Story of the Forest exhibit uses interactive tables and sees over 500,000 visitors annually engaging with the interface.
Market Dynamic
Driving Factors in the Interactive Tables Market
Increasing Adoption in Educational Institutions
The growing integration of digital learning tools in classrooms is significantly driving the demand for interactive tables. Schools and universities are investing in interactive touch tables to foster collaborative learning and improve student engagement. These advanced classroom technologies enable real-time interaction, multimedia content sharing, and dynamic learning experiences, which align with modern pedagogical approaches.
The incorporation of multi-touch displays, gesture recognition, and intuitive interfaces makes learning more immersive. As educators shift toward smart classrooms, the interactive classroom furniture market experiences accelerated growth. Additionally, government initiatives promoting digital education and smart infrastructure are further fueling the adoption of interactive learning tables in academic settings globally.
Technological Advancements in Touchscreen Displays
Rapid technological advancements in capacitive and infrared touchscreen technologies have enhanced the performance, responsiveness, and durability of interactive tables. Improvements in display resolution, multi-user functionality, and software compatibility make these systems highly suitable for diverse applications across sectors like hospitality, retail, and healthcare.
The rise in demand for interactive kiosk tables and digital signage solutions in public spaces and commercial environments is also contributing to market expansion. Enhanced user interface design, compatibility with IoT systems, and integration with cloud-based platforms are making interactive surface technology more appealing for customer engagement and data-driven operations. This trend is strengthening the global smart furniture ecosystem.
Restraints in the Interactive Tables Market
High Initial Investment and Maintenance Costs
One of the major restraints in the interactive tables market is the high cost associated with purchasing and maintaining the systems. Interactive multi-touch tables incorporate advanced components like LCD/LED displays, capacitive sensors, and embedded computing systems, significantly increasing their price compared to traditional furniture or standard digital screens.
Small and medium enterprises, as well as educational institutions with limited budgets, often find it challenging to adopt these technologies. Additionally, maintenance costs involving periodic software updates, hardware servicing, and touch panel calibration add to long-term expenditures, hampering widespread adoption. The high total cost of ownership restricts market penetration, especially in developing economies.
Limited Content Compatibility and Software Integration
Another key challenge faced by the interactive tables market is the lack of standardization and limited compatibility across software platforms. While hardware capabilities continue to evolve, software ecosystems often lag, restricting the seamless integration of third-party applications.
Many businesses and institutions find it difficult to customize interactive digital tables for their specific operational or educational needs. Incompatibility with legacy systems and inconsistent user interface experiences also hinder user adoption. The lack of industry-wide unified development platforms for interactive surface solutions impedes scalability and poses a significant restraint to broader market growth, particularly in sectors requiring specialized or niche applications.
Opportunities in the Interactive Tables Market
Expansion in the Hospitality and Retail Sector
The increasing use of interactive tables in hospitality and retail environments presents a significant growth opportunity. Restaurants are incorporating smart dining tables with built-in touchscreens for ordering, entertainment, and payments, enhancing customer experience. Similarly, retail stores are adopting interactive display tables for digital product catalogs, virtual try-ons, and self-checkout processes.
These applications leverage customer engagement technologies and digital transformation tools to attract tech-savvy consumers. As experiential marketing becomes a priority, interactive point-of-sale solutions and gesture-based interfaces are gaining traction. This trend offers an untapped opportunity for manufacturers to develop customized smart surfaces tailored to the retail and hospitality industries.
Rising Demand for Smart Healthcare Solutions
The healthcare industry is increasingly embracing interactive tables to enhance patient care and streamline medical workflows. Touchscreen-enabled medical tables are used in hospitals for patient registration, diagnostic imaging review, and collaborative treatment planning. These systems support multi-user access, secure data sharing, and integration with electronic health records (EHRs).
Interactive touchscreen technology is also being utilized in rehabilitation and therapy settings for interactive cognitive training and patient monitoring. With the growing focus on digital health, smart medical furniture and digital interface tables offer promising opportunities for innovation. This surge in demand positions the healthcare segment as a high-growth area within the interactive table market.
Trends in the Interactive Tables Market
Integration of AI and IoT for Smart Functionality
A notable trend in the interactive tables market is the integration of artificial intelligence (AI) and Internet of Things (IoT) capabilities. Smart tables now offer features like facial recognition, voice commands, and real-time data analytics to improve user interaction. In corporate settings, AI-powered interactive conference tables enable automated note-taking, gesture control, and personalized user interfaces.
IoT-enabled devices facilitate remote diagnostics, system updates, and usage tracking, creating a connected ecosystem. This fusion of smart technologies enhances operational efficiency and elevates user engagement. As AI-based smart furniture gains popularity, vendors are focusing on developing intelligent digital table platforms with scalable, cloud-based architecture.
Growing Popularity of Custom-Built Interactive Tables
With the rise of sector-specific applications, there is an increasing demand for custom-built interactive tables tailored to unique operational needs. Industries such as automotive, museums, and real estate are using customized interactive touch tables for product visualization, interactive storytelling, and immersive presentations.
Businesses seek bespoke solutions that align with their branding, spatial design, and user interface requirements. This has led to the emergence of modular, flexible touch table designs with adjustable screen sizes, software configurations, and connectivity options. The trend toward personalized and adaptive display furniture is transforming the interactive touchscreen table market into a solution-driven, experience-focused landscape.
Interactive Tables Market: Research Scope and Analysis
By Technology Analysis
The LCD segment is projected to dominate the global interactive tables market by the end of 2025, accounting for 38.6% of the total market share. LCD-based interactive tables offer superior visual clarity, cost-efficiency, and durability, making them ideal for high-traffic environments. Their broad adoption across educational institutions and corporate boardrooms is driven by demand for reliable and scalable touchscreen solutions.
Additionally, advancements in flat-panel display technology and energy-efficient features have elevated their appeal in the commercial display ecosystem. LCDs remain a preferred choice in digital collaboration tools, particularly in classrooms, conference centers, and training facilities, where clear image output and affordability are essential.
The capacitive segment is expected to grow at the highest CAGR in the interactive tables market by 2025. Capacitive touch technology enables high-precision multi-touch capability, sleek design integration, and improved responsiveness, making it increasingly popular in interactive furniture for high-end retail, hospitality, and control room setups.
Unlike resistive displays, capacitive screens support intuitive user interaction and high-definition visuals, which enhance user experience in dynamic applications. The growing trend of smart retail environments and interactive customer engagement platforms fuels this segment's rapid adoption. Capacitive touch surfaces are also pivotal in transforming digital signage into interactive installations, especially in next-gen smart public spaces.
By Screen Size Analysis
The 32 to 65-inch screen size segment is expected to dominate the global interactive tables market by 2025, holding 64.1% of the total market share. This size range is favored for its balance between immersive display experience and installation flexibility, making it suitable for both compact and large spaces.
Widely used across educational and collaborative workspaces, this screen size supports enhanced visual engagement without overwhelming the room layout. It meets the requirements of group-based interaction, ideal for school digital desks, corporate brainstorming tables, and public information kiosks. Furthermore, advancements in touchscreen display integration within this category continue to boost its popularity in the commercial AV space.
The 65 Inch & Above segment is projected to grow with the highest CAGR in the interactive tables market by 2025. This growth is propelled by increasing demand for large-format interactive displays in exhibition spaces, luxury retail, and control centers. These oversized tables offer immersive engagement, allowing for real-time data visualization and rich interactive content, which is crucial for museums, showrooms, and mission-critical environments.
The evolution of multi-user interfaces and collaborative content sharing platforms is also accelerating adoption. Additionally, integration of advanced display technologies like UHD and OLED further enhances interactivity and visual impact, fostering rapid expansion in premium commercial deployments.
By Application Analysis
The education segment is forecasted to dominate the global interactive tables market by the end of 2025, contributing 29.8% of the total market share. Interactive tables are increasingly becoming vital tools in modern classrooms, enhancing student engagement and enabling collaborative learning. With the rise of digital learning platforms and interactive curricula, schools and universities are adopting touch-enabled solutions to foster immersive education.
These tables support group activities, gamified learning, and real-time digital content interaction. As institutions worldwide invest in smart classrooms, interactive tables help bridge the gap between traditional and digital learning methods, promoting creativity, participation, and academic performance improvement.
ℹ
To learn more about this report –
Download Your Free Sample Report Here
The retail segment is anticipated to grow at the highest CAGR in the interactive tables market by 2025. The adoption of interactive tables in retail environments is revolutionizing the shopping experience through digital product catalogs, virtual try-on capabilities, and touch-enabled kiosks. These solutions allow brands to deliver personalized customer experiences and real-time product recommendations.
The rise of experiential retail and omnichannel strategies has driven investments in smart furniture to enhance customer engagement. Moreover, interactive surfaces are being integrated into retail store layouts as part of visual merchandising and self-service solutions, aligning with evolving consumer expectations for technology-driven, immersive shopping journeys.
The Interactive Tables Market Report is segmented on the basis of the following:
By Technology
- LCD
- LED
- Capacitive
- Others
By Screen Size
- 32 to 65 Inch
- 65 Inch & Above
By Application
- Education
- Retail
- Exhibition
- Hospitality
- Control Room
- Transportation
- Others
Regional Analysis
Region with the largest Share
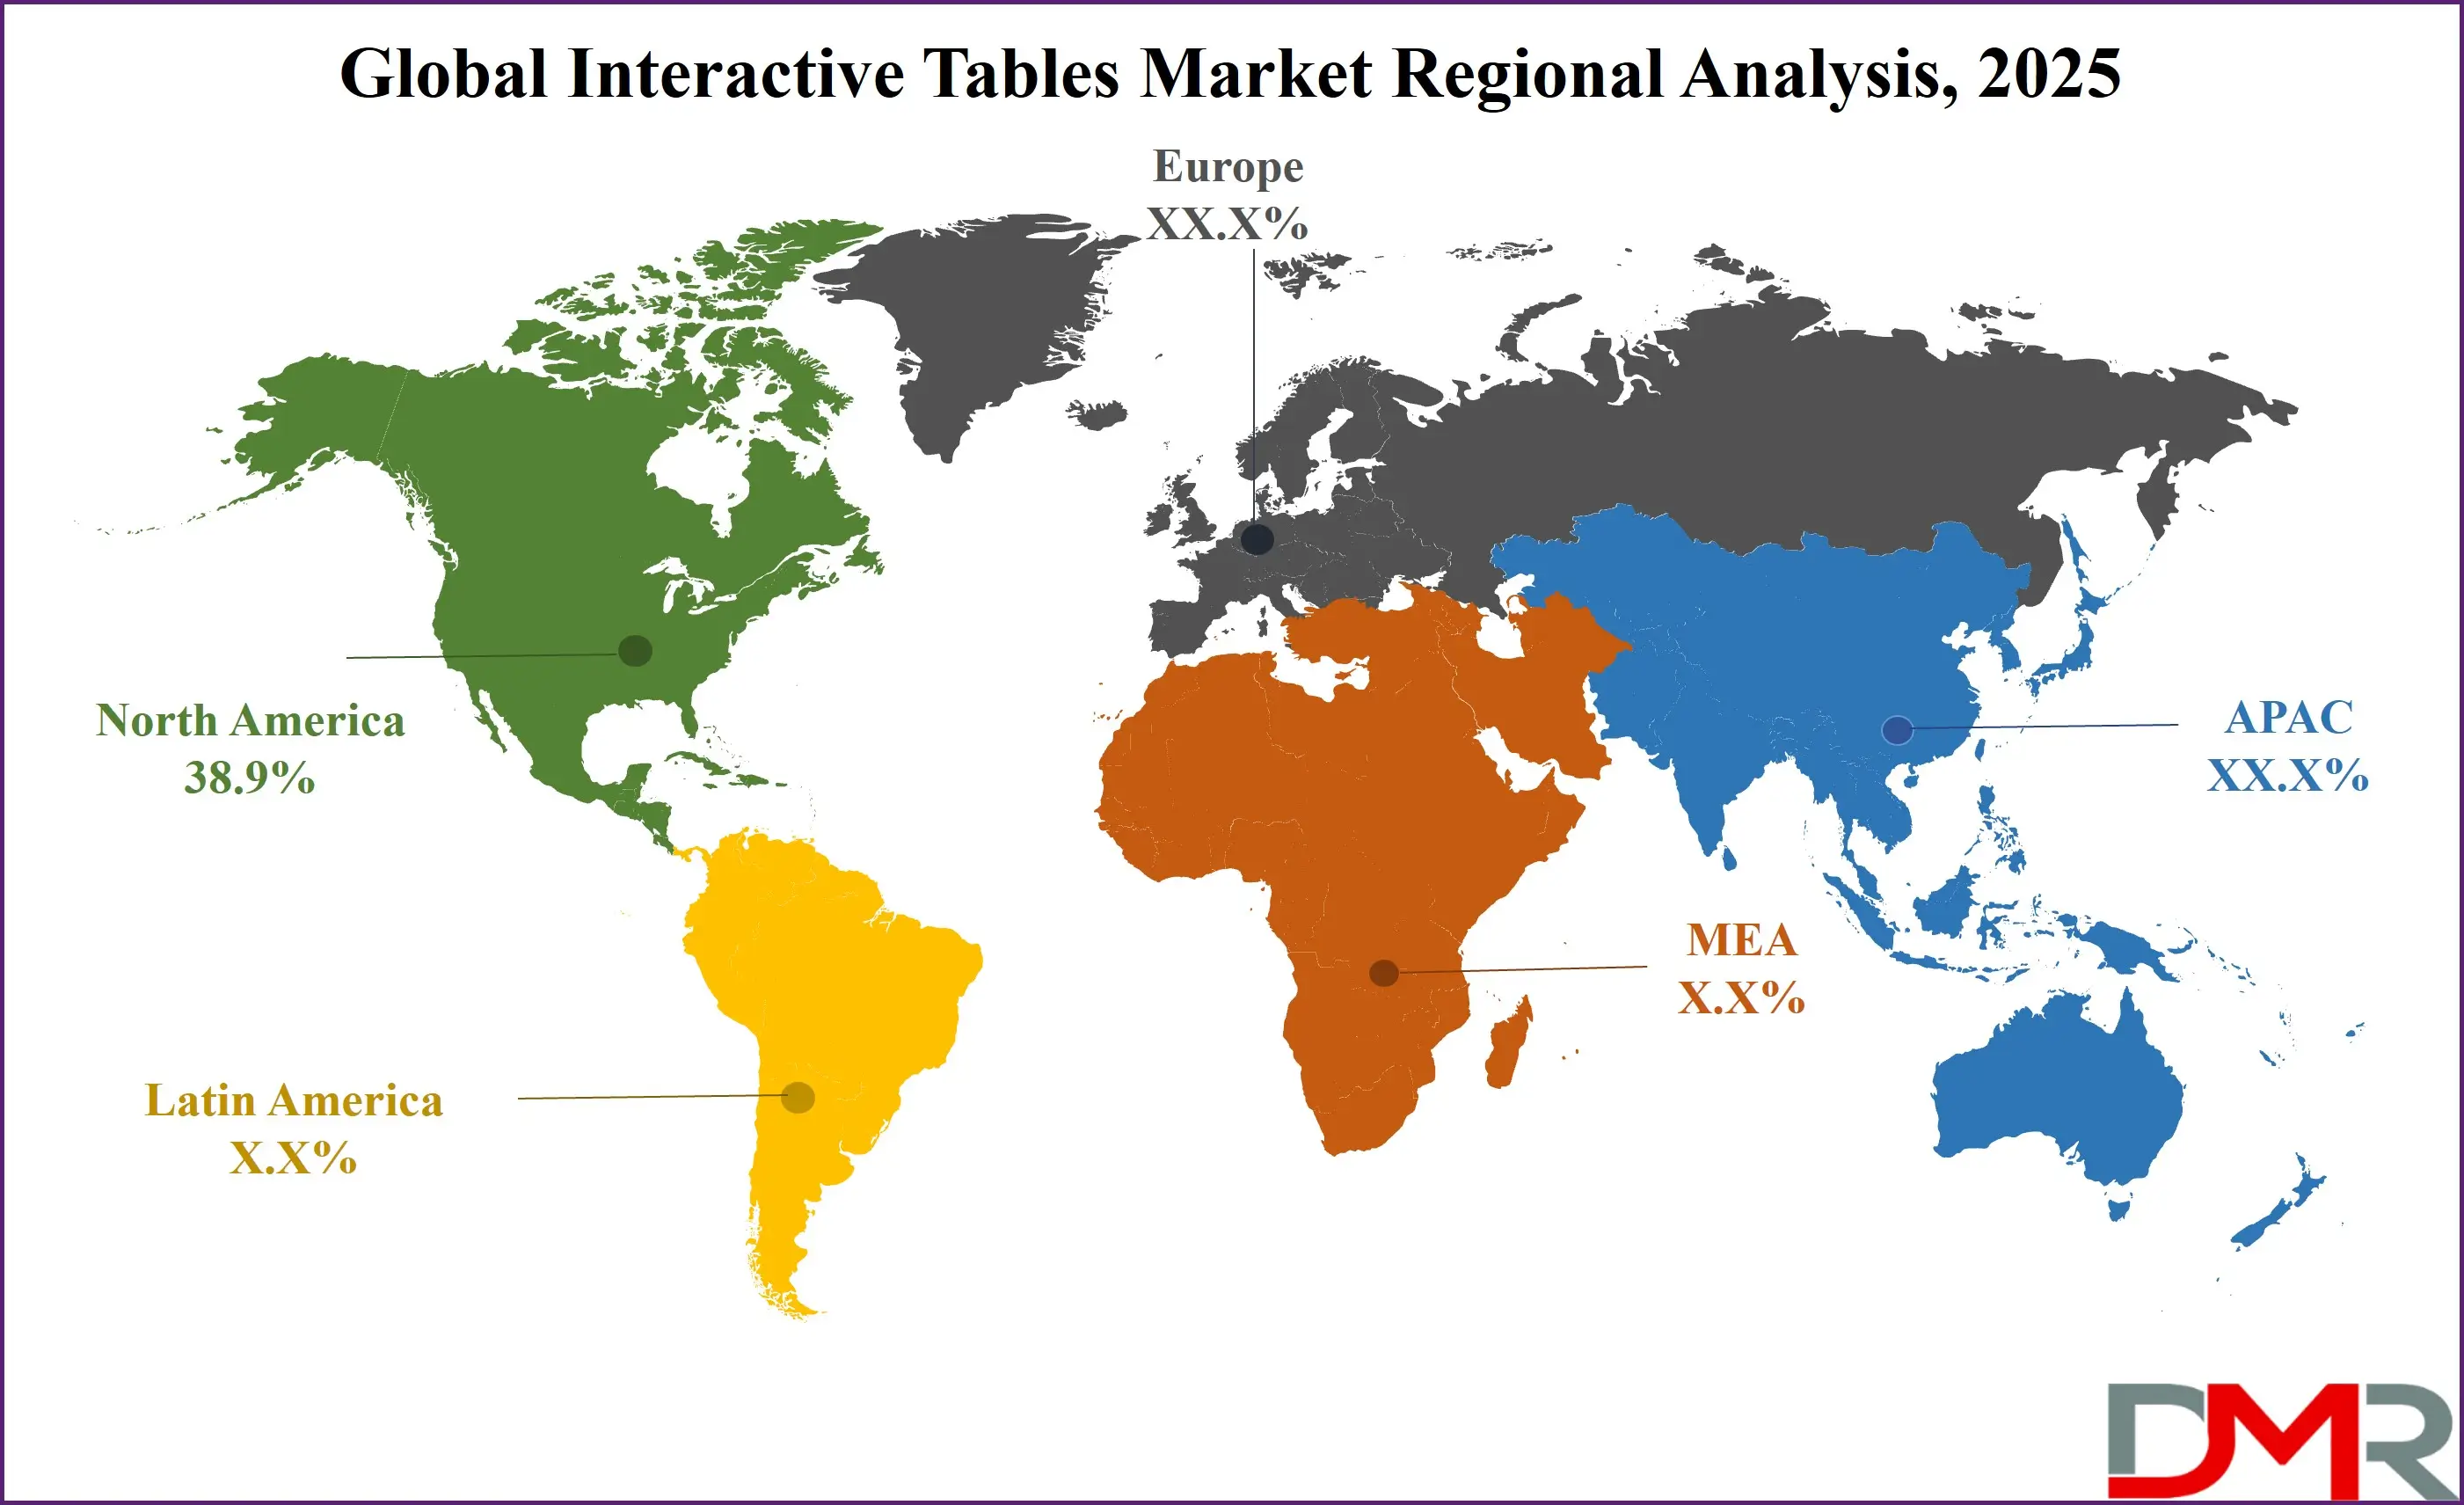
North America is expected to hold the largest share of the global interactive tables market by the end of 2025, accounting for 38.9% of the total market. This dominance is driven by widespread adoption of digital learning solutions in schools and universities, alongside strong demand from the corporate sector for advanced collaboration tools. The presence of major technology firms and high investment in smart classroom infrastructure further fuels market penetration.
ℹ
To learn more about this report –
Download Your Free Sample Report Here
Additionally, sectors such as retail and hospitality in the U.S. and Canada are rapidly integrating interactive furniture to enhance customer engagement. Robust R&D activities and early tech adoption trends continue to support North America’s leadership in this dynamic and evolving market landscape.
Region with Highest CAGR
Asia Pacific is projected to register the highest CAGR in the global interactive tables market through 2025. This growth is primarily fueled by the rapid digital transformation in countries such as China, India, South Korea, and Japan. Increasing government initiatives toward smart education and digital infrastructure development are key drivers across the region.
Rising disposable income, growing demand for immersive in-store experiences in retail, and expansion of modern hospitality environments are further contributing to the adoption of interactive technologies. Local manufacturers’ focus on affordable touchscreen hardware is also boosting regional growth. The strong push for technology adoption across multiple sectors positions Asia Pacific as a high-growth frontier in the interactive tables market.
By Region
North America
Europe
- Germany
- The U.K.
- France
- Italy
- Russia
- Spain
- Benelux
- Nordic
- Rest of Europe
Asia-Pacific
- China
- Japan
- South Korea
- India
- ANZ
- ASEAN
- Rest of Asia-Pacific
Latin America
- Brazil
- Mexico
- Argentina
- Colombia
- Rest of Latin America
Middle East & Africa
- Saudi Arabia
- UAE
- South Africa
- Israel
- Egypt
- Rest of MEA
Impact of Artificial Intelligence in the Interactive Tables Market
- Enhanced User Interaction and Personalization: AI empowers interactive tables to deliver dynamic, personalized experiences by analyzing user behavior, preferences, and gestures. These smart surfaces adapt content in real time, making interactions more intuitive and engaging. Applications in education, hospitality, and retail benefit from this tailored approach to improve user satisfaction and engagement.
- Real-Time Data Processing and Decision Support: AI enables interactive tables to process and analyze real-time data from users, sensors, and connected devices. This allows for immediate feedback and decision-making support in sectors like healthcare, logistics, and education, where live data visualization enhances collaboration, productivity, and strategic planning during critical activities.
- Smart Content Recognition and Display: AI improves object and content recognition capabilities of interactive tables, allowing seamless integration of physical and digital elements. Whether identifying tools in manufacturing or educational materials in classrooms, AI ensures accurate contextual responses, enhancing functionality, reducing input errors, and creating a more immersive user experience.
- Predictive Maintenance and System Efficiency: AI-driven diagnostics monitor hardware health, usage patterns, and software performance of interactive tables. Predictive maintenance minimizes downtime by alerting technicians before failures occur. Additionally, AI optimizes power consumption and software updates, ensuring long-term reliability and efficiency in both commercial and institutional environments.
Competitive Landscape
The competitive landscape of the global interactive tables market is characterized by innovation-driven strategies, strategic partnerships, and increasing investments in product development. Key players are focusing on enhancing multi-touch capabilities, display resolution, and user interface designs to cater to evolving customer demands across education, retail, hospitality, and corporate sectors.
Companies such as SMART Technologies, Ideum, Promethean World, and TableConnect GmbH are at the forefront, offering customizable, large-format interactive tables designed for immersive collaboration and engagement. The integration of augmented reality (AR), gesture recognition, and multi-user functionality is becoming a major differentiator in the interactive display solutions market.
Vendors are also exploring vertical-specific applications, especially in education technology, retail digital signage, and control room environments, by offering sector-specific interactive table software and hardware solutions. Moreover, strategic alliances between touchscreen component suppliers and interactive furniture manufacturers are helping streamline the supply chain and reduce production costs.
The rising trend of interactive digital experiences in smart classrooms, virtual showrooms, and public information kiosks is intensifying competition. With growing demand across emerging economies, global players are expanding their presence in Asia Pacific and Latin America. The market remains dynamic, with continuous innovation shaping the future of smart interactive display technology and collaborative computing surfaces.
Some of the prominent players in the Global Interactive Tables Market are:
- Sealed Air Corporation
- Sonoco Products Company
- Smurfit Kappa Group
- DS Smith Plc
- Pregis LLC
- International Paper Company
- Amcor Plc
- WestRock Company
- Berry Global Inc.
- Mondi Group
- Storopack Hans Reichenecker GmbH
- Huhtamaki Oyj
- Pactiv Evergreen Inc.
- UFP Technologies, Inc.
- Pro-Pac Packaging Limited
- Intertape Polymer Group Inc.
- Ranpak Holdings Corp.
- ORBIS Corporation
- Clondalkin Group Holdings B.V.
- Crown Holdings, Inc.
- Other Key Players
Recent Developments
- In March 2025, Ideum collaborated with the Science Museum of Virginia to launch a new series of immersive exhibits powered by its 65-inch Platform II interactive tables. These installations featured advanced OLED displays and multi-user support, showcasing interactive STEM-based content tailored for museum visitors of all ages.
- In February 2025, DigaliX expanded its SIMMERSIVE solution into international culinary institutes in France and Japan. These institutions integrated the company’s XTable interactive tables into their training programs, allowing students to participate in sensory-based learning modules that combine virtual tasting environments with AI-powered performance feedback.
- In January 2025, SMART Technologies rolled out its next-generation SMART Table Pro, specifically built for higher education and enterprise collaboration. The device includes enhanced gesture recognition, edge-to-edge touch response, and secure integration with Microsoft Teams and Google Workspace, making it ideal for remote teamwork and hybrid learning scenarios.
- In September 2024, Ideum partnered with Clark Planetarium to feature its cutting-edge touch tables at the 2024 Association of Science and Technology Centers (ASTC) Conference held in Chicago. During the event, Ideum showcased its 65-inch Platform II and an experimental OLED version of the same model. These devices ran interactive exhibits developed by Clark Planetarium, including Gravity Lab, Stellar Playground, and Colonize Mars. The exhibits were optimized to operate on multiple touch tables and kiosks engineered by Ideum.
- In July 2024, DigaliX deployed its SIMMERSIVE Interactive Tasting Classroom solution at CIFP Carlos Oroza, a vocational training institution focused on hospitality. The interactive classroom integrates high-tech tools to deliver dynamic and in-depth training. Among the tools included were 'XTable' interactive tables, which support hands-on learning through custom-developed tasting software, immersive virtual environments, and simulated winery experiences.
- In May 2024, SMART Technologies announced the launch of its latest interactive table model designed for hybrid learning environments. The new table supports multi-user collaboration and integrates cloud-based learning software, enabling students and educators to interact in real-time across devices and locations.
Report Details
| Report Characteristics |
| Market Size (2025) |
USD 1,735.2 Mn |
| Forecast Value (2034) |
USD 3,527.9 Mn |
| CAGR (2025–2034) |
8.2% |
| Historical Data |
2019 – 2024 |
| The US Market Size (2025) |
USD 567.7 Mn |
| Forecast Data |
2025 – 2033 |
| Base Year |
2024 |
| Estimate Year |
2025 |
| Report Coverage |
Market Revenue Estimation, Market Dynamics, Competitive Landscape, Growth Factors, etc. |
| Segments Covered |
By Technology (LED, LCD, Capacitive, Others), By Screen Size (32 to 65 Inch, 65 Inch & Above), By Application (Education, Retail, Exhibition, Hospitality, Control Room, Transportation, Others) |
| Regional Coverage |
North America – US, Canada; Europe – Germany, UK, France, Russia, Spain, Italy, Benelux, Nordic, Rest of Europe; Asia-Pacific – China, Japan, South Korea, India, ANZ, ASEAN, Rest of APAC; Latin America – Brazil, Mexico, Argentina, Colombia, Rest of Latin America; Middle East & Africa – Saudi Arabia, UAE, South Africa, Turkey, Egypt, Israel, Rest of MEA |
| Prominent Players |
Sealed Air Corporation, Sonoco Products Company, Smurfit Kappa Group, DS Smith Plc, Pregis LLC, International Paper Company, Amcor Plc, WestRock Company, Berry Global Inc., Mondi Group, Storopack Hans Reichenecker GmbH, Huhtamaki Oyj, Pactiv Evergreen Inc., UFP Technologies, Inc., Pro-Pac Packaging Limited, Intertape Polymer Group Inc., Ranpak Holdings Corp., ORBIS Corporation, Clondalkin Group Holdings B.V., Crown Holdings Inc., and Other Key Players |
| Purchase Options |
We have three licenses to opt for: Single User License (Limited to 1 user), Multi-User License (Up to 5 Users), and Corporate Use License (Unlimited User) along with free report customization equivalent to 0 analyst working days, 3 analysts working days, and 5 analysts working days respectively. |
Frequently Asked Questions
How big is the Global Interactive Tables Market?
▾ The Global Interactive Tables Market size is estimated to have a value of USD 1,735.2 million in 2025 and is expected to reach USD 3,527.9 million by the end of 2034.
Which region accounted for the largest Global Interactive Tables Market?
▾ North America is expected to be the largest market share for the Global Interactive Tables Market with a share of about 38.9% in 2025.
Who are the key players in the Global Interactive Tables Market?
▾ Some of the major key players in the Global Interactive Tables Market are Sealed Air Corporation, Amcor Plc, Smurfit Kappa Group, and many others.
What is the growth rate in the Global Interactive Tables Market?
▾ The market is growing at a CAGR of 8.2% over the forecasted period.
How big is the US Interactive Tables Market?
▾ The US Interactive Tables Market size is estimated to have a value of USD 567.7 million in 2025 and is expected to reach USD 1,106.9 million by the end of 2034.