Market Snapshot
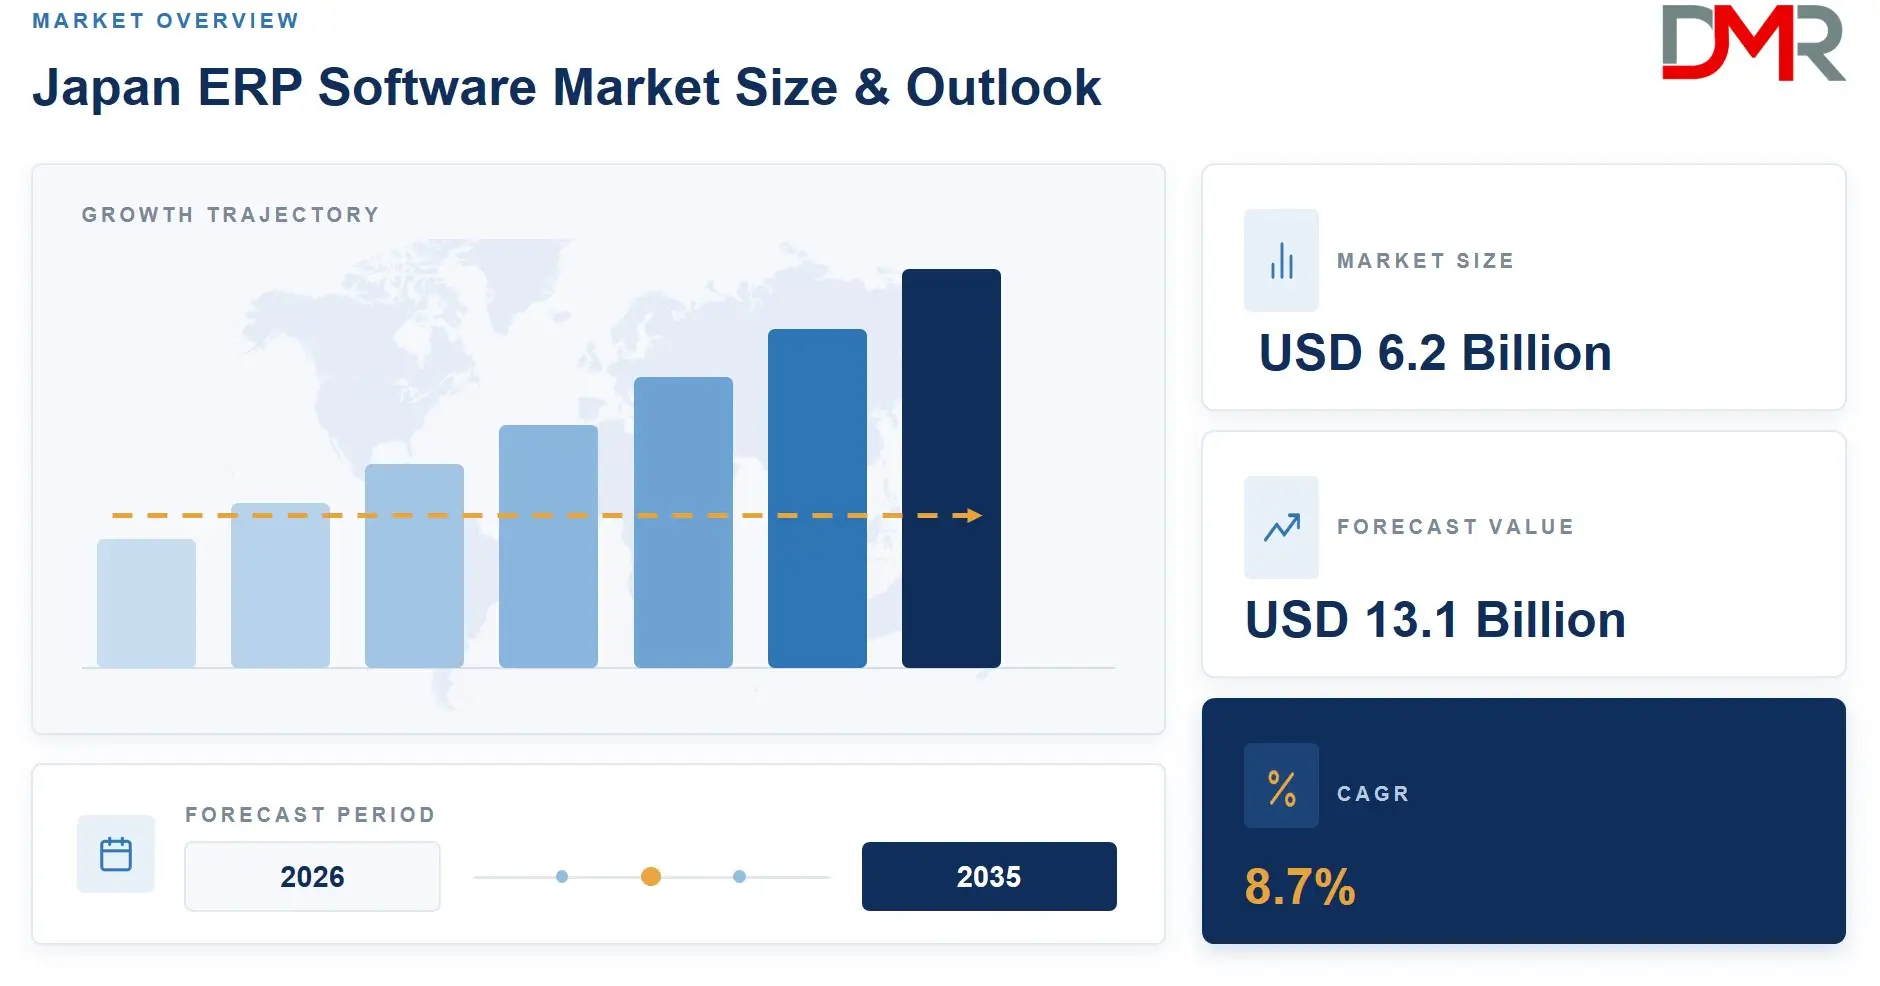
- Market Size (2026): USD 6.2 Bn
- Forecast Value (2035): USD 13.1 Bn
- CAGR (2026-2035): 8.7%
- Leading Deployment (2026): On-Premises, around 41%
- Leading Function (2026): Finance & Accounting, close to 34%
- Key Players: SAP SE, OBIC Co., Ltd., Fujitsu Limited and others
What is Japan ERP Software Market and its Market Size?
The Japan ERP Software Market size is estimated to reach USD 6.2 Bn in 2026 and is further anticipated to reach USD 13.1 Bn by 2035, at a CAGR of 8.7%. Enterprise resource planning software, in the sense used throughout this industry analysis, means the licensed and subscribed application layer that runs finance, procurement, production, inventory, payroll and order management against one shared transaction record.
ℹ
To learn more about this report –
Download Your Free Sample Report Here
These figures cover software revenue recognised against systems used by organisations operating inside the country. They do not represent the worldwide turnover of vendors headquartered in Tokyo or Osaka, and they exclude implementation labour, custom add-on development and separately contracted managed hosting, all of which are counted as services rather than software. Domestic delivery economics put considerably more money into integrator fees than into licences.
Buyers split into two populations that behave nothing alike. A few thousand listed manufacturers, trading houses and financial groups run heavily modified suites installed well over a decade ago and patched by successive integrator teams ever since. For them the purchase is a re-platforming decision worth several years of capital budget, signed off by a board committee. Below that sits a long tail of firms with 50 to 500 staff still reconciling subsidiary ledgers in spreadsheets, buying monthly and module by module, with the accounting package as the entry point.
Three structural shifts are reshaping demand at once. Statutory record-keeping now requires transaction data to be held in machine-readable form, which pushes paper-based back offices toward packaged systems. Mainstream vendor maintenance on the release most large domestic estates run expires before the decade closes, converting a deferred upgrade into a dated obligation with a budget attached. And the pool of engineers who can read twenty-year-old add-on code is shrinking faster than the estates it supports, raising the cost of doing nothing.
Use Cases
- Automotive Component Plant Consolidation: A Tier 1 supplier folds five plant-level production systems onto one instance so that material requirement runs, subcontract processing and cost roll-ups share a single item master. Schedulers see committed capacity across sites, and the monthly close stops waiting on plant spreadsheets.
- Regional Bank Back Office Standardisation: A regional banking group moves branch expense processing, fixed asset registers and vendor payments off separate departmental tools. Internal audit gains one approval trail, and finance sheds the reconciliation work that followed every branch merger.
- Municipal Core System Migration: Local authorities replatform resident tax, benefits accounting and procurement onto standardised government cloud configurations. Officials stop maintaining bespoke code written for one city, and neighbouring municipalities share operating procedures instead of funding separate variants.
- Wholesale Distributor Order to Cash: A building materials wholesaler links electronic order intake, warehouse allocation and qualified invoice issuance into one flow. Credit exposure updates as orders confirm, and sales staff quote from live stock rather than yesterday's extract.
Key Takeaways
- Market Size & Share: Annual software spending is set to add close to USD 6.9 Bn of value between 2026 and 2035, with nearly all of it landing in subscription contracts rather than renewed perpetual licences.
- Deployment Analysis: Public cloud and SaaS editions carry the steepest trajectory of any deployment model, compounding at a CAGR of 15.8% through 2035 while on-premises estates retain the larger installed base.
- Function Analysis: Finance and accounting modules are projected to represent nearly 34% of 2026 revenue, since statutory reporting is what makes a system mandatory and therefore what buyers license first.
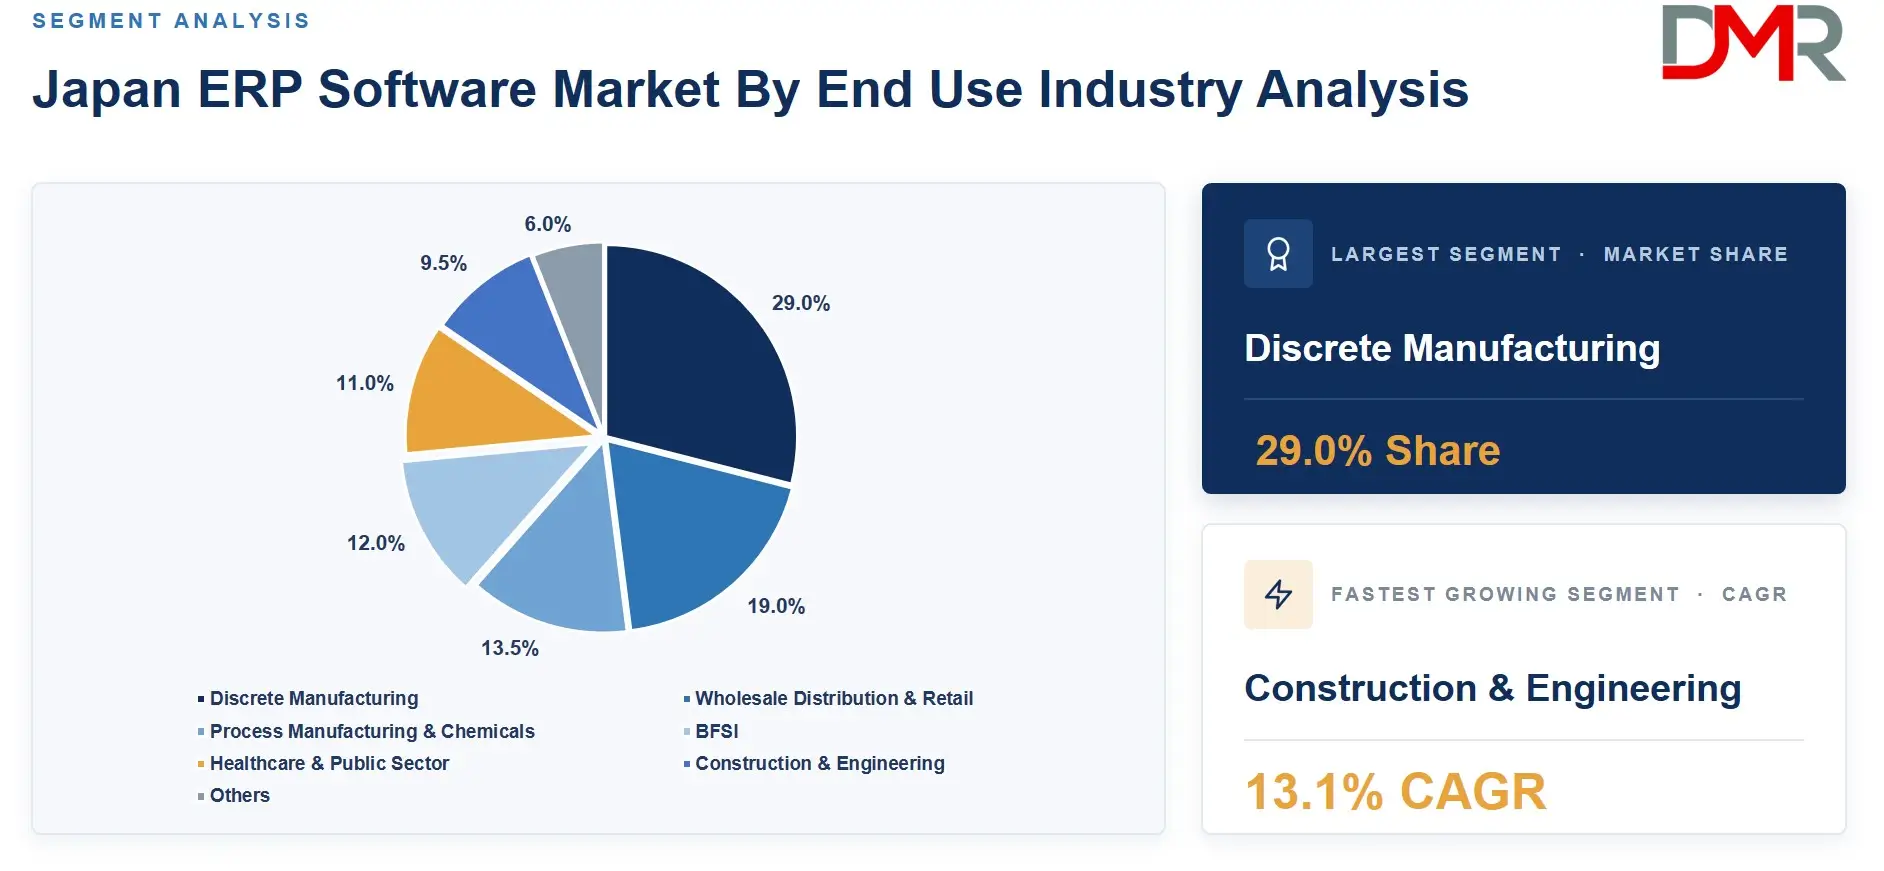
- Demand Concentration: Discrete manufacturing is set to account for around 29% of 2026 revenue, a heavier industrial skew than most developed software markets display.
- Buyer Migration: Small and medium enterprises form the fastest expanding size band, growing at a CAGR of 14.2% as bundled compliance features lower the practical cost of a first system.
- Channel Economics: System integrators and implementation partners are expected to route close to 44% of 2026 software revenue, an unusually high figure that shapes how fast vendors can grow.
How AI/Gen AI is Transforming the Japan ERP Software Market?
Practical impact runs through document handling rather than through conversational front ends. Back offices here process large volumes of supplier invoices, delivery notes and purchase orders arriving as PDFs, faxes and scanned images. Optical character recognition paired with language models now matches those documents against open purchase orders and ledger entries without an operator reading each line. Vendors ship this as a connected capability rather than a separate product, which is why it reaches installed bases quickly.
A second thread sits inside migration itself. Add-on remediation is the slowest phase of any re-platforming programme, and code analysis models that classify legacy modifications by whether standard functionality now covers them compress an assessment that once consumed months of engineer time. Chat interfaces for expense claims are the visible layer of AI here; the measurable saving sits upstream, in document capture and code triage.
- Document Matching: Invoice, receipt and delivery note capture reconciled automatically against ledger entries, cutting the visual checking that expanded once qualified invoice rules took effect.
- Add-On Classification: Static analysis of custom code flags modifications that standard functionality now replaces, reducing the scope carried forward into a cloud target and shortening fit-to-standard workshops.
- Demand and Inventory Forecasting: Statistical models embedded in supply planning replace fixed reorder points with forecasts responsive to promotion calendars and supplier lead time variance.
- Approval Agents: Conversational expense and workflow submission removes form navigation for occasional users, lifting adoption among plant and field staff who touch the system only a few times a month.
Key Drivers in the Japan ERP Software Market
Two forces carry most of the growth in this sector, and they act on opposite ends of the buyer base.
- Support Expiry on Legacy Core Estates: Large domestic enterprises, expected to contribute roughly 53% of 2026 revenue, run suites installed more than a decade ago and modified heavily since. Mainstream vendor maintenance on the releases underpinning those estates closes before the end of the decade, after which security fixes and statutory updates stop arriving. Boards face a dated choice between extended coverage, third-party maintenance or re-platforming outright. Because implementations here carry unusually high modification counts, re-platforming is approved as a multi-year programme rather than an annual line item, converting a compliance deadline into committed spend that persists past the switchover.
- Statutory Digital Record-Keeping: Electronic ledger preservation rules and the qualified invoice regime together require transaction records to be retained in machine-readable form with verifiable supplier registration status. Firms running on spreadsheets and desktop accounting cannot meet retention and matching requirements by hand once volumes rise past a few hundred documents a month. That pressure bites hardest below the enterprise tier, where the small and medium segment expands at a CAGR of 14.2% through 2035. Vendors have answered by bundling registration lookup and archive compliance into entry-level subscriptions, removing the argument that a packaged system costs more than continuing manually.
Restraints in the Japan ERP Software Market
Two constraints slow the conversion of intent into signed contracts, and neither is usually priced in.
- Modification Debt in Installed Estates: Decades of add-on development have produced estates where business rules live in custom code rather than in configuration. Establishing what can be dropped, what must be rebuilt and what has no documented owner routinely takes longer than the technical migration. The compromise landing zone shows in the numbers: hosted private cloud, which preserves modifications while moving the hardware, is expected to hold roughly 16% of 2026 revenue. That choice defers the standardisation benefit and carries the same maintenance burden onto rented infrastructure, but it clears the deadline, so committees keep selecting it.
- Implementation Capacity, Not Licence Price: Deals stall on delivery resource rather than on budget approval. Consultants who can bridge domestic accounting practice and standard package functionality are scarce, and the clustering of migration deadlines means several thousand programmes compete for the same benches simultaneously. System integrators and implementation partners route close to 44% of 2026 software revenue, so vendor growth is capped by partner headcount as much as by demand. Mid-market buyers unable to outbid listed companies for delivery teams postpone projects, pushing revenue recognition rightward.
Growth Opportunities in the Japan ERP Software Market
White space sits where compliance pressure has arrived recently and packaged coverage has not caught up.
- Construction and Engineering Back Offices: Overtime caps applied to construction labour and revised subcontracting obligations have made project cost visibility a legal exposure rather than a management preference. General contractors and specialist trades still run job costing on spreadsheets fed by site paperwork. This end industry is forecast to expand at a CAGR of 13.1% to 2035, faster than any other covered here, and it rewards vendors who ship progress billing, subcontractor payment retention and labour hour capture as standard functionality. Vertical depth wins these accounts; breadth does not.
- Marketplace and Embedded Distribution: Cloud marketplaces account for only about 6% of 2026 revenue, a thin channel for a market of this size. Regional banks, accounting federations and telecom carriers already hold trusted relationships with hundreds of thousands of smaller firms, and several have begun reselling back-office subscriptions alongside settlement and lending products. Distribution through those balance sheets reaches buyers who never issue a request for proposal and lowers acquisition cost sharply against direct selling. Vendors building billing and provisioning for that model early will hold the SME tier.
Trends in the Japan ERP Software Market
Buying behaviour is changing faster than the installed base itself.
- Composable Replacement Displacing the Single Cutover: Instead of one all-at-once migration, buyers increasingly hold a stable finance core and swap surrounding modules on separate cycles. Hybrid configurations, expected to represent close to 8% of 2026 revenue, are the visible result: the general ledger stays where auditors know it, while expense, procurement and workforce functions move to subscription services joined by interfaces. The approach lowers single-project risk and spreads spend across budget years, though it shifts integration cost onto the buyer and makes master data governance decisive.
- Workforce Modules Pulling Ahead of Finance: Human capital management is the fastest expanding functional area, growing at a CAGR of 13.4% through 2035. Labour shortage has turned hiring, retention analytics and shift optimisation into board-level topics, while disclosure rules covering pay and working hours have given HR data an external audience. Buyers who once treated payroll as a low-value module now specify it in the first implementation phase. Vendors have responded by pricing workforce suites independently of the finance core, which lets them enter accounts they cannot win on general ledger alone.
Research Scope and Analysis
Revenue is cut five ways below: by deployment model, by functional module, by organization size, by end use industry and by route to market. Each subsection identifies where 2026 spending sits, which sub-segment climbs fastest to 2035, and the commercial reason behind both positions.
ℹ
To learn more about this report –
Download Your Free Sample Report Here
By Deployment
On-premises installations are projected to hold the largest deployment position in 2026 at approximately 41% of revenue, a consequence of estate age rather than preference, since heavily modified suites cannot be lifted without rewriting the modifications that carry the business rules. Data residency expectations in financial services and public procurement reinforce that position. The steeper trajectory belongs to public cloud and SaaS editions, expanding at a CAGR of 15.8% between 2026 and 2035 as fit-to-standard delivery compresses implementation duration, domestic cloud regions remove the residency objection, and vendors withdraw perpetual licensing from new-customer price lists, leaving subscription as the only route open to greenfield buyers.
By Function
Finance and accounting is expected to carry close to 34% of 2026 revenue by function, because statutory reporting is what makes a core system mandatory: closing, consolidation, tax filing and audit trail obligations apply to every organisation regardless of what it sells. First purchases almost always begin here, and the ledger then anchors every module added afterwards. Growth, however, concentrates in human capital management, advancing at a CAGR of 13.4% to 2035. Persistent labour scarcity has turned retention and shift planning into measured disciplines, disclosure rules have given workforce data an external audience, and buyers now specify these functions in phase one rather than deferring them.
By Organization Size
Large enterprises are set to represent roughly 53% of 2026 revenue, a concentration driven by seat counts, subsidiary structures and the multi-entity consolidation requirements that accompany listed status. One trading house or automotive group can carry more licensed users than several hundred smaller firms combined. Momentum sits at the opposite end. Small and medium enterprises expand at a CAGR of 14.2% through 2035 as entry-level subscriptions bundle supplier registration checks and archive compliance that would otherwise demand manual process design. Annual price points below one million yen have moved the decision from the board to the accounting manager, shortening sales cycles markedly.
By End Use Industry
Discrete manufacturing is projected to account for around 29% of 2026 revenue, the largest end industry position, reflecting how much of the national corporate base builds physical goods and how tightly production planning, bill of material control and subcontract processing bind into the core system. Multi-plant groups also license more modules per site than service firms do. Fastest expansion belongs to construction and engineering, at a CAGR of 13.1% to 2035, where statutory overtime limits and revised subcontracting obligations have made job-level cost and labour hour visibility a compliance matter, pulling a historically spreadsheet-driven sector toward packaged project accounting.
By Distribution Channel
System integrators and implementation partners are expected to route close to 44% of 2026 software revenue, an outsized share created by the local delivery model, in which buyers contract for an outcome and the partner supplies licence, configuration and long-term maintenance as a single relationship. Vendor field teams rarely displace that arrangement in enterprise accounts. Cloud marketplaces post the highest growth rate, a CAGR of 17.9% between 2026 and 2035 from a small base, as banks, carriers and accounting federations bundle back-office subscriptions into services their smaller customers already purchase, reaching firms that never run a formal selection process.
The Japan ERP Software Market Report is Segmented Based on the Following
By Deployment
- On-Premises
- Public Cloud and SaaS
- Hosted Private Cloud
- Hybrid
- Others
By Function
- Finance & Accounting
- Supply Chain & Manufacturing Operations
- Human Capital Management
- Procurement & Sourcing
- Order Management & Sales
- Others
By Organization Size
- Large Enterprises
- Upper Mid-Market
- Small & Medium Enterprises
- Micro Enterprises
- Others
By End Use Industry
- Discrete Manufacturing
- Wholesale Distribution & Retail
- Process Manufacturing & Chemicals
- BFSI
- Healthcare & Public Sector
- Construction & Engineering
- Others
By Distribution Channel
- System Integrators & Implementation Partners
- Direct Vendor Sales
- Value-Added Resellers & Dealers
- Cloud Marketplaces
- Others
Competitive Landscape
Concentration differs sharply by tier. At the top, a small group of international suites and one or two domestic component-based platforms take most enterprise revenue, and switching between them is rare enough that market share moves mainly when an estate reaches end of support. Below roughly 500 employees the picture inverts: dozens of subscription vendors compete on price, onboarding speed and accounting firm endorsement, with churn measured in months rather than decades. Enterprise deals are won on migration methodology, industry templates and partner bench depth; mid-market deals are won on compliance features shipped as standard. Three strategies dominate current positioning: clean-core implementation offers that contractually cap add-on development, vertical templates that shorten fit-to-standard workshops, and channel partnerships with banks and accounting bodies that reach buyers who never issue a tender.
Some of the Prominent Players in the Japan ERP Software Market Are
- SAP SE
- Oracle Corporation
- Microsoft Corporation
- International Business Machines Corporation
- Fujitsu Limited
- NEC Corporation
- Hitachi, Ltd.
- NTT DATA Group Corporation
- Accenture plc
- Workday, Inc.
- Infor
- Epicor Software Corporation
- IFS AB
- QAD Inc.
- The Sage Group plc
- Unit4
- Acumatica, Inc.
- Odoo S.A.
- Zoho Corporation
- OBIC Co., Ltd.
- Works Applications Co., Ltd.
- GRANDIT Corporation
- Miroku Jyoho Service Co., Ltd.
- PCA Corporation
- Yayoi Co., Ltd.
- Oro Inc.
- Otsuka Corporation
- SCSK Corporation
- TIS Inc.
- BIPROGY Inc.
- Nomura Research Institute, Ltd.
- Business Engineering Corporation
- Dentsu Soken Inc.
- JBCC Holdings Inc.
- Ashisuto Co., Ltd.
- Toshiba Digital Solutions Corporation
- Cybozu, Inc.
- Multibook Inc.
- Money Forward, Inc.
- freee K.K.
- Other Key Players
Recent Developments
- In July 2026, NTT DATA Group moved its own core systems to a private cloud ERP edition alongside the vendor's business AI toolset. The group also sells migration services, so running the target architecture internally becomes a reference asset.
- In April 2026, Oro added the first AI capability to its project-oriented cloud suite, inferring daily work log entries from calendar records. Time capture accuracy drives project costing, the weakest data input in services-sector deployments.
- In March 2026, SAP Japan's partner awards recognised two contrasting domestic projects: an ERP rebuild at INPEX that cut inherited add-ons by roughly 60 percent, and a public cloud edition installed outright at Nippon Yusen instead of an on-premises upgrade.
- In December 2025, SCSK linked its PROACTIVE suite to an external AI document reader to automate invoice matching, targeting checking work that expanded once qualified invoice rules took effect. An established package absorbed a compliance workload without a version upgrade.
- In June 2025, the same vendor added agent-based expense claim and approval handling to that suite, letting occasional users submit through conversation. Adoption among plant and field staff is the usual failure point in expense rollouts.
Report Details
| Report Characteristics |
| Market Size (2026) |
USD 6.2 Bn |
| Forecast Value (2035) |
USD 13.1 Bn |
| CAGR (2026-2035) |
8.7% |
| Historical Data |
2021 - 2025 |
| Forecast Data |
2026 - 2035 |
| Base Year |
2025 |
| Segments Covered |
By Deployment, By Function, By Organization Size, By End Use Industry, and By Distribution Channel |
| Regional Coverage |
Japan |
Frequently Asked Questions
How big is the Japan ERP Software Market?
▾ Market size is estimated at USD 6.2 Bn in 2026, covering licence, subscription and maintenance revenue for enterprise resource planning software used by organisations operating in the country. Implementation labour and separately contracted managed hosting sit outside that figure. Value is projected to reach USD 13.1 Bn by 2035.
What is the growth rate of the Japan ERP Software Market?
▾ Forecast growth runs at a CAGR of 8.7% between 2026 and 2035. That rate sits above general domestic software spending because two schedules overlap: mainstream maintenance expiry on legacy enterprise estates, and statutory record-keeping rules moving smaller firms off spreadsheets onto packaged systems for the first time.
What is driving demand in the Japan ERP Software Market?
▾ Demand rests on dated obligations more than on discretionary modernisation. Vendor maintenance windows for the releases underpinning most large domestic estates close before the decade ends, forcing a budgeted decision. Alongside that, electronic ledger preservation and qualified invoice requirements push smaller firms toward systems that handle retention and supplier verification automatically.
Which deployment model leads the Japan ERP Software Market?
▾ On-premises installations are expected to lead in 2026 with approximately 41% of revenue, sustained by modified estates that cannot move without rewriting custom code. Public cloud and SaaS editions carry the fastest growth, at a CAGR of 15.8% to 2035, helped by domestic cloud regions and the withdrawal of perpetual licensing for new buyers.
Which industry accounts for the largest share of the Japan ERP Software Market?
▾ Discrete manufacturing is projected to hold the largest end industry position in 2026 at around 29% of revenue. Production planning, bill of material control and subcontract processing bind tightly into the core system, and multi-plant groups license more modules per site than service businesses. Construction and engineering grows fastest.
Who are the key players in the Japan ERP Software Market?
▾ Prominent participants include SAP SE, Oracle Corporation, OBIC Co., Ltd., Fujitsu Limited, SCSK Corporation, Works Applications Co., Ltd. and Otsuka Corporation. International suites dominate enterprise accounts, domestic component platforms hold the upper mid-market, and subscription vendors compete below roughly 500 employees, where accounting firm endorsement often decides the outcome.
What is the forecast outlook for the Japan ERP Software Market through 2035?
▾ The Japan ERP Software Market is forecast to reach USD 13.1 Bn by 2035, with the increment weighted toward subscription contracts rather than renewed perpetual licences. Compounding sits with public cloud deployment, workforce modules and the small and medium size band, while on-premises estates keep the larger absolute base throughout the forecast period.