Market Overview
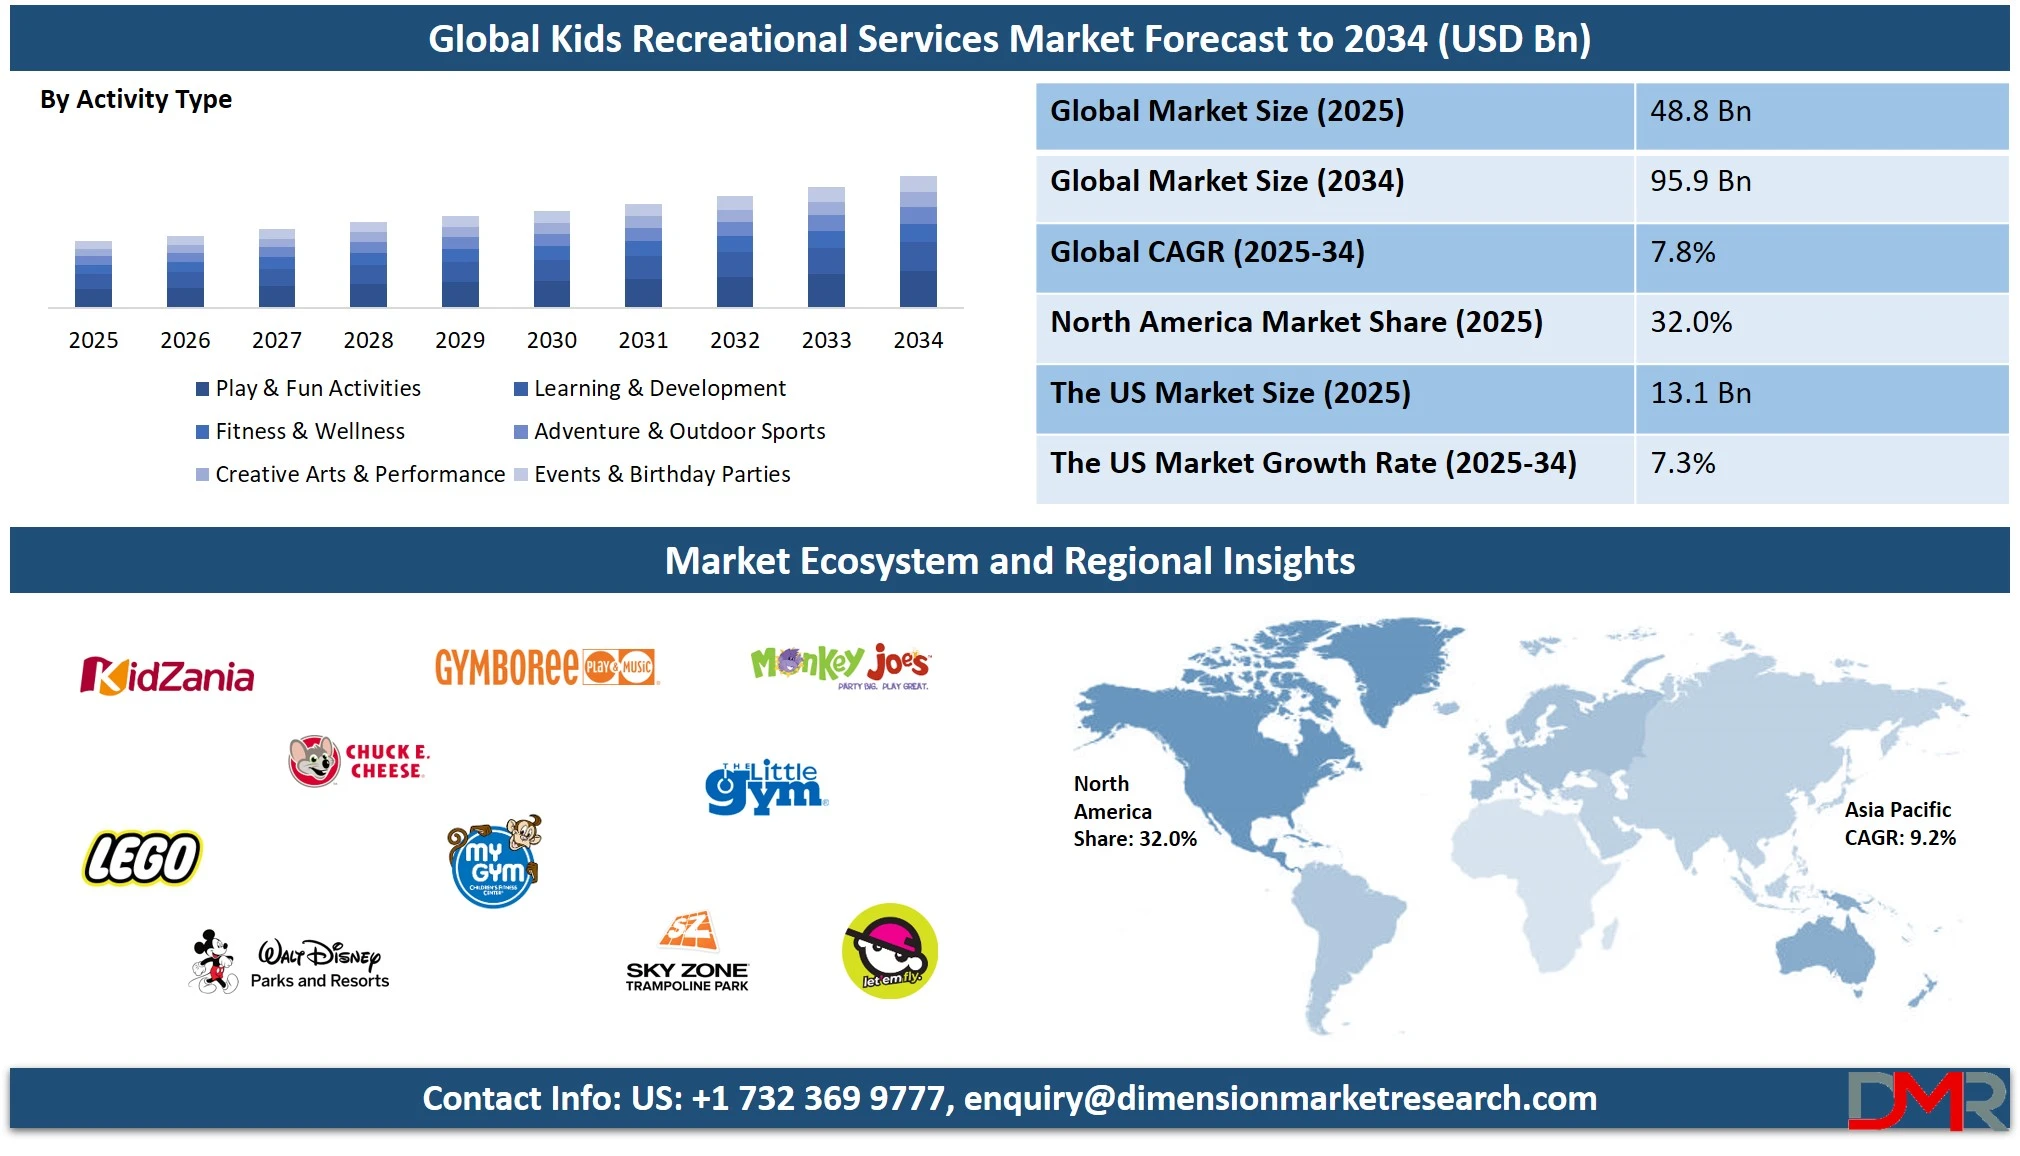
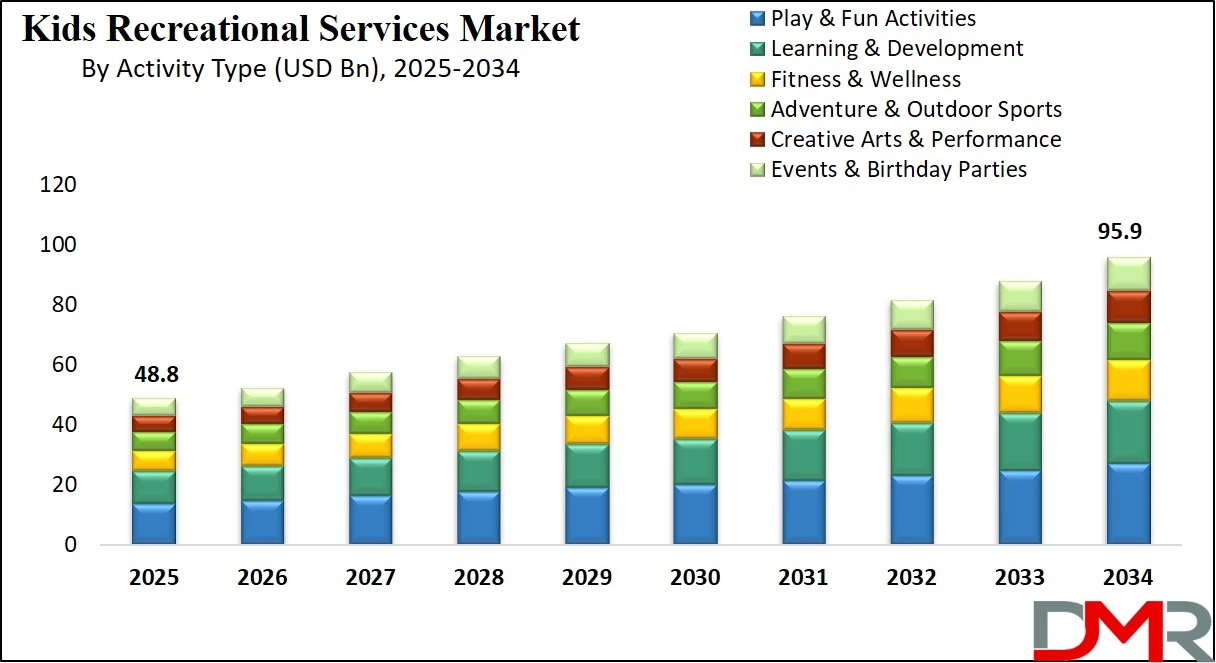
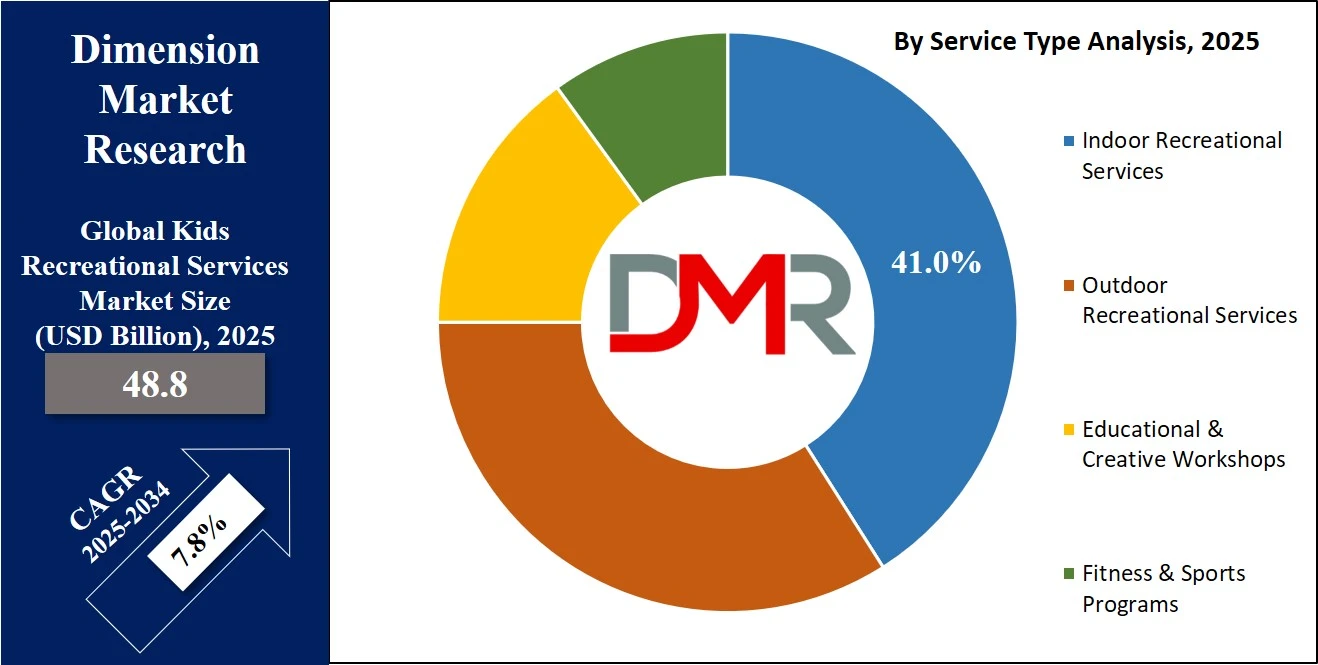
The global kids recreational services market is projected to reach USD 48.8 billion in 2025 and is expected to grow to USD 95.9 billion by 2034, expanding at a CAGR of 7.8%. Growth is driven by rising demand for child enrichment programs, indoor play centers, edutainment services, and activity-based learning across urban regions.
Kids recreational services encompass a broad spectrum of structured and informal activities designed to support the physical, emotional, social, and cognitive growth of children in a fun and engaging environment. These services typically include indoor play centers, creative art workshops, outdoor adventure parks, Adventure Sports and Activities, Fitness Apparel-integrated fitness programs, and skill-based learning camps. The aim is to provide children with safe, stimulating, and age-appropriate experiences that go beyond traditional academics.
Activities are tailored to different developmental stages, encouraging imagination, teamwork, physical movement, and curiosity through play-based learning. These services are often offered by private recreational centers, community hubs, schools, or franchise-based entertainment brands that focus on creating interactive and inclusive experiences for kids, enhanced by Digital Experience Platforms and AI-driven Education Platforms.
The global kids recreational services market is a vibrant and rapidly evolving sector driven by changing lifestyles, rising awareness of child development, and a growing demand for experiential learning and Educational Tourism. Urban families, especially in metropolitan regions, are seeking alternatives that combine entertainment with education, physical activity, and social interaction.
As dual-income households become more common and screen time increases, parents are actively looking for engaging options that promote creativity, motor skill development, and peer bonding. This has led to the emergence of modern indoor play zones, STEM-based creative studios, Virtual Reality (VR) edutainment setups, and child-friendly fitness clubs that cater to a wide range of age groups and interests. Customizable programs, after-school activities, and seasonal camps are becoming popular across various regions, contributing to consistent market growth.
In addition, technological innovation and safety-centric infrastructure have played a significant role in reshaping the landscape of children’s recreation. Operators are incorporating AI in Game Development, Immersive Technology, Extended Reality, and Intelligent Tutoring Systems to attract tech-savvy kids while ensuring physical and mental engagement.
The expansion of family entertainment centers, themed recreational parks, and wellness-focused child programs reflects the shift in parental preferences toward holistic child development. With growing investments from private equity, educational organizations, and lifestyle brands, the kids' recreational services market is poised for strong expansion across Asia Pacific, North America, and the Middle East, addressing both developmental and recreational needs in a balanced format.
The US Kids Recreational Services Market
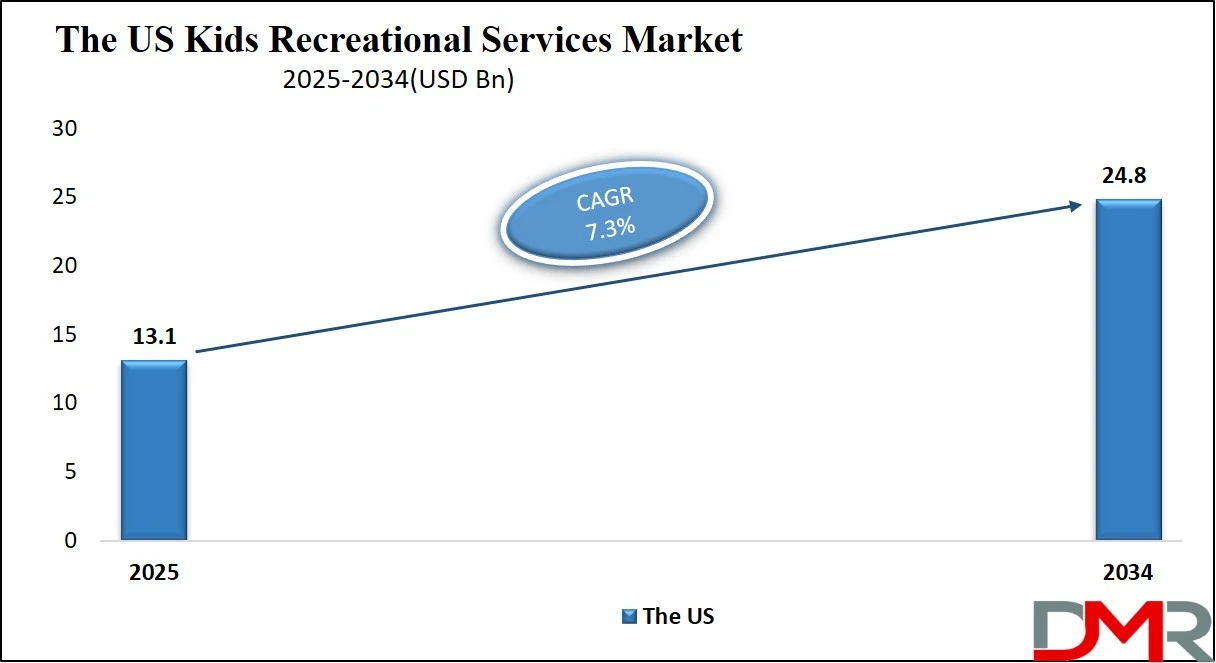
The U.S. Kids Recreational Services Market size is projected to be valued at USD 13.1 billion in 2025. It is further expected to witness subsequent growth in the upcoming period, holding USD 24.8 billion in 2034 at a CAGR of 7.3%.
The United States kids' recreational services market is one of the most mature and diversified segments globally, characterized by a strong presence of indoor play facilities, community-based programs, edutainment centers, and after-school enrichment activities. With a growing emphasis on holistic child development, American parents are investing in structured recreational programs that enhance creativity, physical fitness, and social skills.
Services such as trampoline parks, interactive museums, STEM-focused workshops, dance studios, and martial arts classes are in high demand, catering to children across all age groups. The rise of dual-income households and busy urban lifestyles has further fueled the need for safe, engaging, and professionally managed recreational environments. Franchise-based entertainment brands, school-affiliated programs, and wellness-driven recreational centers are key contributors to the market's expansion.
The market also benefits from strong community and municipal support, with local governments and nonprofit organizations offering subsidized or free recreational services in public parks, libraries, and youth centers. Technological integration has played a vital role in reshaping the landscape, with digital booking platforms, gamified learning modules, and hybrid in-person and online activity options becoming more common.
Additionally, seasonal camps, birthday party services, sensory play centers, and inclusive programs for children with special needs have seen significant traction. Rising awareness about childhood obesity, mental wellness, and social development continues to drive innovation and investment in fitness-based activities, nature exploration programs, and creative arts classes. With a high level of parental engagement and a culture that values experiential learning, the US kids recreational services market remains a leader in setting global trends and standards.
Europe Kids Recreational Services Market
The European kids' recreational services market is expected to be valued at USD 12.2 billion in 2025. This strong position is driven by the region’s long-standing focus on child welfare, early education, and creative development. Western European countries like Germany, the United Kingdom, and France have well-developed ecosystems that support both indoor and outdoor recreational activities for children, including play zones, nature parks, creative art studios, and physical activity programs.
High parental awareness, government-supported child development initiatives, and widespread availability of structured enrichment programs have contributed to the consistent growth of this market. Moreover, increased demand for safe, inclusive, and skill-enhancing recreational spaces has led to the expansion of both public and private service providers.
Looking forward, the European market is projected to grow at a steady CAGR of 6.9% from 2025 to 2034. While this growth rate is moderate compared to some emerging regions, it reflects the maturity and stability of the market. The region continues to invest in technology-integrated play solutions, edutainment centers, and experiential learning platforms to meet evolving parental expectations and digital engagement trends.
Additionally, sustainability and inclusivity are becoming core themes in new recreational developments, especially in urban areas where space and safety are key concerns. As demographic changes and urbanization reshape family lifestyles, the market is likely to experience sustained demand for recreational services that blend education, entertainment, and wellness in innovative ways.
Japan Kids Recreational Services Market
The Japan kids recreational services market is estimated to be valued at USD 2.4 billion in 2025. This relatively modest share is reflective of Japan’s unique demographic structure, marked by a declining birth rate and an aging population. However, despite a shrinking youth demographic, Japanese parents continue to invest heavily in high-quality, safe, and educational recreational experiences for their children.
Urban centers like Tokyo, Osaka, and Yokohama host a variety of indoor play parks, creative learning centers, and technology-integrated edutainment zones that cater to the country’s demand for clean, efficient, and intellectually stimulating child engagement. Moreover, cultural emphasis on discipline, structured learning, and early childhood development further reinforces demand for premium recreational services.
The market is projected to grow at a moderate CAGR of 5.8% from 2025 to 2034, driven by innovation and the integration of digital technologies in recreational formats. As Japan continues to advance in robotics, artificial intelligence, and immersive learning environments, many kids' centers are evolving to offer experiences that combine fun with education, such as coding labs, STEM-based activity zones, and interactive storytelling spaces.
Additionally, there is a growing trend toward inclusive recreational services tailored for children with special needs, aligning with broader societal values around accessibility and equal development. Although overall market expansion is constrained by demographic factors, the demand for high-quality, tech-enhanced, and enrichment-driven recreational services is expected to sustain steady growth over the coming decade.
Global Kids Recreational Services Market: Key Takeaways
- Market Value: The global kids recreational services market size is expected to reach a value of USD 95.9 billion by 2034 from a base value of USD 48.8 billion in 2025 at a CAGR of 7.8%.
- By Service Type Segment Analysis: Indoor Recreational Services are anticipated to dominate the service type segment, capturing 41.0% of the total market share in 2025.
- By Age Group Segment Analysis: 9–12 years (Pre-teens) are expected to maintain their dominance in the age group segment, capturing 43.0% of the total market share in 2025.
- By Activity Type Segment Analysis: Play & Fun Activities are poised to consolidate their dominance in the activity type segment, capturing 28.0% of the total market share in 2025.
- By Ownership Model Segment Analysis: Independent Local Operators will dominate the ownership model segment, capturing 45.0% of the market share in 2025.
- By Booking Mode Segment Analysis: Offline mode will dominate the booking mode segment, capturing 52.0% of the market share in 2025.
- Regional Analysis: North America is anticipated to lead the global kids recreational services market landscape with 32.0% of total global market revenue in 2025.
- Key Players: Some key players in the global kids recreational services market are KidZania, Chuck E. Cheese, LEGO Group, Walt Disney Parks, Gymboree, My Gym, Sky Zone, Monkey Joe’s, The Little Gym, Urban Air, BounceU, Discovery Cube, Play City, Wonderwild, Kids Empire, Pump It Up, Toca Boca, Safari Kid, and Others.
Global Kids Recreational Services Market: Use Cases
- After-School Enrichment Programs for Working Parents: In urban and suburban regions, dual-income families are reliant on structured after-school recreational services that offer both childcare and enrichment. These programs include creative arts, music, dance, robotics, and language skills, designed to keep children engaged after school hours while contributing to their cognitive and social development. Kids' recreational centers, such as The Little Gym and Safari Kid, cater specifically to this need by combining play with learning in a safe, supervised environment. This use case reflects a growing demand for holistic childcare alternatives that go beyond babysitting, offering meaningful experiences during the critical development phase of children aged 4 to 12.
- Indoor Play Centers as Safe Entertainment Hubs: Indoor play areas such as Sky Zone Trampoline Park, Kids Empire, and BounceU are popular in regions with harsh weather conditions or dense urban populations where outdoor space is limited. These centers provide a climate-controlled, safe, and hygienic environment where children can expend energy through physical activities such as jumping, climbing, and running. They are also equipped with obstacle courses, soft play structures, and interactive play stations to support motor skill development and social interaction. This use case underscores the significance of physical fitness and sensory stimulation in early childhood, rendering indoor recreation a preferred option for many modern parents.
- STEM-Based Edutainment Zones for Skill Development: As education systems globally pivot toward experiential learning, kids recreational services have evolved to include science, technology, engineering, and math (STEM) themes. Centers like LEGO Discovery Centers and KidZania offer immersive environments where children participate in role-playing, simulations, and hands-on experiments. These services not only entertain but also prepare children for future academic success and career readiness by sparking interest in problem-solving and innovation. This use case serves parents looking for educational value in recreational settings, blending amusement with intellectual stimulation in a highly interactive format.
- Birthday Parties and Event Hosting as Revenue Drivers: Many kids recreation centers generate significant revenue from themed birthday parties, holiday events, and private group bookings. Venues like Pump It Up, Chuck E. Cheese, and Urban Air Adventure Park offer customizable party packages that include activities, decorations, entertainment, and food. These services provide a hassle-free celebration experience for parents while offering children a fun, memorable event. This use case demonstrates the commercial potential of integrating entertainment services with hospitality, encouraging repeat visits and brand loyalty through personal milestones and seasonal festivities.
Impact of Artificial Intelligence on Kids' Recreational Services Market
- Artificial Intelligence (AI) is reshaping the kids’ recreational services market by enhancing personalization, safety, engagement, and operational efficiency. From smart play zones to AI-driven learning companions, AI technologies are driving a new wave of innovation in how children interact, learn, and play. As parents seek more intelligent, adaptive, and secure environments for their children, service providers are integrating AI to create highly immersive and development-focused recreational experiences.
- One of the most visible impacts of AI is in personalized learning and edutainment zones. AI-powered educational platforms embedded in recreational centers can assess a child’s interests, strengths, and progress, delivering tailored activities that boost cognitive development through gamified experiences. Centers like LEGO Discovery and Toca Boca-style digital labs are already leveraging AI to offer adaptive puzzles, language learning, and STEM-based simulations. AI also powers robotic play companions and interactive storytelling systems that respond in real time to children's inputs, enhancing emotional engagement and active learning.
- From a safety and monitoring perspective, AI plays a critical role in real-time child tracking, facial recognition check-ins, and anomaly detection in play areas. These applications ensure a secure environment while reducing the staffing burden on operators. AI-enabled cameras and sensors can also track activity patterns, helping staff ensure that children are engaging in physically and socially balanced ways, and identifying if a child is inactive, isolated, or potentially distressed.
- Additionally, AI optimizes business operations for recreational service providers. Predictive analytics help plan high-traffic hours, manage staffing, personalize marketing campaigns for parents, and analyze customer feedback for service improvements. Automated booking systems, virtual assistants for parents, and AI chatbots contribute to seamless customer experience, allowing recreational centers to focus more on innovation in content and activity design.
- In conclusion, AI is not just a technological enhancement but a strategic enabler in the kids’ recreational services market. It aligns with the growing demand for intelligent, engaging, and safe play environments, positioning early adopters for long-term success in a highly competitive landscape. As the integration of AI becomes more accessible, its role will expand from backend optimization to the very core of child-centric recreational experiences.
Global Kids Recreational Services Market: Stats & Facts
Centers for Disease Control and Prevention (CDC)
- 61.1% of U.S. children aged 12–17 engaged in at least 60 minutes of physical activity most days between July 2021 and December 2023.
- Less than half of children aged 6–11 meet the recommended 60 minutes of moderate-to-vigorous physical activity daily.
- Playground renovations with enhanced amenities are associated with a 28% increase in moderate-to-vigorous physical activity.
- Renovated playgrounds saw a rise in energy expenditure of 0.51 kcal/kg/min per higher general amenity score.
National Center for Health Statistics (NCHS, CDC)
- Adolescents with screen time of 2 hours or less per day had a 70.4% activity adherence rate versus 54.4% among those with 4 or more hours.
- 61.1% of adolescents met the guideline of 60 minutes of daily activity on most days.
U.S. Census Bureau
- 57% of children aged 6–17 participated in at least one extracurricular activity.
- Sports were the most common activity (35%), followed by clubs and lessons (~29%).
- Boys were more likely to join sports teams (44%) than girls (35%).
- Girls had higher participation in clubs (29%) compared to boys (24%).
- Music, dance, and language lessons were taken by 37% of girls and 27% of boys.
U.S. Bureau of Labor Statistics (BLS)
- Individuals aged 15–24 spent an average of 0.54 hours daily on sports, exercise, or recreation.
- Adults living with children under age 6 spent an average of 2.5 hours per day on primary childcare, while those with kids aged 6–17 spent around 50 minutes.
- Adults providing secondary childcare for children under 13 spent approximately 5.2 hours per day.
- Healthy People 2030 (Office of Disease Prevention and Health Promotion)
- Only 23.6% of children aged 6–13 met the aerobic physical activity target in 2020–2021; the national goal is 30.4%.
U.S. Consumer Product Safety Commission (CPSC)
- Over 200,000 children aged 14 or younger are treated annually in U.S. emergency rooms for playground-related injuries.
- Falls are the leading cause of these injuries (44%), followed by equipment-related issues (23%).
White House Report on Youth Sports (Archived)
- Among children aged 5–7, 37% of boys and 27% of girls participated in sports.
- Girls aged 11–15 had an 8 to 20 percentage point lower sports participation rate compared to boys of the same age group.
Global Kids Recreational Services Market: Market Dynamics
Global Kids Recreational Services Market: Driving Factors
Rising Parental Focus on Holistic Child Development
Modern parents are prioritizing their children's emotional, physical, and cognitive growth, leading to a higher demand for structured recreational activities. Services that promote teamwork, creativity, physical fitness, and problem-solving, such as STEM workshops, dance classes, and sensory play centers, are gaining popularity. This surge in demand is especially prominent among urban families who seek high-quality child enrichment alternatives outside of school.
Expansion of Urban Infrastructure and Indoor Activity Zones
Rapid urbanization and limited access to safe outdoor spaces have driven the growth of indoor recreational centers. These spaces, such as trampoline parks and soft play areas, offer climate-controlled environments, safety assurance, and convenience, making them a go-to solution for working parents. This infrastructural growth fuels steady revenue generation for operators and boosts the visibility of branded play centers in metropolitan areas.
Global Kids Recreational Services Market: Restraints
High Operating Costs and Safety Compliance
Running a kids recreational facility involves significant overheads, including rent, staff salaries, liability insurance, safety certifications, and regular equipment maintenance. Maintaining safety standards for child engagement zones can be costly and time-consuming, especially in regions with strict regulatory norms. These financial and legal challenges often limit the scalability of smaller or independent service providers.
Seasonality and Unpredictable Demand Fluctuations
Kids’ recreational services often face uneven footfall due to school calendars, seasonal holidays, and weather-related factors. For instance, outdoor amusement parks may see sharp drops in attendance during extreme weather, while indoor centers may struggle during school exam periods. This irregularity can affect revenue predictability and lead to operational inefficiencies.
Global Kids Recreational Services Market: Opportunities
Integration of Edutainment and Skill-Based Programs
There is growing market potential in combining fun with learning through edutainment models that include robotics, coding, music, and storytelling. Providers offering experiential learning experiences that support academic readiness and soft skills are gaining a competitive edge. This shift creates lucrative opportunities for centers to partner with educational institutions and offer curriculum-aligned enrichment services.
Market Penetration in Tier 2 and Tier 3 Cities
While urban hubs are saturated, smaller cities present untapped opportunities for expansion. Rising disposable income, changing parenting patterns, and growing awareness about child development in semi-urban regions are opening doors for mid-sized indoor play chains and mobile recreational services. These markets are ripe for affordable, modular, and community-based recreational solutions.
Global Kids Recreational Services Market: Trends
Rise of Tech-Integrated Play Experiences
Digital innovations like augmented reality (AR), interactive gaming, AI-based learning stations, and smart wearables are transforming the traditional play ecosystem. Modern centers are integrating these technologies to engage tech-savvy kids while promoting cognitive and physical development. Digital play tools are becoming a key differentiator for high-end recreational facilities aiming to attract repeat visitors.
Emphasis on Inclusivity and Special Needs Recreation
Inclusive recreational programs that cater to children with autism, ADHD, or physical disabilities are gaining traction. Specialized sensory play areas, therapeutic recreational services, and staff trained in special education are becoming integral parts of progressive recreational centers. This trend aligns with the growing social emphasis on accessibility, diversity, and emotional well-being.
Global Kids Recreational Services Market: Research Scope and Analysis
By Service Type Analysis
Indoor recreational services are projected to lead the service type segment within the global kids recreational services market, capturing an estimated 41.0% of the total market share in 2025. This dominance can be attributed to the growing preference among parents for controlled, weather-independent environments that ensure both safety and consistent access for children. Indoor centers such as trampoline parks, soft play zones, edutainment facilities, and interactive museums offer a wide range of structured and supervised activities that support physical activity, creativity, and social interaction.
The popularity of these facilities is especially strong in urban areas where outdoor space is limited, and working parents value the convenience of nearby, well-maintained indoor play options. Moreover, technological integration in indoor environments, including digital games, interactive storytelling stations, and AI-powered learning experiences, has further enhanced the appeal of these centers, making them a staple in modern child enrichment ecosystems.
On the other hand, outdoor recreational services continue to hold significant value in the market, offering children unique opportunities for physical exploration, nature-based play, and unstructured social engagement. These services include amusement parks, adventure playgrounds, sports fields, water parks, and seasonal activity camps. While slightly behind indoor centers in terms of market share, outdoor recreational offerings remain essential for promoting physical health, resilience, and environmental awareness in children.
In regions with favorable climates and strong tourism-driven footfall, such as North America, Europe, and parts of the Asia-Pacific, outdoor kids' activities contribute greatly to community development and family entertainment. Additionally, public and private investments in upgrading outdoor play infrastructure and incorporating safety features have renewed interest in outdoor play experiences, especially as a balance to growing screen time and indoor lifestyles.
By Age Group Analysis
The 9–12 years age group, commonly referred to as pre-teens, is expected to dominate the age group segment in the global kids recreational services market, accounting for approximately 43.0% of the total market share in 2025. This dominance is primarily driven by the increased demand for structured, skill-building activities and more intellectually stimulating recreational options suitable for older children.
At this stage, children begin to develop stronger cognitive abilities, social awareness, and independent interests, which makes them more inclined toward activities such as STEM workshops, coding boot camps, advanced sports training, and performance arts.
Recreational centers targeting this age group often offer specialized programs that go beyond basic play, focusing on critical thinking, teamwork, leadership, and creativity. Additionally, parents are more willing to invest in premium services for pre-teens, seeing them as a way to enhance their child’s academic readiness and personal growth.
The 6–8 years age group, categorized as early childhood, also holds a significant share in the market as children in this bracket are in a highly active phase of development where imagination, energy, and curiosity peak. Recreational services for this group typically include creative arts, beginner sports, interactive storytelling, and sensory-based learning programs.
This age is ideal for introducing structured recreational experiences in a playful yet educational format, which is why edutainment centers, introductory robotics classes, and soft skill workshops are particularly popular. While not as dominant as the pre-teen segment, early childhood remains a vital demographic for service providers, especially in indoor play zones and activity clubs. Programs tailored for this group often focus on enhancing motor skills, basic social interaction, and creative expression, making it a key growth area within the broader recreational ecosystem.
By Activity Type Analysis
Play and fun activities are expected to continue their dominance in the activity type segment of the global kids' recreational services market, with a projected market share of 28.0% in 2025. This strong position stems from the universal appeal of unstructured, enjoyment-focused experiences that allow children to explore freely, socialize, and engage in physical play.
Facilities offering soft play zones, ball pits, trampoline parks, obstacle courses, and themed indoor playgrounds attract high footfall due to their emphasis on entertainment and movement.
These activities not only provide enjoyment but also contribute to the development of motor skills, coordination, and emotional expression, especially in younger age groups. The convenience and accessibility of such play experiences for parents further drive their popularity, particularly in urban environments where safe outdoor spaces are limited.
In contrast, the learning and development segment, while slightly smaller in share, is gaining momentum as a complementary pillar of recreational services. This category includes activities that combine fun with cognitive and educational growth, such as STEM labs, language learning clubs, music and arts programs, and hands-on science workshops. Parents seek enrichment programs that support school readiness and intellectual stimulation, especially for children aged six and above.
Recreational centers focusing on learning and development offer structured modules that promote problem-solving, creativity, critical thinking, and emotional intelligence. While these programs may require more investment and commitment than casual play, they are seen as valuable tools for early academic preparation and personal growth, contributing to the segment’s steady expansion within the overall market landscape.
By Ownership Model Analysis
Independent local operators are expected to lead the ownership model segment in the global kids recreational services market, accounting for approximately 45.0% of the market share in 2025. This dominance is largely driven by the flexibility, adaptability, and localized approach these operators bring to their offerings.
Independent centers often tailor their services to meet the specific cultural, community, and age-related needs of children in their immediate surroundings. These operators typically have a stronger emotional connection with the local customer base and can quickly adapt programming based on seasonal demand, parental feedback, or emerging trends.
Additionally, lower initial capital requirements and the ability to scale at a manageable pace make this model attractive for small business owners, particularly in semi-urban and suburban regions. Their presence often fills the service gaps left by larger chains, especially in regions where customized recreational experiences are preferred over standardized formats.
Franchise-based models, while slightly behind in market share, continue to hold a significant and growing position in the segment. Well-known brands like Chuck E. Cheese, The Little Gym, and Urban Air Adventure Park operate on franchise systems that provide consistency, brand recognition, and proven business models. These franchises offer structured operational support, marketing resources, and training, which help entrepreneurs enter the market with lower risks and faster scalability.
Their appeal lies in offering trusted, high-quality experiences that parents recognize and feel confident about. However, due to higher upfront investments, franchise fees, and standardization requirements, such models may have less flexibility to localize offerings compared to independent operators. Still, as demand for premium and tech-enhanced recreational experiences increases, franchise-based models are expected to grow steadily, particularly in tier-1 cities and international markets.
By Booking Mode Analysis
Offline booking mode is projected to dominate the booking mode segment in the global kids recreational services market, accounting for approximately 52.0% of the total market share in 2025. This continued preference for offline bookings can be attributed to the nature of the services, which often involve trust-based, in-person interactions between parents and recreational centers.
Many parents still prefer visiting a facility before enrolling their child to assess safety, cleanliness, staff interaction, and the overall environment. Walk-in registrations, phone bookings, and on-the-spot party arrangements remain popular, especially in smaller cities and among traditional service providers. Moreover, for spontaneous visits to play zones or quick sign-ups for group classes, offline booking remains more convenient for families who are not highly reliant on digital platforms.
Online booking, while slightly behind, is steadily gaining ground and reshaping how parents interact with recreational service providers. The growth of digital literacy, mobile app adoption, and integrated booking systems has made it easier for parents to browse schedules, compare offerings, and secure slots without physical visits. Platforms offering online payment, virtual tours, and real-time availability are particularly appealing to tech-savvy urban families who value convenience and transparency.
In addition, online booking systems enable service providers to send automated reminders, collect feedback, and offer personalized promotions. As more recreational centers adopt digital solutions and younger parents continue to prioritize seamless user experiences, the online booking segment is expected to witness consistent growth, especially in tier-1 cities and developed markets.
The Kids Recreational Services Market Report is segmented based on the following:
By Service Type
- Indoor Recreational Services
- Outdoor Recreational Services
- Educational & Creative Workshops
- Fitness & Sports Programs
By Age Group
- 3-5 years (Toddlers)
- 6-8 years (Early Childhood)
- 9-12 years (Pre-teens)
By Activity Type
- Play & Fun Activities
- Learning & Development
- Fitness & Wellness
- Adventure & Outdoor Sports
- Events & Birthday Parties
- Creative Arts & Performance
By Ownership Model
- Independent Local Operators
- Franchise-based Models
- Public/Government Facilities
- Educational Institution Tie-ins
By Booking Mode
Global Kids Recreational Services Market: Regional Analysis
Region with the Largest Revenue Share
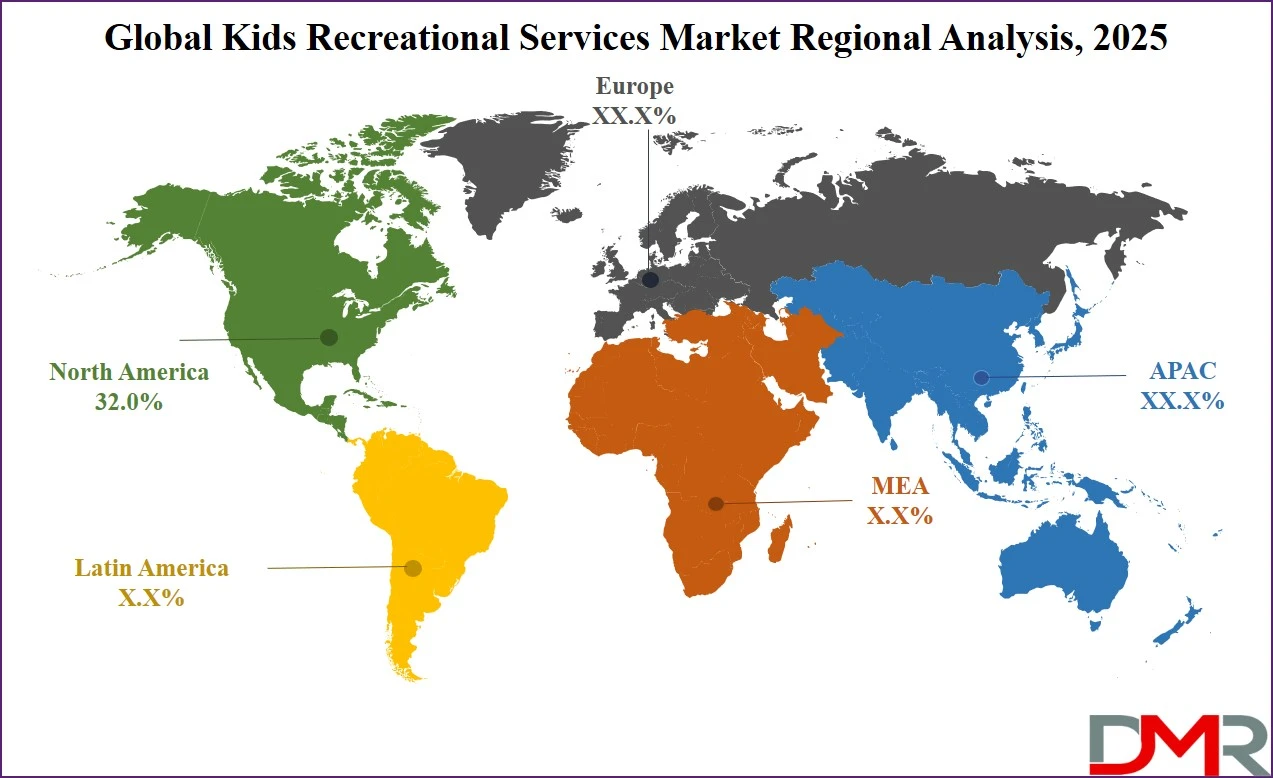
North America is expected to lead the global kids' recreational services market in 2025, contributing approximately 32.0% of the total market revenue. This leadership is driven by the region's well-established infrastructure for child-focused recreational activities, high disposable income, and strong cultural emphasis on extracurricular engagement.
The presence of major players like Chuck E. Cheese, Urban Air, and The Little Gym, along with widespread adoption of edutainment, indoor play zones, and skill-based learning centers, has solidified North America's dominance. Additionally, growing awareness about child development, demand for safe and structured after-school programs, and rapid integration of technology into recreational formats further support the region's strong market position.
Region with significant growth
The Asia-Pacific region is poised to witness the most significant growth in the global kids recreational services market over the forecast period. Rapid urbanization, a growing middle-class population, and growing disposable income in countries like China, India, Indonesia, and Vietnam are driving demand for structured recreational experiences for children.
Parents in these emerging economies are becoming more aware of the importance of child enrichment and are investing in indoor play centers, STEM-based learning programs, and after-school activities.
Additionally, the expansion of international franchise brands, integrated with the rise of local operators offering affordable, culturally relevant services, is fueling rapid market penetration. The region's tech-savvy demographic and rising interest in edutainment and experiential learning further position Asia-Pacific as a key growth hotspot in the years to come.
By Region
North America
Europe
- Germany
- The U.K.
- France
- Italy
- Russia
- Spain
- Benelux
- Nordic
- Rest of Europe
Asia-Pacific
- China
- Japan
- South Korea
- India
- ANZ
- ASEAN
- Rest of Asia-Pacific
Latin America
- Brazil
- Mexico
- Argentina
- Colombia
- Rest of Latin America
Middle East & Africa
- Saudi Arabia
- UAE
- South Africa
- Israel
- Egypt
- Rest of MEA
Global Kids Recreational Services Market: Competitive Landscape
The global competitive landscape of the kids recreational services market is characterized by a mix of established international brands, regional franchises, and independent local operators, each contributing to a diverse and fragmented industry. Leading players such as KidZania, Chuck E. Cheese, The Little Gym, Urban Air Adventure Park, and LEGO Group dominate the structured and franchise-based segment with standardized offerings, strong brand recall, and expansive footprints across multiple countries.
These companies continue to innovate by integrating digital learning tools, themed experiences, and technology-driven play formats to attract modern parents and tech-savvy children. At the same time, numerous independent operators and regional brands thrive by offering hyper-localized services, personalized programming, and flexible pricing structures, especially in emerging markets.
Strategic partnerships, franchising models, and acquisitions are common tactics used to expand reach and consolidate market share. As the industry grows more competitive, differentiation through service quality, safety standards, educational value, and digital convenience is becoming essential for long-term success.
Some of the prominent players in the global kids' recreational services market are:
- KidZania
- Chuck E. Cheese
- LEGO Group
- Walt Disney Parks and Resorts
- Gymboree Play & Music
- My Gym
- Sky Zone Trampoline Park
- Monkey Joe’s
- The Little Gym
- Urban Air Adventure Park
- BounceU
- Discovery Cube
- Play City
- Wonderwild
- Kids Empire
- Pump It Up
- Toca Boca
- Safari Kid
- Fun City
- Kidville
- Other Key Players
Global Kids Recreational Services Market: Recent Developments
Product Launches
- May 2025: Chuck E. Cheese launched the CEC Media Network, a digital out-of-home entertainment platform featuring over 3,000 screens across 500+ locations to enhance family-friendly in-venue engagement.
- November 2024: Chuck E. Cheese introduced Adventure Zones, a new attraction blending trampoline areas and Ninja Run obstacle courses, with a national rollout planned throughout 2025.
Funding & Investment
- June 2024: Singapore-based child-safety tech platform k-ID, which supports compliant digital environments for kids’ online games and play spaces, secured USD 45 million in Series A funding led by Andreessen Horowitz and Lightspeed.
- February 2024: India-based Push Sports, a startup offering children’s sports training and recreational infrastructure, received investment from Shark Tank India investors Vineeta Singh and Peyush Bansal to expand its urban footprint.
Report Details
| Report Characteristics |
| Market Size (2025) |
USD 48.8 Bn |
| Forecast Value (2034) |
USD 95.9 Bn |
| CAGR (2025–2034) |
7.8% |
| Historical Data |
2019 – 2024 |
| The US Market Size (2025) |
USD 13.1 Bn |
| Forecast Data |
2025 – 2033 |
| Base Year |
2024 |
| Estimate Year |
2025 |
| Report Coverage |
Market Revenue Estimation, Market Dynamics, Competitive Landscape, Growth Factors, etc. |
| Segments Covered |
By Service Type (Indoor Recreational Services, Outdoor Recreational Services, Educational & Creative Workshops, Fitness & Sports Programs), By Age Group (3–5 years – Toddlers, 6–8 years – Early Childhood, 9–12 years – Pre-teens), By Activity Type (Play & Fun Activities, Learning & Development, Fitness & Wellness, Adventure & Outdoor Sports, Events & Birthday Parties, Creative Arts & Performance), By Ownership Model (Independent Local Operators, Franchise-based Models, Public/Government Facilities, Educational Institution Tie-ins), and By Booking Mode (Offline, Online) |
| Regional Coverage |
North America – US, Canada; Europe – Germany, UK, France, Russia, Spain, Italy, Benelux, Nordic, Rest of Europe; Asia-Pacific – China, Japan, South Korea, India, ANZ, ASEAN, Rest of APAC; Latin America – Brazil, Mexico, Argentina, Colombia, Rest of Latin America; Middle East & Africa – Saudi Arabia, UAE, South Africa, Turkey, Egypt, Israel, Rest of MEA |
| Prominent Players |
KidZania, Chuck E. Cheese, LEGO Group, Walt Disney Parks, Gymboree, My Gym, Sky Zone, Monkey Joe’s, The Little Gym, Urban Air, BounceU, Discovery Cube, Play City, Wonderwild, Kids Empire, Pump It Up, Toca Boca, Safari Kid, and Others. |
| Purchase Options |
We have three licenses to opt for: Single User License (Limited to 1 user), Multi-User License (Up to 5 Users), and Corporate Use License (Unlimited User) along with free report customization equivalent to 0 analyst working days, 3 analysts working days, and 5 analysts working days respectively. |
Frequently Asked Questions
The global kids recreational services market size is estimated to have a value of USD 48.8 billion in 2025 and is expected to reach USD 95.9 billion by the end of 2034.
The US kids recreational services market is projected to be valued at USD 13.1 billion in 2025. It is expected to witness subsequent growth in the upcoming period as it holds USD 24.8 billion in 2034 at a CAGR of 7.3%.
North America is expected to have the largest market share in the global kids recreational services market, with a share of about 32.0% in 2025.
Some of the major key players in the global kids recreational services market are KidZania, Chuck E. Cheese, LEGO Group, Walt Disney Parks, Gymboree, My Gym, Sky Zone, Monkey Joe’s, The Little Gym, Urban Air, BounceU, Discovery Cube, Play City, Wonderwild, Kids Empire, Pump It Up, Toca Boca, Safari Kid, and Others.
The market is growing at a CAGR of 7.8 percent over the forecasted period.