Market Overview
The global observability tools and platforms market covers software and managed services that collect, correlate, and analyze telemetry signals across distributed digital infrastructure. Telemetry signals include metrics, logs, traces, events, and continuous profiles. The market excludes standalone network monitoring products with no application-layer visibility and basic infrastructure alerting tools that lack multi-signal correlation. Vendors in Observability Tools Market compete on ingestion scale, signal fidelity, query speed, and the depth of AI-assisted root-cause analysis.
Cloud-native architecture has made operational visibility a prerequisite for revenue protection, not a discretionary IT investment. Kubernetes orchestration, microservices decomposition, and serverless compute produce ephemeral workloads that legacy monitoring tools cannot track. Enterprises managing digital customer journeys now treat application latency, availability, and user-experience telemetry as board-level metrics. Observability platforms sit at the intersection of engineering reliability and business continuity, which explains why budget allocation for these tools has outpaced broader IT spending for three consecutive years.
The Observability Tools & Platforms Market connects directly to the wider AIOps, cloud management, and DevSecOps ecosystems. Platform vendors are absorbing adjacent capabilities including incident management, feature-flag control, A/B testing, and FinOps correlation into unified observability surfaces. Buyers across BFSI, healthcare, and manufacturing are replacing point monitoring tools with full-stack platforms that cover application, infrastructure, and business telemetry in a single pane of glass.
Key Takeaways
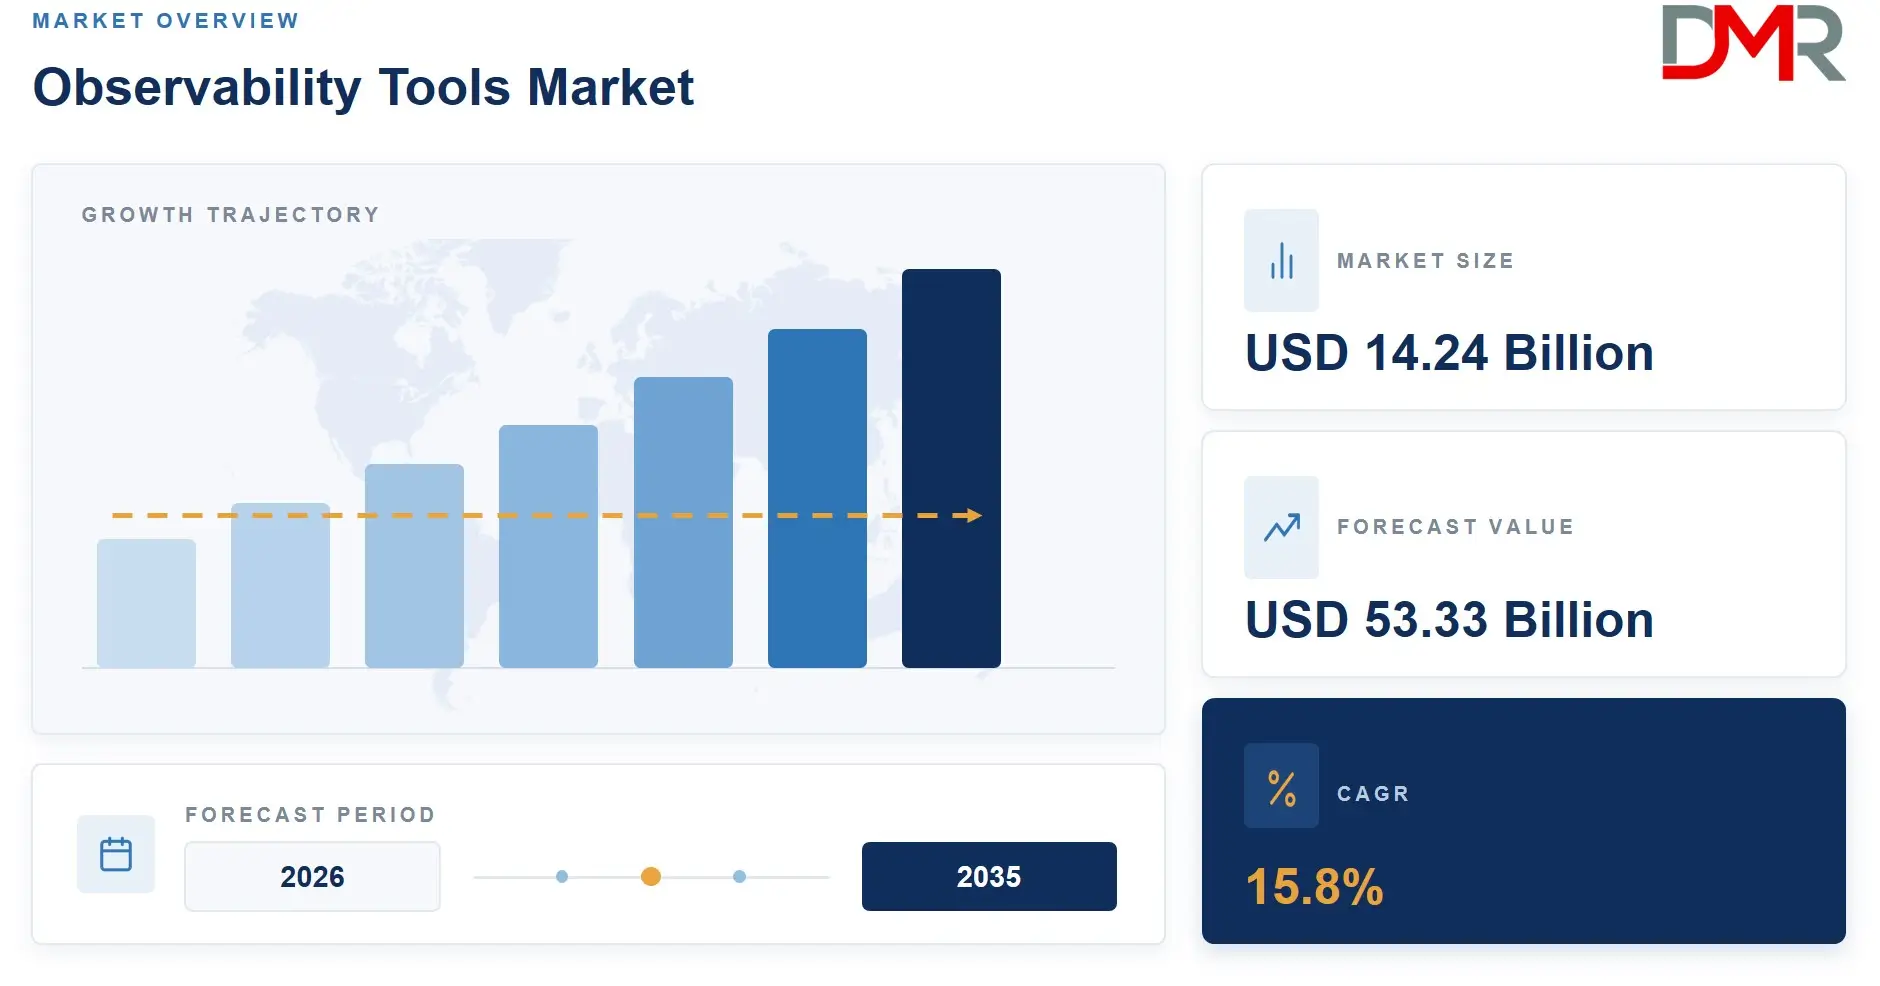
- The market size is USD 14.24 Billion in 2026, and is projected to hit USD 53.33 Billion by 2035 at a CAGR of 15.8%.
- By Offering: Solutions led as the largest category in 2026, while Services recorded the highest CAGR at 17.8%.
- By Solution: Application Performance Monitoring led as the largest category in 2026, while Distributed Tracing recorded the highest CAGR at 18.3%.
- By Service: Managed Services led as the largest category in 2026.
- By Telemetry Type: Metrics led as the largest category in 2026, while Others (Traces, Events & Profiles) recorded the highest CAGR at 13.8%.
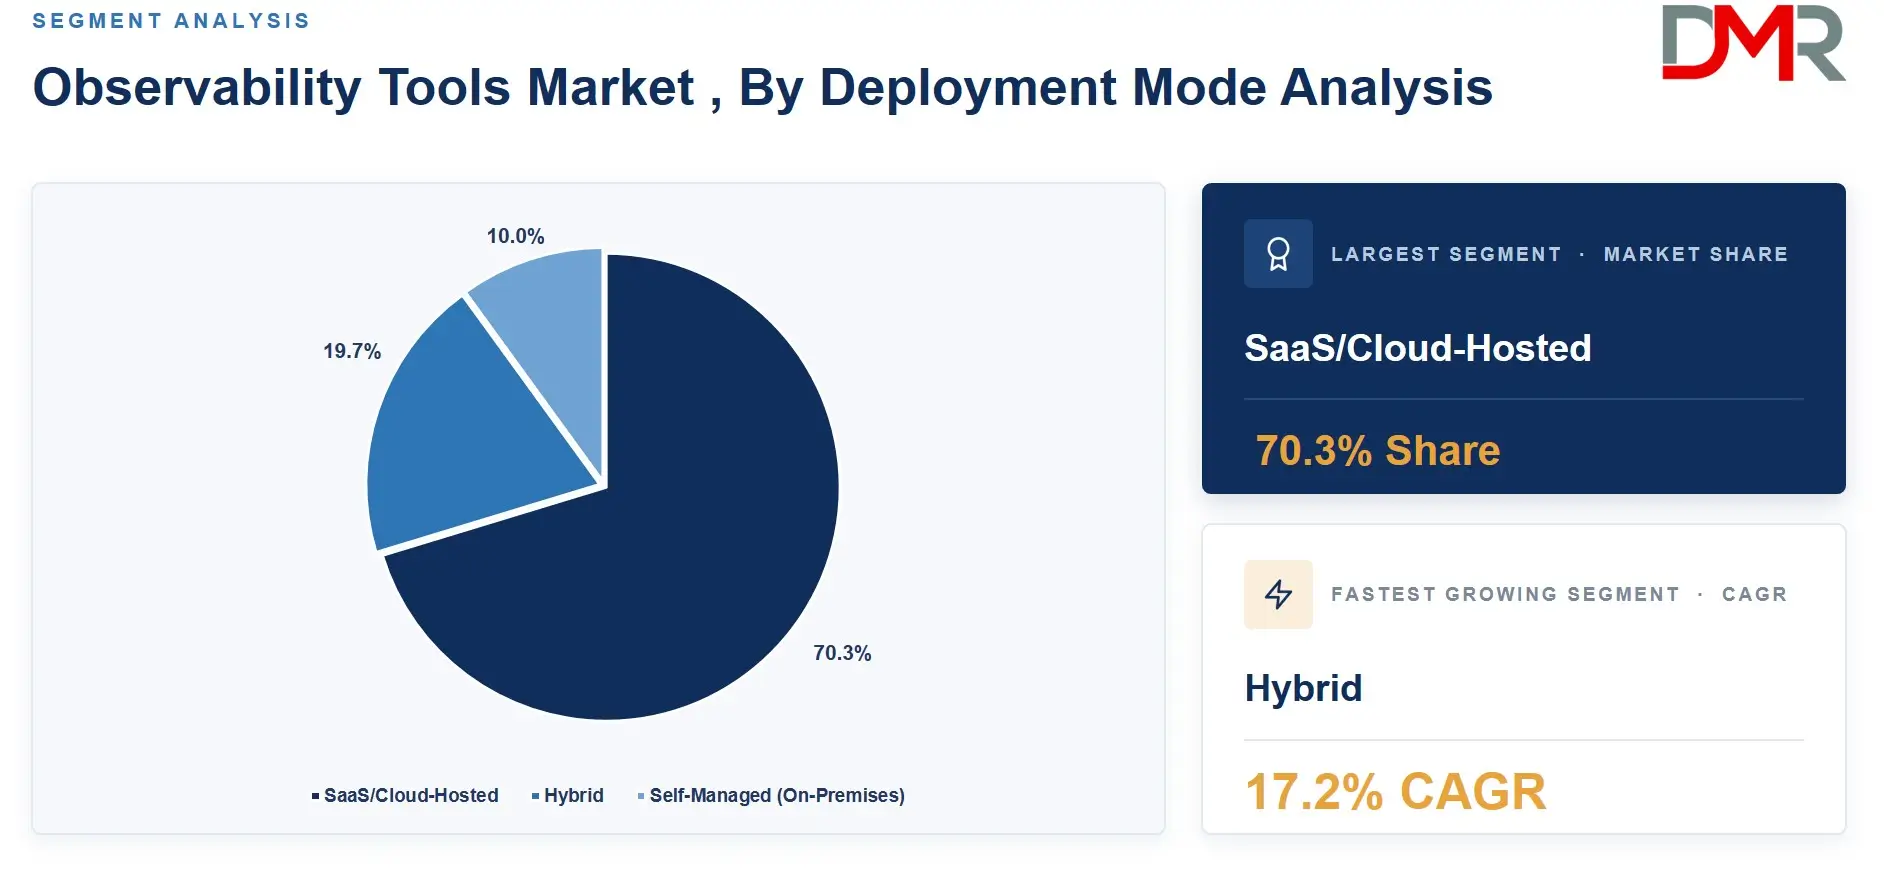
- By Deployment Mode: SaaS/Cloud-Hosted led with a 70.3% share in 2026.
- By Organization Size: Large Enterprises led as the largest category in 2026, while SMEs recorded the highest CAGR.
- By Vertical: BFSI led with a 20.3% share in 2026, while Manufacturing recorded the highest CAGR.
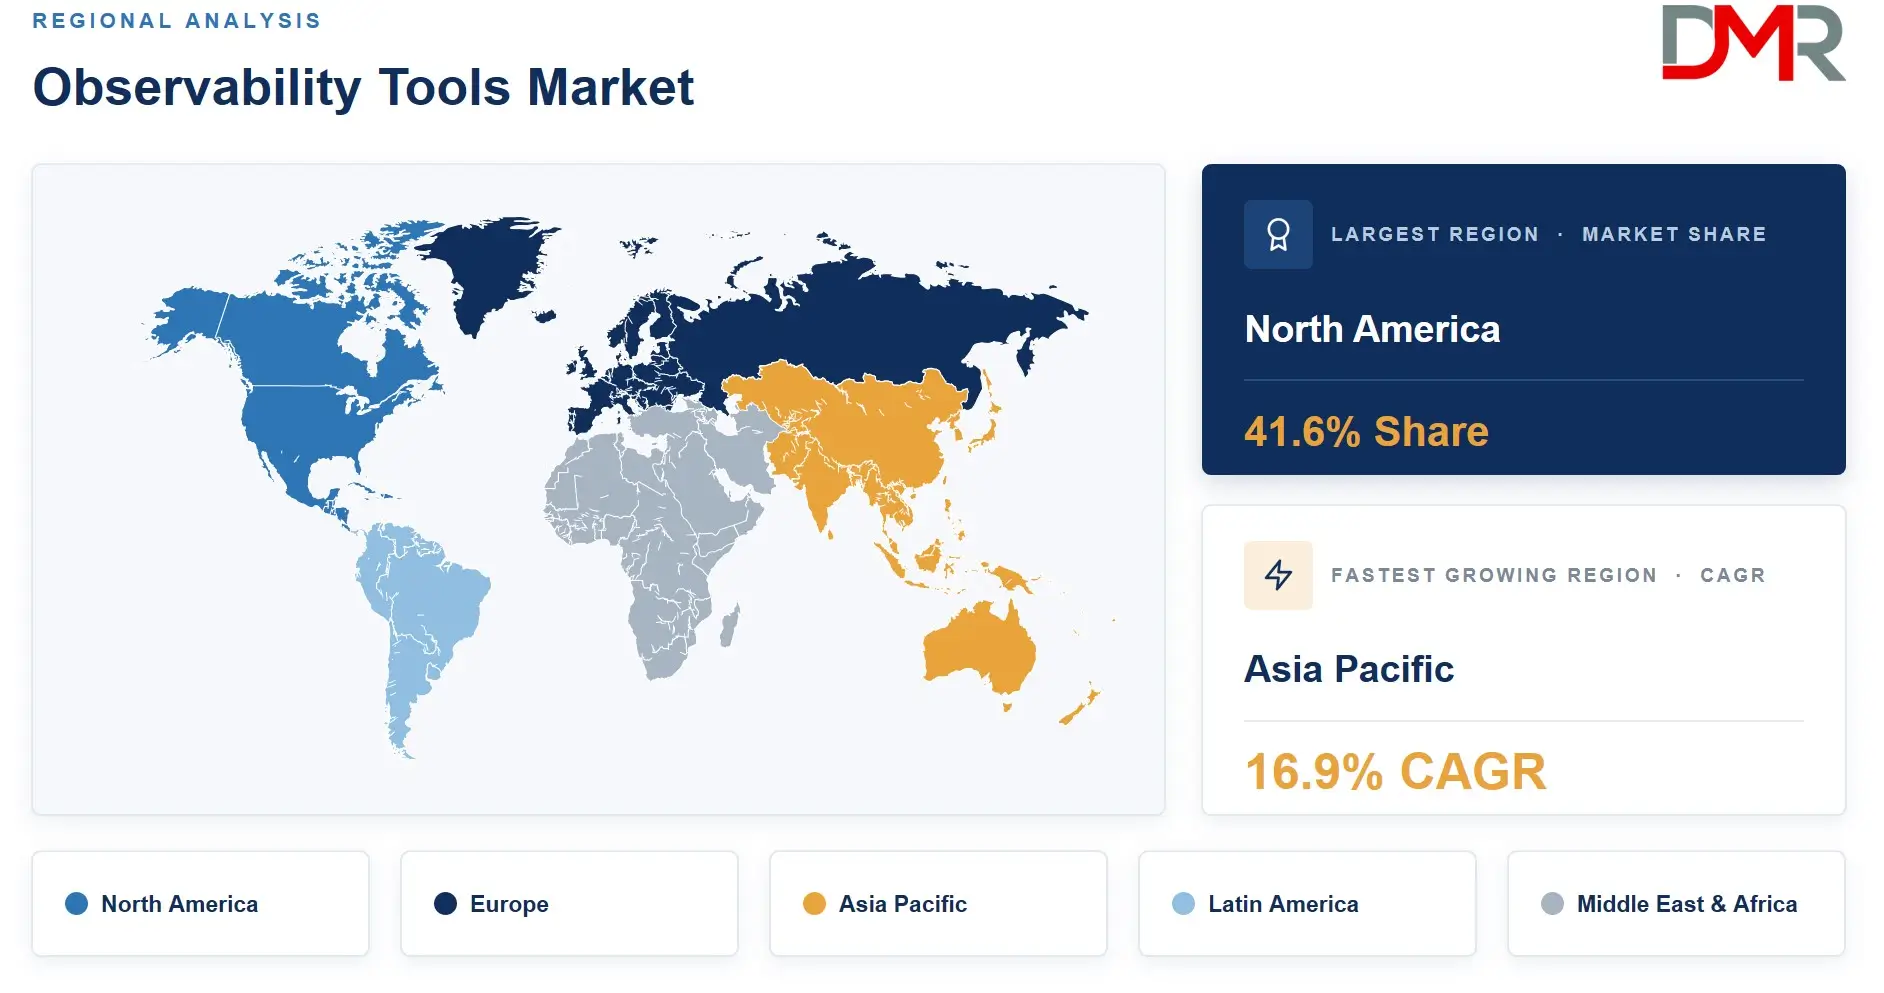
- By Region: North America led with a 41.6% share, valued at USD 5.92 Billion, in 2026.
- Asia Pacific is the fastest-growing region, driven by cloud adoption across manufacturing and financial services sectors.
Market Size and Forecast
The Global Observability Tools & Platforms Market size is estimated at USD 14.24 Billion in 2026, and is projected to reach USD 53.33 Billion by 2035, exhibiting a CAGR of 15.8% during the forecast period.
Historical growth between 2020 and 2024 was anchored by enterprise migration to cloud-native architectures and the organizational adoption of site reliability engineering practices. Each wave of microservices adoption created a new instrumentation requirement. Vendors responded with consumption-based pricing models that lowered initial adoption barriers while accelerating platform expansion within accounts. As reported by New Relic, 75% of organizations achieved a positive return from observability investments, 18% reported returns of 3 to 10 times their investment, and 68% measured improvements in mean time to detection after adopting observability. These return figures validate enterprise willingness to expand platform spend through the forecast window.
The 2026–2035 forecast rests on two structural assumptions. AI-native investigation capabilities will shift observability from a cost-of-operations line item into a revenue-protection asset, increasing buyer willingness to pay for premium tiers. Parallel growth in regulated verticals including payments, healthcare, and industrial systems will pull verticalized observability packages into procurement cycles that legacy generic platforms cannot fully address.
ℹ
To learn more about this report –
Download Your Free Sample Report Here
Offering Analysis
Solutions led the Offering segment as the largest category in 2026.
Platform software captures the majority of observability spend because buyers prioritize data ownership, integration depth, and query flexibility over service delivery hours. Enterprises running complex multi-cloud estates require software that correlates signals across hundreds of services in real time. Service providers cannot replicate that responsiveness at scale, which keeps solutions spending structurally higher than services spending.
Services recorded the highest CAGR at 17.8%, outpacing the overall market rate. Mid-market buyers lacking internal SRE expertise are contracting managed observability services to accelerate instrumentation maturity without hiring specialist staff. Professional services revenue is also growing as enterprises undergoing platform consolidation require migration, tuning, and architecture consulting that software licenses alone do not cover.
Solution Analysis
Application Performance Monitoring (APM) led the Solution segment as the largest category in 2026.
APM anchors enterprise observability spending because application latency and error rates map directly to revenue impact. Engineering and finance teams share APM dashboards in digital commerce, banking, and SaaS environments. No other solution category offers that cross-functional budget justification. APM deployments also serve as the entry point through which buyers later adopt distributed tracing, log analytics, and infrastructure observability from the same vendor.
Distributed Tracing is recording the highest CAGR at 18.3%, accelerating faster than any other solution category. Microservices architectures make end-to-end request tracing the only reliable method for isolating latency contributors across dozens of interdependent services. Log Management and Analytics retains strong adoption as compliance and audit requirements grow. AIOps and Incident Intelligence is gaining traction as vendors embed automated anomaly detection and alert correlation into core platforms. Infrastructure Observability and Other Solutions serve as complementary layers within full-stack platform deployments.
Service Analysis
Managed Services led the Service segment as the largest category in 2026.
Managed observability contracts transfer instrumentation, tuning, and platform operation to specialist providers. Buyers in healthcare, government, and mid-market IT choose managed services because talent scarcity in OpenTelemetry and distributed tracing disciplines makes building internal expertise prohibitively slow. Professional Services addresses discrete engagements including platform migrations, custom dashboard development, and SLO framework design. Demand for Professional Services accelerates when enterprises consolidate from three or four point tools onto a single full-stack platform.
Telemetry Type Analysis
Metrics accounted for the highest share of Telemetry Type demand in 2026, the largest of any category.
Metrics remain the default telemetry signal because they are low-cost to generate, well-understood by operations teams, and compatible with decades of existing monitoring tooling. Time-series databases built for metrics are mature, scalable, and supported by an extensive open-source ecosystem. Prometheus dominance in Kubernetes environments reinforces metrics as the primary operational signal for containerized workloads.
Others (Traces, Events and Profiles) is recording the highest CAGR at 13.8%, reflecting rising demand for continuous profiling and distributed tracing in production environments. Logs maintain strong volume due to compliance mandates and error forensics requirements. As platforms unify all four signal types, buyers are shifting from siloed telemetry collection toward correlated full-stack pipelines.
Deployment Mode Analysis
SaaS/Cloud-Hosted captured 70.3% of the Deployment Mode segment in 2026, ahead of all rivals.
SaaS delivery commands the dominant position because it eliminates infrastructure management, accelerates time-to-value, and scales ingestion capacity instantly. Cloud-native enterprises building on AWS, Azure, and Google Cloud prefer SaaS observability that integrates directly with their cloud provider APIs. Vendors benefit from recurring subscription revenue and continuous telemetry access that accelerates AI model training across the customer base.
Hybrid deployment is growing among regulated enterprises that must retain sensitive telemetry on-premises while using cloud-hosted analytics. Self-managed on-premises installations persist in government and defense accounts with strict data sovereignty requirements. Elastic's 2026 research confirmed that 29% of organizations were actively moving observability workloads from cloud infrastructure back to on-premises systems, primarily to control unpredictable ingestion costs rather than for compliance reasons.
ℹ
To learn more about this report –
Download Your Free Sample Report Here
Organization Size Analysis
Large Enterprises led the Organization Size segment as the largest category in 2026.
Large enterprises drive the majority of observability spend because they operate the most complex digital estates. A global bank or logistics provider running thousands of microservices across multiple cloud regions generates telemetry volumes that only enterprise-grade platforms can ingest and query at acceptable latency. Budget authority, procurement infrastructure, and multi-year contract structures all favor large enterprise deals for platform vendors.
SMEs are recording the highest CAGR across organization size categories. SaaS delivery models and consumption-based pricing have lowered the financial barrier for smaller engineering teams. Managed service offerings further reduce the skills barrier. Vendors are packaging SME-focused tiers with simplified onboarding and preset dashboards to capture this segment before competitors establish account control.
Vertical Analysis
BFSI accounted for 20.3% of Vertical demand in 2026, the highest of any category.
Financial services firms operate zero-tolerance environments for application downtime and latency spikes. A payment processing failure measured in seconds translates to measurable transaction loss and regulatory exposure. BFSI buyers fund premium observability capabilities including full distributed tracing, real-time anomaly detection, and compliance-grade audit trails. Regulatory pressure to demonstrate operational resilience makes observability a non-discretionary spend category in banking and insurance.
Manufacturing is recording the highest CAGR across verticals as industrial operators connect factory-floor systems, supply chain platforms, and ERP environments into unified observability stacks. Healthcare and Life Sciences adoption is accelerating under electronic health record mandates and telehealth platform growth. IT and ITeS firms, Telecommunications operators, and Retail and eCommerce players collectively sustain broad baseline demand. Energy and Utilities, Government, Media and Entertainment, and Transportation and Logistics represent growing but still-developing segments for vendor expansion.
Key Market Segments
By Offering
- Solutions
- Application Performance Monitoring (APM)
- Distributed Tracing
- Log Management & Analytics
- AIOps & Incident Intelligence
- Infrastructure Observability
- Other Solutions
- Services
- Managed Services
- Professional Services
By Telemetry Type
- Metrics
- Logs
- Others – Traces, Events & Profiles
By Deployment Mode
- SaaS/Cloud-Hosted
- Hybrid
- Self-Managed (On-Premises)
By Organization Size
By Vertical
- BFSI
- IT & ITeS
- Telecommunications
- Healthcare & Life Sciences
- Manufacturing
- Retail & eCommerce
- Transportation & Logistics
- Media & Entertainment
- Energy & Utilities
- Government & Public Sector
- Others
Regional Analysis
North America led all regions with a 41.6% share, valued at USD 5.92 Billion, in 2026.
North America
North America holds structural advantages that no other region can replicate in the near term. The United States concentrates the highest density of cloud-native enterprises, SRE-mature engineering organizations, and observability platform vendors. Hyperscaler headquarters in the region create embedded demand for observability tools that integrate with AWS, Azure, and Google Cloud ecosystems. Enterprise procurement cycles in the US reward platform breadth and AI investigation capability, which aligns with the direction all major vendors are investing.
Asia Pacific
Asia Pacific is the fastest-growing region in the global observability market. China's domestic cloud buildout, India's expanding SaaS and IT services sector, and Southeast Asia's digital banking growth are each pulling observability adoption at rates that outpace the global average. Japanese manufacturers connecting Industry 4.0 systems require infrastructure and application telemetry correlation at factory scale. Regional cloud providers including Alibaba Cloud are building observability capabilities directly into platform services, accelerating adoption among customers who would otherwise delay standalone tool procurement.
ℹ
To learn more about this report –
Download Your Free Sample Report Here
Europe
European adoption is shaped by GDPR data residency requirements and the European Union's Digital Operational Resilience Act. Financial institutions in Germany, France, and the UK face regulatory mandates to demonstrate real-time operational visibility, which converts observability from a discretionary capability into a compliance necessity. Germany's manufacturing export orientation is also pulling observability into industrial operations faster than most analysts projected for this stage of market development.
Latin America
Brazil and Mexico anchor regional demand, driven by fintech platform growth and telecommunications network modernization. Observability adoption in Latin America is predominantly SaaS-delivered, as regional enterprises lack the infrastructure investment capacity to operate self-managed telemetry platforms at scale. Managed services spending is growing faster than solution licenses in this region.
Middle East & Africa
Gulf Cooperation Council nations are the primary demand center for the Middle East and Africa region. Government digital transformation programs in Saudi Arabia and the UAE are funding observability deployments across public sector applications and smart-city infrastructure. South Africa leads sub-Saharan adoption, particularly in financial services and telecommunications. Overall regional penetration remains low relative to market maturity, which positions MEA as a long-horizon growth opportunity for vendors willing to invest in local go-to-market infrastructure.
Key Regions and Countries
North America
Europe
- Germany
- France
- The UK
- Spain
- Italy
- Rest of Europe
Asia Pacific
- China
- Japan
- South Korea
- India
- Australia
- Rest of APAC
Latin America
- Brazil
- Mexico
- Rest of Latin America
Middle East & Africa
- GCC
- South Africa
- Rest of MEA
Macroeconomic Impact
Rising interest rates between 2022 and 2024 compressed IT discretionary budgets across mid-market enterprises but did not reduce observability spending, because platform failures carry direct revenue consequences that finance teams quantify. Observability tools proved more resistant to budget cuts than project-based software categories during the tightening cycle. Renewed GDP growth expectations across North America and Asia Pacific for 2026–2028 are now expanding the budget envelope for platform upgrades and new deployments.
Currency volatility creates pricing friction for vendors selling dollar-denominated SaaS contracts into emerging markets. European inflation has slowed software procurement cycles for smaller regional enterprises. Conversely, trade-policy pressure accelerating domestic cloud infrastructure investment in China and India is indirectly pulling observability tool adoption by creating new cloud environments that require monitoring from day one.
Market Dynamics
Driver: Cloud-Native Architecture Multiplying Telemetry Complexity Beyond Legacy Monitoring Limits
Kubernetes orchestration, microservices decomposition, and serverless functions create thousands of ephemeral dependencies that traditional infrastructure monitoring tools cannot track across their lifecycle. Each new service boundary generates a new failure domain requiring dedicated instrumentation. Enterprises running at this scale face outage risk that scales with architectural complexity, making observability platform investment a direct operational necessity rather than an IT preference.
Revenue impact quantifies the driver's urgency. As reported by New Relic, organizations with full-stack observability cut high-impact outage costs from an average of $2 million per hour to $1 million per hour, a 50% reduction, while also detecting outages 7 minutes faster with an average mean time to detection of 28 minutes. Separately, Splunk's 2025 research confirmed that observability leaders generated 125% annual ROI, 53% higher than organizations that had not reached observability maturity, and 78% of leaders credited code profiling with dramatically accelerating root-cause analysis. Numbers at this scale remove the business case debate entirely.
DevOps and SRE adoption reinforces the driver at the organizational level. Engineering teams operating under service-level objectives and error budget frameworks require continuous production diagnostics. Observability platforms are the operational backbone of SRE practice, and SRE headcount has grown across financial services, technology, and e-commerce in every major geography. As per Dynatrace's 2025 observability study, 75% of organizations are increasing their observability budgets, confirming that institutional commitment to the category is expanding, not plateauing.
Restraint: Unbounded Ingestion Costs and Talent Scarcity Slowing Platform Return on Investment
Usage-based pricing creates a structural cost trap. Log, metric, trace, and profile ingestion volumes grow faster than the engineering value extracted from them, producing unpredictable monthly bills that strain operating budgets. Data published by Elastic confirms that 97% of organizations have encountered unexpected observability costs, 67% experience them regularly, and 96% are actively taking measures to control costs. Fifty-one percent responded by consolidating tools, and 29% moved observability workloads from cloud infrastructure back to on-premises systems. Vendor pricing opacity is converting a capability investment into a financial liability for a majority of enterprise buyers.
Talent scarcity compounds the cost problem. OpenTelemetry instrumentation, distributed tracing configuration, and SRE framework design require specialist expertise that most engineering organizations lack. Delayed instrumentation maturity weakens platform return on investment and extends the period before buyers see the ROI numbers that justify contract expansion. Vendors who solve the skills gap through AI-assisted setup wizards, pre-built instrumentation libraries, and managed onboarding services will close deals faster than those who require buyers to self-provision expertise.
Opportunity: AI-Agent Observability and Verticalized Packages Opening Premium Pricing Tiers
AI agent infrastructure introduces a new class of observability requirement. Prompt lineage tracking, tool-call auditing, token consumption metering, model drift detection, and multi-agent execution failure capture require purpose-built platforms that generic APM tools cannot provide. Vendors shipping AI-agent observability capabilities in 2025 and 2026 are accessing enterprise AI operations budgets that sit outside traditional IT monitoring allocations, creating incremental revenue streams rather than displacing existing contracts.
Customer-owned telemetry lake architectures and observability-led FinOps solutions represent equally compelling revenue opportunities. Findings from Grafana Labs' 2026 survey confirm that 77% of respondents said centralized observability saved their organization time or money, with one reporting 30–50% lower tool-sprawl costs and another reporting monthly savings of $1,500–$2,000. Vendors who embed FinOps correlation that connects application performance directly to cloud resource waste can charge for business outcome metrics rather than data volume, which structurally improves their pricing power and reduces churn risk.
Porter's Five Forces
Competitive rivalry in the observability tools and platforms market is intense and accelerating as platform boundaries expand. Established vendors including Datadog, Dynatrace, and Elastic are absorbing capabilities from adjacent categories, compressing the differentiation space for single-function specialists. New entrants face high barriers from the engineering investment required to build multi-signal ingestion infrastructure at scale, the time needed to establish integrations with major cloud providers and CI/CD toolchains, and the institutional trust required to win production telemetry contracts at large enterprises.
Supplier power is moderate. OpenTelemetry's emergence as a vendor-neutral collection standard reduces buyer lock-in on instrumentation and weakens proprietary agent dependency, shifting leverage from vendors toward buyers. Buyer power is growing as procurement teams gain sophistication in benchmarking ingestion costs, querying performance, and AI investigation quality across competing platforms.
Procurement consolidation among large enterprise accounts is forcing vendors to compete on total cost of ownership rather than feature checklists alone. Substitutes present a meaningful but bounded threat. Open-source stacks combining Prometheus, Grafana, and OpenTelemetry provide a credible alternative for engineering-heavy organizations willing to accept operational overhead. Vendors who cannot demonstrate measurable ROI above open-source total cost of ownership risk losing cost-sensitive segments.
AI and Gen AI Impact
Generative AI is shifting observability from a passive telemetry repository into an active investigation and remediation engine. Natural-language query interfaces let non-specialist engineers ask questions across logs, metrics, and traces without writing structured queries. AI investigation assistants convert symptom descriptions into root-cause hypotheses with supporting evidence chains, compressing mean time to resolution from hours to minutes. Elastic's 2026 research found that 85% of organizations used some form of generative AI for observability, with 53% using standalone GenAI tools and 52% using capabilities built directly into observability platforms. Adoption at this breadth within a single survey year signals that GenAI observability is moving from early adopter experimentation to mainstream production deployment faster than most prior technology integrations in Observability Tools Market .
Early movers have embedded AI investigation into alert triage workflows, reducing alert fatigue and enabling smaller SRE teams to manage larger service portfolios. Laggards relying on manual query-and-dashboards workflows face rising operational cost per engineer and slower incident response times that directly affect service-level agreement compliance. Dynatrace's 2025 study confirmed that 69% of AI-powered operational decisions are still verified by humans, indicating that full autonomous remediation remains an emerging capability rather than a default workflow.
Market Trends
OpenTelemetry and eBPF Reshaping Instrumentation from Proprietary to Vendor-Neutral
OpenTelemetry standardization is redistributing instrumentation control away from proprietary agent ecosystems toward open collection pipelines. Grafana Labs' 2025 survey found that 67% of organizations used Prometheus in production and 41% used OpenTelemetry in production, with 34% running both in the same environment. eBPF-based auto-instrumentation extends code-free visibility across kernel, network, container, and application layers simultaneously. Unified platforms combining logs, metrics, traces, and continuous profiles are displacing disconnected point-monitoring tools across enterprise accounts, and generative AI investigation assistants are converting natural-language queries into cross-signal root-cause analysis at production scale.
Market Competition Overview
The observability tools and platforms market sits between fragmented and consolidating. A small number of full-stack platform vendors including Datadog, Dynatrace, Elastic, and Splunk hold disproportionate enterprise share by offering unified solutions that cover application, infrastructure, log, and trace telemetry in a single contract. Mid-tier vendors compete on pricing flexibility, open-source compatibility, and vertical specialization. Niche players addressing AI observability, cost intelligence, and telemetry pipeline management are entering from the edges of the market, often targeting the white-space segments that platform giants have not prioritized.
Open standards are the most consequential competitive force reshaping the landscape. CNCF reported in May 2026 that OpenTelemetry had surpassed 12,000 contributors from over 2,800 companies, with its JavaScript API package recording more than 1.36 billion downloads and its Python API package surpassing 1.3 billion downloads in the preceding 12 months. Vendor adoption of OpenTelemetry as a primary collection layer is dissolving the proprietary agent lock-in that historically protected incumbent account retention. Buyers now switch platforms with lower migration friction, which raises churn risk for vendors that compete solely on agent breadth rather than analytics depth and AI capability.
Pricing Analysis
Observability platform pricing operates predominantly on consumption-based models where buyers pay per volume of logs, metrics, traces, or hosts monitored. SaaS vendors tier pricing across data ingestion volume, retention period, and user seat count. Enterprise contracts frequently bundle multiple telemetry types at negotiated rates, but mid-market buyers on standard plans face sharp cost escalation as microservices proliferation drives ingestion growth above forecast volumes. Elastic's 2026 data showing 97% of organizations encountering unexpected costs confirms that consumption-model opacity is the dominant pricing pain point across the buyer base.
Market leaders use pricing architecture as a competitive differentiator. Some vendors separate ingest cost from query and storage cost to offer lower entry prices while monetizing heavy analytical workloads. Challengers are experimenting with flat-rate and telemetry-lake pricing models that decouple retention cost from query cost entirely. Buyers consolidating from multiple point tools onto a single platform can negotiate meaningful discounts by concentrating spend, which gives full-stack platform vendors a structural pricing advantage over single-function specialists.
Company Profiles
Datadog holds a leading position in the market through a platform strategy that continuously expands surface area across application performance, infrastructure, security, and now AI observability. Datadog reported that its observability integration ecosystem surpassed 1,000 integrations during 2025 after adding more than 110 new technology partners in that year alone. Each new integration extends account stickiness because customers who embed Datadog across cloud, CI/CD, and deployment pipelines face significant switching costs. Datadog's rapid product release cadence, including multiple GA launches in early 2026, reinforces its position as the default platform choice for engineering-led enterprises with complex multi-cloud estates.
Dynatrace differentiates on AI automation depth rather than integration breadth. Its Davis AI engine provides automated root-cause analysis and dependency mapping without manual query construction, targeting enterprise buyers who prioritize MTTD reduction over open-source flexibility. Dynatrace's focus on regulated verticals including financial services and healthcare builds a client base that values compliance-grade audit trails alongside performance monitoring. The vendor's strength in European enterprises, where DORA and GDPR compliance requirements are most stringent, creates a defensible regional position that pure US-centric competitors cannot easily replicate.
Key Players
- Datadog
- Dynatrace
- Elastic
- New Relic
- Splunk
- Alibaba Cloud
- Amazon Web Services
- Apica
- BMC Software
- Chronosphere
- Coralogix
- Grafana Labs
- Honeycomb
- Hewlett Packard Enterprise
- IBM
- LogicMonitor
- Microsoft
- ScienceLogic
- SolarWinds
- Oracle
- Sumo Logic
Supply Chain and Value Chain Analysis
The observability platform value chain begins with open-source and proprietary instrumentation agents that collect telemetry at the application and infrastructure layer. Data flows through collection pipelines into ingestion backends where normalization, indexing, and compression occur. Storage layers separate hot query data from cold retention archives, with cost separation between tiers becoming a competitive design priority. Analytics and AI engines process stored telemetry to produce alerts, dashboards, root-cause analysis, and business intelligence outputs. End users access outputs through web interfaces, APIs, and integrations with incident management and collaboration platforms.
Maximum value creation occurs in the analytics and AI layer, where raw telemetry transforms into operational decisions. Vendors who control both the collection standard and the analytics engine capture the widest margin. The biggest bottleneck sits at the ingestion and normalization stage, where multi-cloud heterogeneity and proprietary telemetry formats force expensive engineering work before data becomes queryable. OpenTelemetry standardization is progressively reducing this bottleneck, but incompletely, because schema coverage varies across instrumentation libraries and cloud services.
Regulatory Landscape
The European Union's Digital Operational Resilience Act requires financial entities to demonstrate continuous ICT operational monitoring, which mandates real-time observability of critical applications and infrastructure. Compliance deadlines in 2025 created a procurement wave among European banks and insurers selecting observability platforms with audit-grade telemetry retention. The EU AI Act introduces explainability requirements for AI-assisted operational decisions, which affects observability vendors embedding automated remediation capabilities in European deployments.
HIPAA and HITECH in the United States impose data handling requirements on observability telemetry that touches patient health information, creating deployment constraints for healthcare operators using SaaS-delivered platforms. FedRAMP authorization requirements restrict federal agency observability procurement to a narrow set of certified vendors. PCI-DSS mandates drive BFSI buyers toward observability platforms that provide continuous transaction monitoring and tamper-evident log storage, reinforcing the vertical's disproportionate market share.
Investment and White Space Analysis
Investment is concentrating in three areas: AI-native observability platforms, telemetry pipeline infrastructure, and verticalized packages for regulated industries. Acquisition activity in early 2026, including Palo Alto Networks' purchase of Chronosphere and Snowflake's agreement to acquire Observe, signals that strategic buyers are willing to pay significant premiums to acquire cloud-native observability assets rather than build capabilities organically. The pace of consolidation suggests a narrowing window for independent platform vendors to exit at favorable valuations.
White space exists at the intersection of FinOps correlation and observability, where no vendor has yet established a dominant position. SME-focused managed observability with simplified pricing is a second underserved segment. AI-agent observability represents the highest-upside emerging category, with enterprise AI operations teams currently using ad-hoc solutions that a purpose-built platform could replace. Vendors entering these white-space areas in 2026 and 2027 face lower competitive intensity than in the crowded full-stack APM category.
Report Details
| Report Characteristics |
| Market Value (2026) |
USD 14.24 Billion |
| Forecast Revenue (2035) |
USD 53.33 Billion |
| CAGR (2026–2035) |
15.8% |
| Historical Data |
2020 – 2024 |
| Forecast Data |
2026 – 2035 |
| Base Year |
2025 |
| Estimate Year |
2026 |
| Report Coverage |
Revenue Forecast, Market Dynamics, Competitive Landscape, Recent Developments |
| Segments Covered |
By Offering (Solutions, Services); By Solution (APM, Distributed Tracing, Log Management & Analytics, AIOps & Incident Intelligence, Infrastructure Observability, Other Solutions); By Service (Managed Services, Professional Services); By Telemetry Type (Metrics, Logs, Others – Traces, Events & Profiles); By Deployment Mode (SaaS/Cloud-Hosted, Hybrid, Self-Managed); By Organization Size (Large Enterprises, SMEs); By Vertical (BFSI, IT & ITeS, Telecommunications, Healthcare & Life Sciences, Manufacturing, Retail & eCommerce, Transportation & Logistics, Media & Entertainment, Energy & Utilities, Government & Public Sector, Others) |
| Regional Coverage |
North America – US, Canada; Europe – Germany, France, UK, Spain, Italy, Rest of Europe; Asia-Pacific – China, Japan, South Korea, India, Australia, Rest of APAC; Latin America – Brazil, Mexico, Rest of Latin America; Middle East & Africa – GCC, South Africa, Rest of MEA |
| Prominent Players |
Datadog, Dynatrace, Elastic, New Relic, Splunk, Alibaba Cloud, Amazon Web Services, Apica, BMC Software, Chronosphere, Coralogix, Grafana Labs, Honeycomb, Hewlett Packard Enterprise, IBM, LogicMonitor, Microsoft, ScienceLogic, SolarWinds, Oracle, Sumo Logic, and Other Key Players |
| Customization Scope |
Customization for segments and region or country level will be provided. Additional customization can be done based on requirements. |
| Purchase Options |
Three license options: Single User License, Multi-User License (Up to 5 Users), and Corporate Use License (Unlimited Users and Printable PDF) |
Recent Developments
- January 2026, Palo Alto Networks completed its $3.35 billion acquisition of Chronosphere, adding cloud-native observability and telemetry-pipeline technology with planned Cortex AgentiX integration for autonomous IT and security remediation.
- January 2026, Snowflake signed a definitive agreement to acquire Observe, combining Observe's AI SRE and context-graph technology with Snowflake's data platform to deliver OpenTelemetry- and Apache Iceberg-based enterprise observability.
- February 2026, Datadog launched Feature Flags for general availability, connecting feature releases directly with APM and real-user-monitoring telemetry to identify regressions and enforce reliability guardrails at release time.
- February 2026, Datadog launched Bits AI SRE Agent for general availability, enabling autonomous alert investigation using telemetry and organizational context to surface actionable root causes without manual query construction.
- May 2026, Datadog launched Datadog Experiments, embedding A/B-test design, measurement, and optimization directly into its observability platform for continuous experimentation workflows.
- May 2026, Elastic introduced native Prometheus and PromQL support within Elastic Observability, enabling SRE teams to analyze Prometheus metrics alongside logs and traces without rewriting queries or rebuilding existing pipelines.
Frequently Asked Questions
What is the biggest investment opportunity in the Observability Tools & Platforms market?
▾ AI-agent observability represents the highest-upside near-term opportunity, as enterprises deploying AI agents lack dedicated tools for tracking prompt lineage, token consumption, and model drift. Verticalized packages embedding compliance-grade service-level indicators for payments and healthcare are a second priority. Both categories command premium pricing outside the crowded APM segment.
Who are the top companies in the Observability Tools & Platforms market?
▾ Datadog, Dynatrace, Elastic, New Relic, and Splunk are the leading full-stack platform vendors by enterprise market share. Grafana Labs, Coralogix, Honeycomb, and Chronosphere hold strong positions in specific use cases including open-source-compatible deployments and cloud-native observability. Hyperscalers including Amazon Web Services, Microsoft, and Alibaba Cloud are expanding native observability capabilities that compete with independent vendors for cloud-committed buyers.
Which segment is growing fastest in the Observability Tools & Platforms market and why?
▾ Distributed Tracing is the fastest-growing solution category at an 18.3% CAGR. Microservices architectures make end-to-end request tracing the only reliable method for isolating latency contributors across dozens of interdependent services. Services as an offering type are growing at 17.8%, driven by enterprises contracting managed observability to overcome OpenTelemetry instrumentation talent gaps.
Which region is growing fastest in the Observability Tools & Platforms market and why?
▾ Asia Pacific is the fastest-growing region. Cloud infrastructure investment across China, India, and Southeast Asia is creating new environments that require observability from deployment. Japanese industrial operators connecting Industry 4.0 systems and Indian IT services firms scaling SRE practices are both driving adoption at rates that exceed the global market average.
What is the biggest challenge holding Observability Tools Market back?
▾ Unbounded ingestion costs are the primary brake on platform expansion. Elastic's 2026 research confirmed that 97% of organizations encountered unexpected observability costs and 67% experienced them regularly. Vendors who cannot deliver predictable total cost of ownership risk losing budget-constrained buyers to open-source alternatives or on-premises repatriation strategies.