Market Snapshot
- The Global Domestic Tourism Market is valued at USD 3,284.70 billion in 2026 and is set to expand at a CAGR of 19.1% through the forecast period.
- Leisure and recreation travel led the tour purpose categories, accounting for 40.3% of revenue.
- Local travel dominated the tourism type with a 57.9% revenue share over interstate travel.
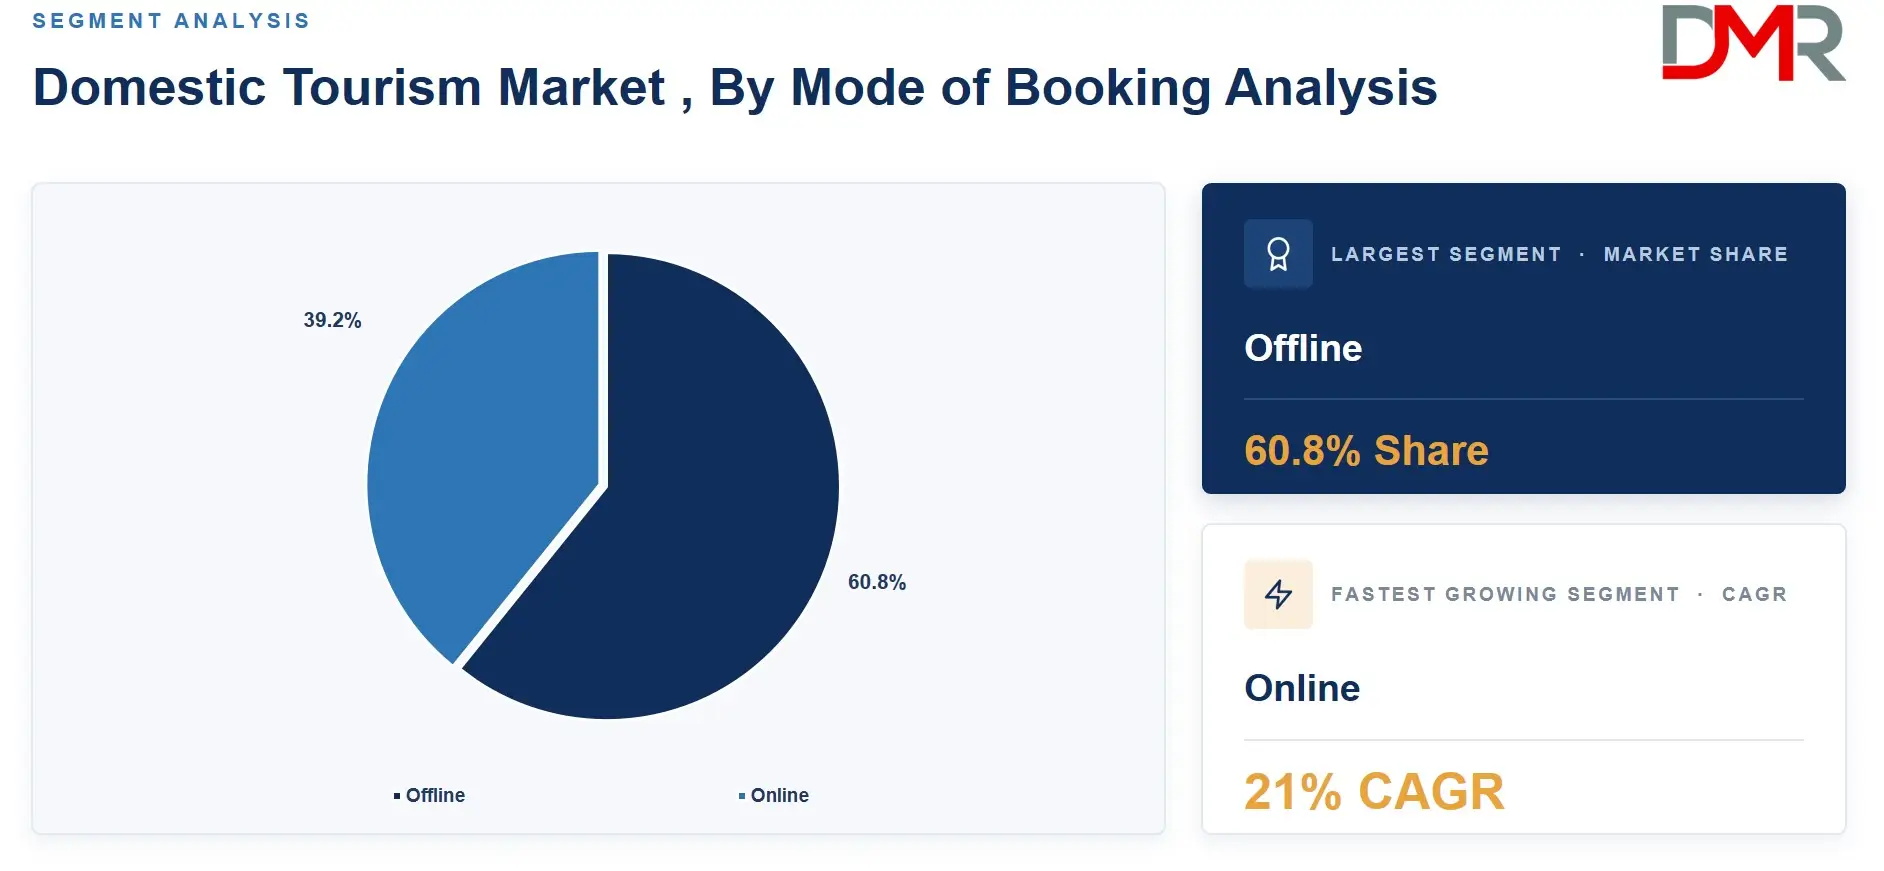
- Offline booking channels held a 60.8% revenue share, ahead of online platforms.
- Travelers aged 30 to 41 years accounted for 40.2% of spending, the largest age cohort.
- Group travelers represented 60.1% of demand, outpacing solo travelers.
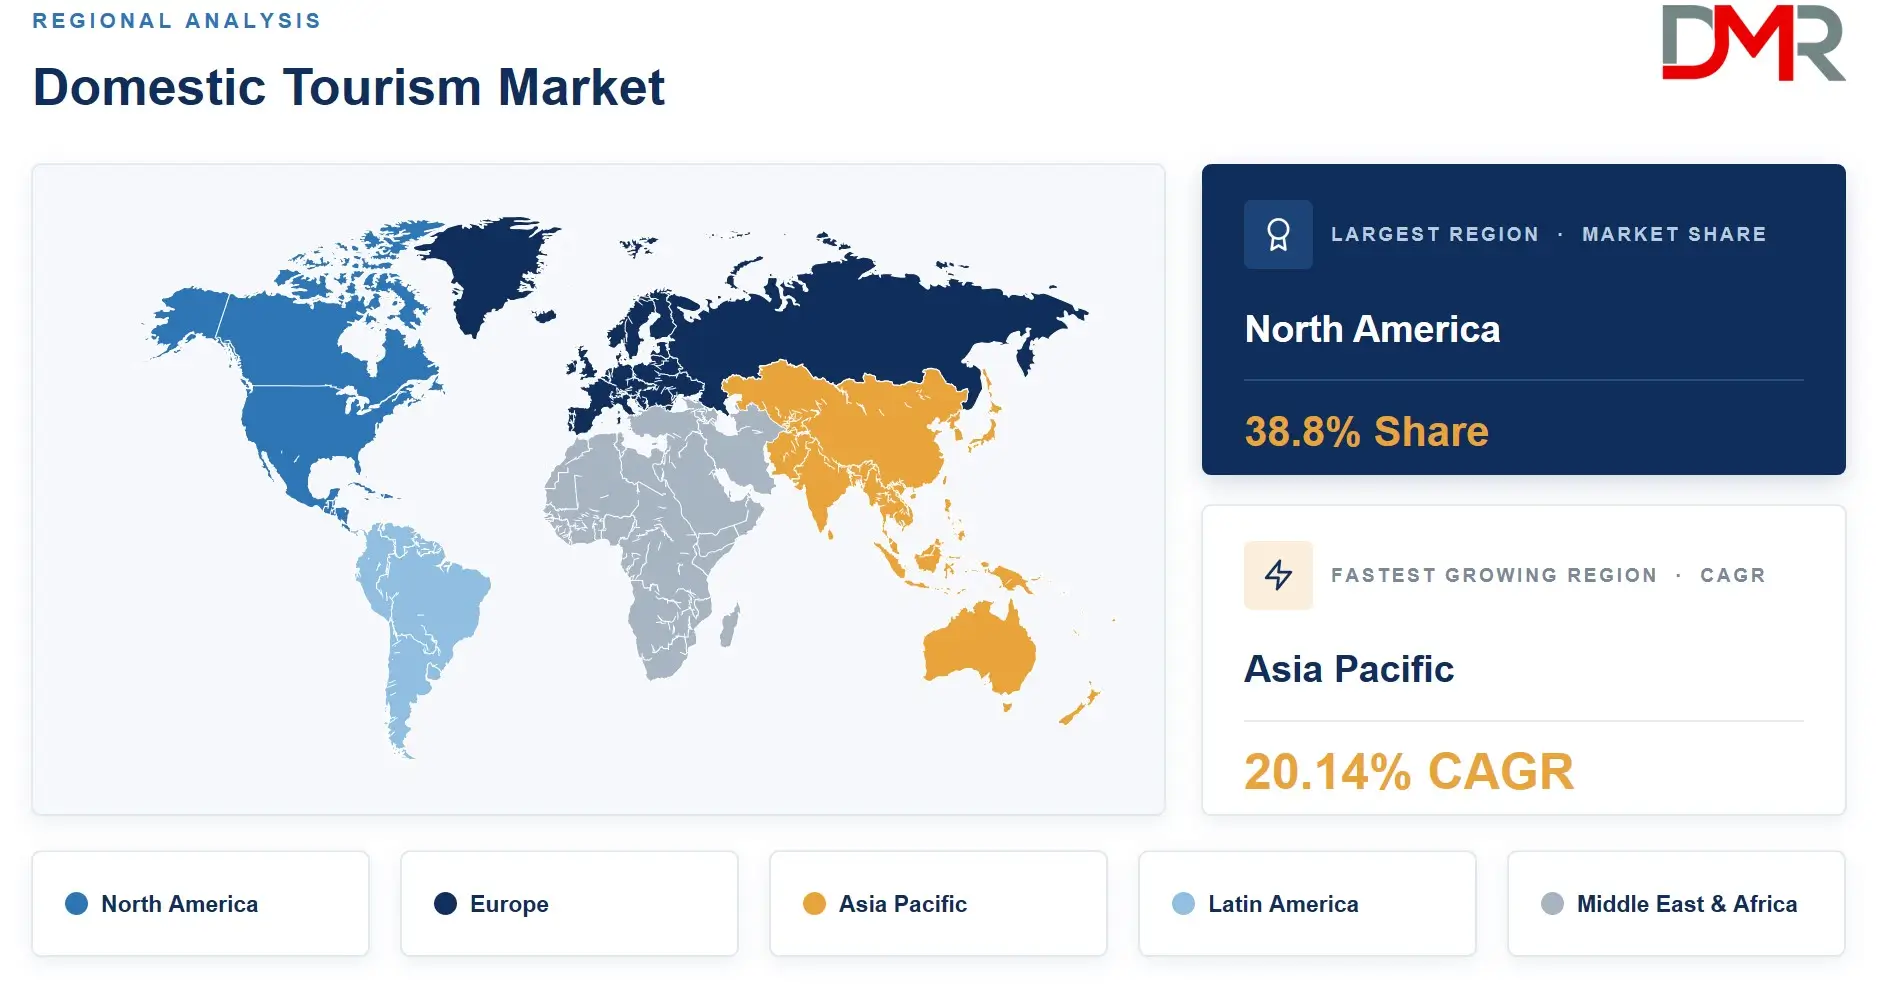
- North America led regional demand with a 38.8% revenue share.
Market Overview
The domestic tourism market covers travel, accommodation, transportation, and activity spending by residents who stay within their own country. It excludes outbound international travel and inbound foreign visitor spending, both of which sit in separate market categories tracked by national tourism boards. Accommodation, food and beverage, transportation, and travel planning services all roll into this single demand pool.
Domestic travel sits inside the broader travel and tourism industry but behaves differently from international tourism because it responds faster to currency shifts, fuel prices, and local disposable income. US domestic leisure travel spending grew 2.1% in 2025 to near USD 900 billion, the only travel vertical to clear 2019 levels in real terms, as reported by the U.S. Travel Association. That resilience signals durable household preference for shorter, lower-risk trips over long-haul vacations.
.webp)
ℹ
To learn more about this report –
Download Your Free Sample Report Here
Digital booking platforms now compress the gap between trip idea and trip purchase. Mobile tools let travelers compare regional transport and lodging options in minutes, a shift that pulls share away from traditional travel agents and toward direct-to-consumer apps built for last-minute domestic planning.
Market Size and Forecast
The Global Domestic Tourism Market size is estimated at USD 3,284.70 Billion in 2026 from USD 2,757.94 Billion in 2025, and is projected to reach USD 15,837.00 Billion by 2035, exhibiting a CAGR of 19.1% during the forecast period.
Saudi Arabia recorded 93.3 million domestic tourists in 2025, up 8.3% over 2024, with spending reaching SAR 127.1 billion, near USD 33.9 billion, a gain of 10.2%, based on data from the Saudi Ministry of Tourism. Nights spent in EU tourist accommodation reached a record 3.08 billion in 2025, with domestic guests accounting for 51% of that total, per Eurostat. Both figures point to the same pattern. Households across distinct economies are choosing to travel more often within their own borders rather than less.
In September 2024, Engine, formerly Hotel Engine, raised USD 140 million in a Series C round led by Permira, reaching a valuation of USD 2.1 billion, with proceeds earmarked for flight and rental car booking features. That capital flow into domestic-focused booking infrastructure supports the forecast assumption that platform consolidation will accelerate booking volume growth faster than raw trip counts alone would suggest.
Tour Purpose Analysis
Leisure and Recreation Tourism led the tour purpose segment with a 40.3% share in 2026.
Family getaways and weekend escapes drive this category, supported by rising middle-class disposable income in emerging economies. Households now treat short domestic breaks as a recurring budget line rather than an occasional indulgence, which keeps demand steady even when broader consumer spending tightens.
Adventure, sports, and wellness tourism trail leisure travel but grow fastest among younger urban travelers chasing curated experiences. Spiritual and pilgrimage tourism keeps a stable, calendar-driven demand base tied to religious festivals. Business and MICE travel recovers slower than leisure segments, while education and family visit categories stay niche but consistent, giving operators a long tail of smaller, repeatable revenue pools beyond the dominant leisure segment.
Tourism Type Analysis
With a 57.9% share in 2026, Local Travel outpaced all other tourism type categories.
Short trips within a traveler's home state or region dominate because they require less planning, lower fuel cost, and shorter time away from work. Persistent regional disparities in transport connectivity push many travelers toward familiar local circuits rather than less developed interstate corridors.
Interstate travel still holds meaningful share among travelers seeking variety, particularly for milestone trips and multi-generational family vacations. Government-backed regional tourism campaigns increasingly target this segment, building infrastructure that could narrow the gap between local and interstate volume over the next several years.
Mode of Booking Analysis
Offline booking accounted for 60.8% of the mode of booking demand in 2026, the highest of any category.
ℹ
To learn more about this report –
Download Your Free Sample Report Here
Travel agents, walk-in bookings, and phone reservations still dominate domestic tourism because many regional and rural destinations lack consistent online inventory. Trust in local operators also keeps offline channels relevant for first-time visitors to unfamiliar regions.
Online booking grows faster as mobile platforms simplify discovery and price comparison for transport and lodging. Expansion of digital travel platforms continues to chip away at offline share, particularly among travelers under 30 who default to apps for last-minute planning.
Age Group Analysis
Travelers aged 30 to 41 years captured 40.2% of the age group segment in 2026, ahead of all rivals.
This cohort combines stable income with active family life, driving repeat short-stay trips built around school holidays and long weekends. Their spending power makes them the primary target for mid-market accommodation and bundled activity packages.
Travelers below 30 grow fastest, drawn by social media-driven destination discovery and budget-friendly group trips. The 42 to 49 and 50-plus cohorts favor longer, comfort-led stays, giving operators a clear split between volume-driven younger segments and value-driven older segments.
Traveler Type Analysis
A 60.1% share made Group Travelers the clear leader across traveler type categories in 2026.
Family and friend groups dominate domestic trips because shared transport and lodging costs make travel more affordable per person. Multi-generational family journeys also drive demand for larger accommodation units and bundled activity packages.
Solo travel keeps growing among younger and business-linked travelers who value flexible itineraries. Operators now design hybrid offerings, such as small-group tours with private add-ons, to capture both traveler types without splitting inventory.
Key Market Segments
By Tour Purpose
- Leisure / Recreation Tourism
- Adventure Tourism
- Sports Tourism
- Wellness Tourism
- Business / MICE Tourism
- Spiritual / Religious & Pilgrimage Tourism
- Education Tourism
- Family & Friends Visit (VFR)
By Tourism Type
- Local Travel
- Interstate Travel
By Mode of Booking
By Age Group
- 30-41 Years
- Below 30 Years
- 42-49 Years
- 50 Years and Above
By Traveler Type
- Group Travelers
- Solo / Individual Travelers
By Service Type
- Accommodation Services
- Activity and Entertainment Services
- Food and Beverage Services
- Transportation Services
- Travel Planning and Booking Services
- Insurance and Financial Services
By Trip Duration
By Work-Travel Integration Format
- Bleisure Travel
- Workation
By Rural vs Urban Destination Focus
- Rural / Agro-Tourism
- Urban / City Break Tourism
- Suburban / Peri-Urban Tourism
Regional Analysis
North America led the Domestic Tourism Market with a 38.8% revenue share in 2026.
Dense interstate highway networks, established hotel chains, and high disposable income give North American travelers the easiest path to frequent short trips. Saudi Arabia's domestic tourism spending reached SAR 127.1 billion in 2025, near USD 33.9 Billion, a sign that government tourism investment can rapidly build a comparable base outside North America.
ℹ
To learn more about this report –
Download Your Free Sample Report Here
Europe holds a sizable base of its own. EU tourism nights rose to a record 3.08 billion in 2025, with domestic guests making up roughly half that volume. Asia Pacific grows fastest as rising middle-class incomes in India and Southeast Asia convert occasional travel into a regular habit. Latin America and the Middle East trail in absolute volume but offer the steepest growth curves for operators willing to build local infrastructure ahead of demand.
Key Regions and Countries
North America
Europe
- Germany
- France
- The UK
- Spain
- Italy
- Rest of Europe
Asia Pacific
- China
- Japan
- South Korea
- India
- Australia
- Rest of APAC
Latin America
- Brazil
- Mexico
- Rest of Latin America
Middle East & Africa
- GCC
- South Africa
- Rest of MEA
Market Dynamics
Proximity Travel Replaces Costlier Trips Abroad
Households across multiple economies now substitute shorter domestic trips for international vacations once budgets tighten. US domestic business travel spending reached USD 317 billion in 2025, up 1.1% over 2024, with group travel also climbing, according to the U.S. Travel Association. Steady corporate travel growth shows that proximity preference extends beyond leisure into company-funded trips.
Mobile booking platforms remove the friction that once kept domestic trips harder to plan than packaged international tours. Rising middle-class income in emerging markets compounds this effect, turning what used to be an annual trip into several shorter outings spread across the year.
Seasonality Strains Regional Tourism Infrastructure
Sharp seasonal peaks overload popular domestic destinations while leaving operators with idle capacity for much of the year. Saudi Arabia's hospitality occupancy averaged 59% in the first quarter of 2026, based on data from the Saudi Press Agency, evidence that even fast-growing domestic markets struggle to keep capacity utilized outside peak periods.
Weak transport links and inconsistent hospitality standards outside major corridors compound this problem. Operators in well-connected cities capture repeat demand while regional destinations with thinner infrastructure see only occasional visitor spikes tied to specific events.
Curated Regional Circuits Open New Revenue Paths
Operators that package lesser-known destinations into themed multi-stop circuits can convert one-off visits into longer, higher-value bookings. Great Britain residents' average spend per overnight domestic trip rose 9% in 2025 to GBP 333, findings from VisitBritain's GBTS show, confirming that travelers will pay more for trips structured around a clear theme rather than a single destination.
In January 2025, Pickyourtrail entered India's domestic tourism segment, starting with Andaman, Kashmir, Rajasthan, and Northeast India, while signaling future acquisitions of niche operators. That move illustrates how platform-led curation can unlock demand in regions that lack strong individual brand recognition on their own.
Market Trends
Shorter Trips and Proximity Tourism Reshape Travel Calendars
Travelers increasingly favor short, purpose-driven trips over long-haul vacations, a shift that destination managers now use to smooth demand across the calendar rather than concentrate it in peak months. GB residents' tourism day visits to Scotland generated GBP 10.3 billion in spending in 2025, per VisitScotland, showing that even short visits without overnight stays carry real economic weight. Early movers that build weekend and shoulder-season products stand to capture share before larger operators catch up.
Market Competition Overview
The domestic tourism market stays fragmented across booking platforms, accommodation chains, and regional tour operators, since no single company controls transport, lodging, and activity inventory at once. Large online travel agencies hold the broadest share by aggregating inventory across categories, a strategy that lets them capture commission on nearly every step of a traveler's trip.
Regional and niche operators gain share in curated, theme-led travel where large platforms offer limited depth. Hotel groups extend reach beyond core lodging into bundled experiences, a move that blurs the line between accommodation providers and full-service trip planners and reshapes how share gets measured across the value chain.
Company Profiles
Booking Holdings Inc. dominates domestic booking volume by aggregating accommodation, transport, and activity inventory under one platform, a model that keeps switching costs low for consumers but raises commission pressure on smaller regional operators. Its scale lets it absorb seasonal demand swings better than single-category competitors.
TravelPerk built its position around corporate and group domestic travel rather than consumer leisure. In 2024, TravelPerk agreed to acquire AmTrav, a US corporate travel management company, while securing USD 135 million in debt financing from Blackstone and Blue Owl. In April 2025, it completed the acquisition of Yokoy, a Swiss expense management firm, a move that bundles travel booking with expense tracking and locks in business clients less likely to switch providers for price alone.
Key Players
- Booking Holdings Inc.
- Marriott International, Inc.
- Expedia Group, Inc.
- Airbnb, Inc.
- Hilton Worldwide Holdings Inc.
- InterContinental Hotels Group PLC (IHG)
- Accor S.A.
- Wyndham Hotels & Resorts, Inc.
- Hyatt Hotels Corporation
- TUI Group
- Trip.com Group Limited
- MakeMyTrip Limited
- Kensington Tours
- Tauck, Inc.
- Scott Dunn Ltd.
- Butterfield & Robinson
- Micato Safaris, Inc.
- OYO (Oravel Stays Singapore Pte. Limited)
- EaseMyTrip
- Yatra Online, Inc.
- Traveloka
- Fliggy (Alibaba Group)
Investment and White Space Analysis
Capital continues flowing into domestic-focused booking and intercity travel infrastructure. In January 2024, Daytrip raised EUR 9.2 million in a Series B round led by Taiwania Capital, with Euroventures and J&T Ventures participating, funding to expand its intercity travel platform. Daytrip then launched in India in March 2024, extending chauffeur-driven sightseeing services into one of the fastest-growing domestic tourism bases.
Rural and agro-tourism destinations remain underserved relative to demand, since most platform investment still targets established urban corridors. Regions with strong domestic spend growth but thin formal accommodation infrastructure, such as Saudi Arabia outside its major cities, offer the clearest entry points for operators willing to build lodging and activity inventory ahead of larger competitors.
Recent Developments
- April 2024, Etraveli Group launched PRECISION, a new fintech risk management solution to improve travel booking reliability across its platforms.
- March 2025, TravelPerk rebranded its corporate identity for its tenth anniversary, introducing a refreshed platform experience for business travel clients.
- January 2026, Etraveli Group announced the acquisition of Wenrix, extending its footprint in travel technology infrastructure.
Report Details
| Report Characteristics |
| Market Value (2025) |
USD 2,757.94 Billion |
| Market Value (2026) |
USD 3,284.70 Billion |
| Forecast Revenue (2035) |
USD 15,837.00 Billion |
| CAGR (2026–2035) |
19.1% |
| Base Year for Estimation |
2025 |
| Historic Period |
2020 – 2024 |
| Forecast Period |
2026 – 2035 |
| Report Coverage |
Revenue Forecast, Market Dynamics, Competitive Landscape, Recent Developments |
| Segments Covered |
By Tour Purpose (Leisure/Recreation, Adventure, Sports, Wellness, Business/MICE, Spiritual/Religious, Education, VFR), By Tourism Type (Local, Interstate), By Mode of Booking (Offline, Online), By Age Group (Below 30, 30-41, 42-49, 50 and Above), By Traveler Type (Group, Solo), By Service Type (Accommodation, Activity and Entertainment, Food and Beverage, Transportation, Travel Planning and Booking, Insurance and Financial), By Trip Duration (Short-Stay, Long-Stay), By Work-Travel Integration (Bleisure, Workation), By Destination Focus (Rural/Agro, Urban/City Break, Suburban/Peri-Urban) |
| Regional Analysis |
North America – US, Canada; Europe – Germany, France, The UK, Spain, Italy, Rest of Europe; Asia Pacific – China, Japan, South Korea, India, Australia, Rest of APAC; Latin America – Brazil, Mexico, Rest of Latin America; Middle East & Africa – GCC, South Africa, Rest of MEA |
| Competitive Landscape |
Booking Holdings, Marriott International, Expedia Group, Airbnb, Hilton Worldwide, IHG, Accor, Wyndham, Hyatt, TUI Group, Trip.com Group, MakeMyTrip, Kensington Tours, Tauck, Scott Dunn, Butterfield & Robinson, Micato Safaris, OYO, EaseMyTrip, Yatra Online, Traveloka, Fliggy |
| Customization Scope |
Customization for segments and region or country level will be provided. Additional customization can be done based on requirements. |
| Purchase Options |
Three license options: Single User License, Multi-User License (Up to 5 Users), and Corporate Use License (Unlimited Users and Printable PDF). |
Frequently Asked Questions
What is the biggest investment opportunity in Domestic Tourism Market ?
▾ Rural and agro-tourism destinations offer the strongest opening, since most platform investment still targets established urban corridors with a 36.1% share concentrated there already, leaving regional circuits underbuilt.
Who are the top companies in Domestic Tourism Market ?
▾ Booking Holdings and TravelPerk lead in different categories, the former in consumer-facing aggregation and the latter in corporate and group domestic travel management.
Which segment is growing fastest in Domestic Tourism Market and why?
▾ Adventure and wellness tourism grow fastest within tour purpose, driven by younger travelers seeking curated, experience-led trips closer to home.
Which region is growing fastest in Domestic Tourism Market and why?
▾ Asia Pacific grows fastest as rising middle-class income converts occasional travel into a regular household habit across India and Southeast Asia.
What is the biggest challenge holding Domestic Tourism Market back?
▾ Seasonality strains regional infrastructure, leaving popular destinations overcrowded in peak months and operators with idle capacity, near a 59% occupancy rate, the rest of the year.