Market Overview
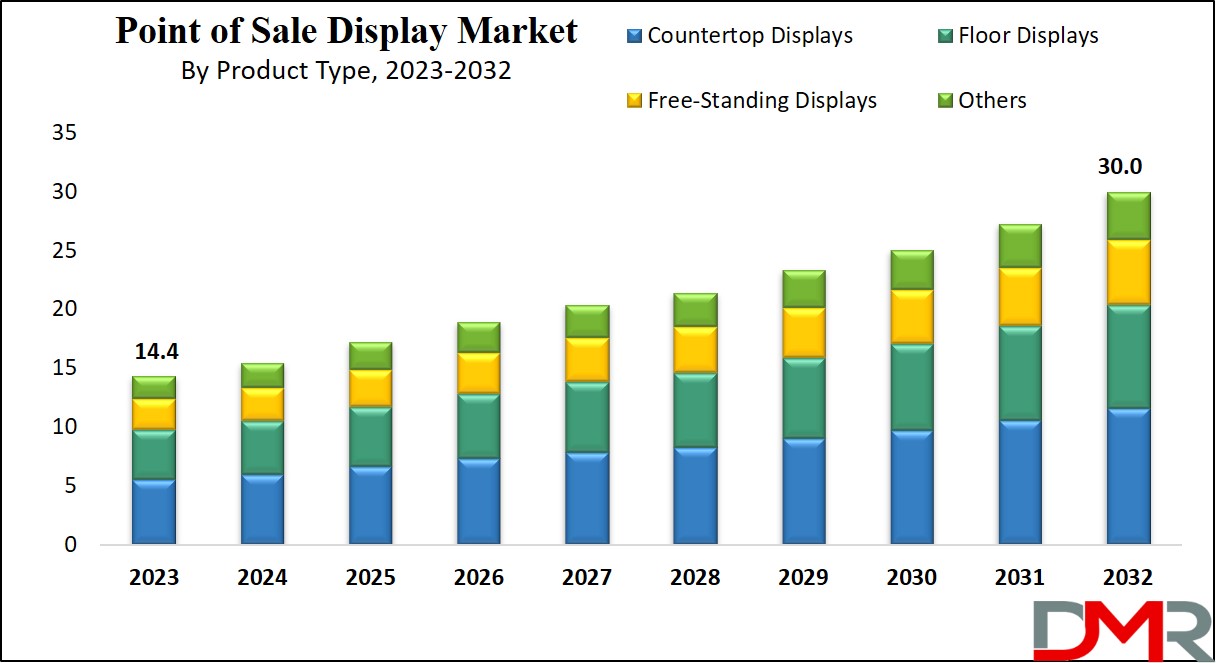
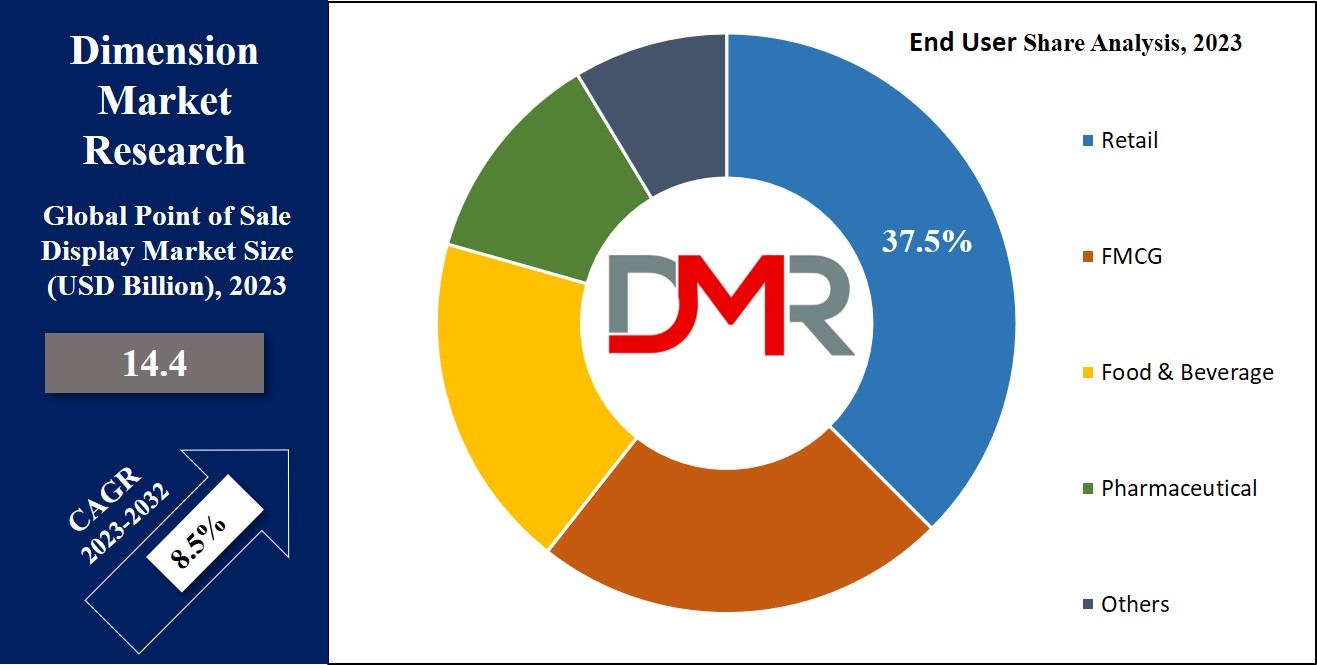
The Global Point of Sale Display Market is expected to reach a value of USD 14.4 billion in 2023, and it is further anticipated to reach a market value of USD 30.0 billion by 2032 at a CAGR of 8.5%. The market has seen a significant increase in the recent past and is predicted to grow significantly during the forecasted period as well.
Point of sale (POS) displays are displays that include a marketing approach wherein promotional materials are strategically positioned where products are available for purchase. Retailers & manufacturers use POS displays to increase product sales within the retail environment.
These displays can be displayed in different forms, including shelf-edge, stand-alone, floor, & counter displays, but their ultimate objective remains to increase the sales of the advertised products. Crafted from diverse materials like plastic, metal, or cardboard, these displays feature distinctive designs customized to the showcased product.
The global point-of-sale (POS) Display Market is experiencing rapid expansion due to an increasing demand for interactive and visually pleasing in-store displays. Retailers are emphasizing customer experiences by employing digital signage solutions and engaging POS solutions designed to increase foot traffic and sales; experiential shopping is fueling this trend.
Technological innovations are revolutionizing point of sale (POS) displays. Digital and touchscreen displays have become more widespread, providing dynamic updates of real-time content and tailored promotions. Furthermore, integrations with
Microdisplays and
Display Driver Integrated Circuit technologies are improving visual performance, enabling sharper images and interactive experiences that significantly enhance consumer engagement. Additionally, integrations with mobile payment systems and loyalty programs improve customer engagement while expanding retailer marketing strategies and opening up growth opportunities.
Retail sectors such as fashion, electronics and groceries experience particularly strong demand for point of sale displays due to visual merchandising's crucial role. E-commerce continues to flourish while physical stores invest more in POS solutions to create unique customer experiences. Sustainability offers brands an additional opportunity as they investigate eco-friendly materials and energy-efficient digital signage solutions in line with consumer preferences for green products.
As per merit-display Over 70% of purchasing decisions are made in-store at the point of sale, according to POPAI. This emphasizes how important retail displays and visual merchandising are in influencing consumer behavior. The strategic placement of products and the overall shopping environment can significantly affect customers' buying choices, driving sales for retailers.
A study by FedEx Office reveals that 76% of consumers enter a store they’ve never visited before based on its signs. This highlights the crucial role signage plays in attracting potential customers and building trust through consistent branding. Recognizable logos and colour schemes can encourage foot traffic and foster familiarity with the store.
In-store displays have a 10% higher recall rate than digital ads, as found by Forbes. These physical displays engage customers in a multisensory experience, creating stronger brand recognition. Additionally, 62% of shoppers make impulse purchases when drawn to appealing displays, showcasing how effective visual merchandising can drive unplanned sales and enhance overall revenue for retailers.
Key Takeaways
- Strong Market Growth: The Global Point of Sale (POS) Display Market is valued at USD 14.4 billion in 2023 and is projected to nearly double to USD 30.0 billion by 2032, growing at a CAGR of 8.5%. This growth is driven by retailers’ focus on enhancing in-store customer experiences and boosting product visibility.
- Diverse Product Segments: By product type, countertop displays are emerging as the fastest-growing segment due to their affordability and ability to trigger impulse purchases near checkout counters. Floor and free-standing displays also hold significant demand in promoting seasonal and high-visibility items.
- Retail Sector Leading Demand: The retail industry accounts for the largest share, with rapid adoption of POS displays across supermarkets, fashion outlets, and specialty stores. Growth is reinforced by investments in omnichannel strategies and the increasing importance of visual merchandising in driving sales.
- Regional Leadership: North America leads the market with 35.8% revenue share in 2023, supported by advanced retail infrastructure and consumer preference for cashless, technology-driven transactions. Europe follows closely with strong adoption in the UK, Germany, France, and Italy, while Asia-Pacific presents high potential due to expanding retail and FMCG sectors.
Use Cases
- Retail & Supermarkets: POS displays are widely used in supermarkets, fashion outlets, and department stores to highlight seasonal promotions, new arrivals, and impulse-buy items at checkout counters, significantly boosting sales and brand visibility.
- Food & Beverage (F&B) Industry: Beverage companies, snack brands, and quick-service restaurants leverage floor and countertop displays to promote limited-time offers, combo packs, and new product launches, driving impulse purchases and repeat sales.
- Pharmaceutical Sector: Pharmacies use countertop and free-standing displays to showcase over-the-counter (OTC) drugs, health supplements, and wellness products, improving product awareness while encouraging customer trust and quick decision-making.
- FMCG & Consumer Goods: Fast-moving consumer goods brands utilize customized POS displays to differentiate products in highly competitive aisles, creating strong shelf appeal and influencing last-minute buying behavior.
- Electronics & Lifestyle Stores: POS displays, including interactive digital signage and touchscreen kiosks, are adopted by electronics retailers to provide product information, highlight promotions, and enable loyalty program sign-ups, enhancing customer engagement. Integration with Healthcare IT Solutions and smart retail analytics also expands their application in health-related product marketing.
Market Dynamic
The global point-of-sale display market is growing primarily driven by the highly competitive retail sector, which stands as both the fastest-growing & the largest consumer of POS displays. As numerous players enter the retail and food & beverages (F&B) segments, competition elevates, prompting businesses to seek innovative ways to distinguish their products.
Point-of-sale displays serve as the ultimate advertising tool in the retail sales chain. With imaginative designs, logos, and messages, manufacturers and sellers can efficiently promote their products at a lower cost compared to other advertising methods like television or print ads.
However, high-end point-of-sale (POS) displays often come with high initial investments due to factors like the materials used in their construction, intricate design requirements, & various creative elements that increase the costs. Additionally, retailers must allocate funds for acquiring the necessary software & hardware to ensure the efficient operation of these POS displays.
Moreover, deployment & staff training expenses deliver to the overall cost, which can be a major barrier to entry for businesses in the POS display industry, mainly for smaller or medium-sized players who might not perceive this advertising tool as a cost-effective option.
Research Scope and Analysis
By Product Type
In terms of product types, the global point-of-sale display market contains distinct categories, including free-standing displays, floor displays, countertop displays, & others. Further, in the forecasted period, the countertop displays segment is anticipated to be a major driving factor in the overall growth of the market. These displays are comparatively smaller in size & are typically placed near checkout counters, strategically capitalizing on human impulses for spur-of-the-moment purchases.
They are essential for promoting new products, seasonal items, or items currently on sale. For instance, smaller-sized free-standing displays made of materials like cardboard or plastic can be reasonably priced, ranging from USD 10 to USD 100 per unit, making them an attractive & affordable choice for businesses looking to improve their sales & product visibility at the point of purchase.
By End User
In terms of end users, the global point-of-sale market is divided into different segments, including food & beverages, FMCG (Fast-Moving Consumer Goods), pharmaceuticals, retail, & others. In 2023, the sector experiencing the most substantial growth is the retail sector, as the growth of the market can be said due to the broad adoption of display systems, mainly among small, medium, & large-sized retail establishments, which majorly depends on well-crafted & technology-driven point-of-sale displays to enhance their customer experiences.
The retail sector's growth is further driven by significant investments focused on establishing omnichannel retail strategies, which allow businesses to seamlessly serve customers through different channels, ultimately contributing to the strong growth observed within this market segment.
The Global Point of Sale Display Market Report is segmented on the basis of the following:
By Product Type
- Countertop Displays
- Floor Displays
- Free-Standing Displays
- Others
By End User
- Retail
- FMCG
- Food & Beverage
- Pharmaceutical
- Others
Regional Analysis
In the global point-of-sale display market, North America leads the market by accounting for
about 35.8% of the total revenue generation and is also anticipated for its most significant growth, primarily due to the advanced retail sectors within the US & Canadian economies.
In addition, the United States is anticipated to emerge as the largest market share holder within the region, driven by consumers' increasing preference for cashless transaction methods, including payments through point-of-sale displays. Furthermore, the region expects a growth in demand for improved checkout experiences, likely resulting in higher revenues. Retailers are expected to grow their investments in sales promotion & consumer attraction.
Moreover, in Europe, the concentration of revenue is expected in key regions, including the United Kingdom, Germany, France, Italy, & Spain. These countries are noticing growth in their retail industries, & the market is further restored by an increase in the number of players offering high-quality products, as such trend in Europe presents a favorable contributing factor to the point-of-sale display market's expansion within the region.
By Region
North America
Europe
- Germany
- The U.K.
- France
- Italy
- Russia
- Spain
- Benelux
- Nordic
- Rest of Europe
Asia-Pacific
- China
- Japan
- South Korea
- India
- ANZ
- ASEAN
- Rest of Asia-Pacific
Latin America
- Brazil
- Mexico
- Argentina
- Colombia
- Rest of Latin America
Middle East & Africa
- Saudi Arabia
- UAE
- South Africa
- Israel
- Egypt
- Rest of MEA
Competitive Landscape
The global point-of-sale display market is fragmented, with a number of players competing in the industry. Small & large companies alike provide a wide range of display solutions, creating intense competition.
While established manufacturers mostly focus on high-quality, specialized displays, newer entrants look at affordability & innovative options. This fragmentation provides customers with a range for selection of choices but can also lead to price competition & rapid technological development as companies aim to stand out in the market.
For instance, in March 2023, DS Smith enhanced its high-quality 3D corrugated display capabilities in the UK, particularly at its Ely, Cambridgeshire site, as they made a huge investment in a state-of-the-art seven-color Nozomi C18000 Plus digital printer, the latest in post-print technology, provided by Electronics for Imaging (EFI). This advanced printer will provide benefits to customers in retail marketing, e-commerce, & at the point of sale by delivering enhanced printing solutions.
Some of the prominent players in the Global Point of Sale Display Market are
- ShopKeep
- Duet
- NCR Corp
- Advantech Co. Ltd
- Square Inc
- LG Display
- Dell Technologies
- Toshiba Corp
- Panasonic Corp
- Smurfit Kappa PLC
- Other Key Players
Recent Developments
- February 2025: Posiflex unveiled a lineup of AI-enabled POS and self-checkout kiosks at EuroCIS 2025 in Düsseldorf, including ultra-narrow bezel POS terminals (GT Series), voice-interactive self-order kiosks, and AI-powered unattended retail systems with product recognition and multiple payment options.
- January 2025: At RetailNOW 2025 in the U.S., iMin Technology introduced the industry's first AI POS terminal, featuring advanced capabilities like OCR translation, gesture control, voice control, simultaneous interpretation, and smart macro functions.
- January 2025: During NRF 2025, Posiflex also presented its new modular POS terminals—customizable tablets, clamshell-style units for easy servicing, and AI-enhanced self-service kiosks (voice-prompted, RFID scanning, camera-assisted scales).
- February 2024: HH Global acquired British POS specialist Displayplan, gaining enhanced capabilities in design engineering, digital signage integration, content creation, real-time analytics, and a strengthened global digital PoS offering.
Report Details
| Report Characteristics |
| Market Size (2023) |
USD 14.4 Bn |
| Forecast Value (2032) |
USD 30.0 Bn |
| CAGR (2023-2032) |
8.5% |
| Historical Data |
2017 - 2022 |
| Forecast Data |
2023 - 2032 |
| Base Year |
2022 |
| Estimate Year |
2023 |
| Report Coverage |
Market Revenue Estimation, Market Dynamics, Competitive Landscape, Growth Factors and etc. |
| Segments Covered |
By Product Type ( Countertop Displays, Floor Displays, Free-Standing Displays, and Others), By End User (Retail, FMCG, Food & Beverage, Pharmaceutical, and Others) |
| Regional Coverage |
North America – The US and Canada; Europe – Germany, The UK, France, Russia, Spain, Italy, Benelux, Nordic, & Rest of Europe; Asia- Pacific– China, Japan, South Korea, India, ANZ, ASEAN, Rest of APAC; Latin America – Brazil, Mexico, Argentina, Colombia, Rest of Latin America; Middle East & Africa – Saudi Arabia, UAE, South Africa, Turkey, Egypt, Israel, & Rest of MEA |
| Prominent Players |
ShopKeep, Duet, NCR Corp, Advantech Co. Ltd, Square Inc, LG Display, Dell Technologies, Toshiba Corp, Panasonic Corp, Smurfit Kappa PLC, and Other Key Players |
| Purchase Options |
We have three licenses to opt for: Single User License (Limited to 1 user), Multi-User License (Up to 5 Users), and Corporate Use License (Unlimited User) along with free report customization equivalent to 0 analyst working days, 3 analysts working days and 5 analysts working days respectively. |
Frequently Asked Questions
The Global Point of Sale Display Market is estimated to reach USD 14.4 billion in 2023, which is further
expected to reach USD 30.0 billion by 2032.
North America dominates the Global Point of Sale Display Market with a share of 35.8% in 2023.
Some of the major key players in the Global Point of Sale Display Market are Duet, LG Display, NCR Corp,
and many others.
The market is growing at a CAGR of 8.5 percent over the forecasted period.