Market Overview
The Global Smart Demand Response Market is expected to reach a value of USD 29.7 billion in 2023, and it is further anticipated to reach a market value of USD 132.0 billion by 2032 at a CAGR of 18.0%. The market has seen a significant increase in the recent past and is predicted to grow significantly during the forecasted period as well.
Smart demand response is a powerful energy management approach that utilizes advanced technologies & real-time data to enhance electricity consumption., and allows users, like households & businesses, to intelligently adjust their energy use during periods of high need or when electricity prices are at their peak. By integrating smart meters, automation, & communication systems, smart demand response allows more efficient & sustainable energy consumption, assisting in stabilizing the power grid, reducing costs, & supporting the integration of renewable energy sources.
Key Takeaways
- Market Growth: The global smart demand response market is expected to grow from USD 29.7 billion in 2023 to USD 132 billion by 2032, at a CAGR of 18.0%.
- Technology Impact: Smart demand response leverages real-time data, smart meters, and automation to optimize electricity use, stabilize grids, and cut costs for consumers.
- Regional Leaders: North America leads the market with a 45.1% revenue share in 2023, while Asia Pacific is expected to see the fastest growth due to rapid smart meter adoption.
- Key Segments: The residential sector held the largest share in 2023, driven by energy efficiency needs and carbon reduction initiatives; industrial adoption is also accelerating with smart grid expansion.
- Growth Drivers: Increasing deployment of smart grids, favorable government policies, and customer energy management systems are fueling market growth and encouraging broader participation.
- Major Barriers: High technology investment costs and limited consumer awareness are key challenges that could hinder wider adoption of smart demand response solutions.
- Competitive Landscape: Industry leaders and startups are intensifying competition, with strategic collaborations (e.g., Tata Power’s partnership with AutoGrid in India) driving innovation and large-scale deployments.
Use Cases
- Grid Stabilization Programs: Utilities deploy smart demand response to automatically manage peak loads, reducing the risk of blackouts and ensuring continuous energy supply during demand spikes.
- Commercial Energy Savings: Businesses participate in automated demand response to optimize HVAC, lighting, and appliances, lowering utility bills and supporting sustainability certifications like LEED.
- Residential Smart Appliances: Homeowners use smart meters and automated control for devices such as water heaters and air conditioners to minimize energy costs during high-price periods.
- Industrial Load Shifting: Factories leverage real-time data and distributed energy resources to shift operations or store surplus power, enhancing efficiency and reacting swiftly to grid signals.
- Renewable Integration Support: Demand response systems help balance supply fluctuation from renewables by adjusting consumption patterns, supporting higher renewable penetration in local grids.
- EV Charging Optimization: Smart charging of electric vehicles enables grid-friendly charging schedules, reducing stress on the electricity network during peak hours and leveraging time-of-use tariffs.
Market Dynamic
The growth of smart grid implementations is driving customer energy management systems, renewable energy integration, & automation in transmission & distribution (T&D) systems, which is further driven by favorable demand response (DR) programs & policies. Initiatives such as the Leadership in Energy & Environmental Design (LEED) are anticipated to increase revenue, with programs like the U.S. Green Building Council's LEED DR Pilot fueling DR participation by providing additional credits for complete automated solutions. Using intelligent metering & advanced ICT demand-side management (DSM) solutions provides an opportunity to harness renewable energy, achieve energy savings, & support customer engagement in the energy ecosystem.
However, high investment in technology & equipment with restricted consumer awareness in terms of the need for a response system are the factors anticipated to hinder the market growth. Also, changes & developments in the power sector as well as decentralization of electricity systems are anticipated to grow high growth opportunities for the market during the forecasted period.
Research Scope and Analysis
By End User
The market is categorized by application into residential, commercial, & industrial segments, with the residential sector leading in revenue share for 2023, which is primarily due to the growing emphasis on improving energy efficiency & reducing carbon emissions in residential structures. Smart demand response solutions allow homeowners to effectively manage their energy consumption, optimize utilization during peak demand periods, & contribute to grid stability & sustainability.
For residential consumers, demand response (DR) programs include the direct control of major appliances like pool pumps, water heaters, &
air conditioning systems. The increase in adoption of distributed generation, mainly among residential users, improves the potential of DR. Intelligent residential buildings are anticipated to actively engage in DR programs to support grid resilience during high-demand periods, simultaneously resulting in lower electricity costs & benefits for consumers.
Also, the industrial segment is anticipated to have rapid growth in the forecast period, buoyed by the scaling of smart grids & the integration of distributed energy resources (DERs). Smart grids help two-way communication & control, empowering industrial consumers & utilities to closely monitor & manage energy consumption. The inclusion of DERs such as
electric vehicle charging stations &
energy storage systems increases the adaptability & responsiveness of industrial need response, providing the capacity to store extra energy or adapt usage in response to grid conditions.
Further, the growth in advancements prevailing to commercial demand response is linked to utilities' rising imperative to handle peak energy needs & the improvement of hardware technology, containing control equipment & metering solutions.
The Global Smart Demand Response Market Report is segmented on the basis of the following:
By End User
- Residential
- Commercial
- Industrial
Regional Analysis
Among all the regions, North America leads the market with the largest revenue
share at 45.1% in 2023 and is anticipated to do so throughout the forecasted period. The region leads with the growing demand for electricity and the imperative to manage peak loads efficiently. As energy consumption continues to increase, utilities are actively looking for innovative solutions to strike a balance between supply & demand, reduce strain on the power grid, & avert potential blackouts or disruptions. Specifically, California anticipates its buildings contributing significantly to peak loads, where the Demand Response Research Center (DRRC) is dedicated to exploring dynamic peak load reduction technologies for both commercial & residential applications, distinctive in response durations.
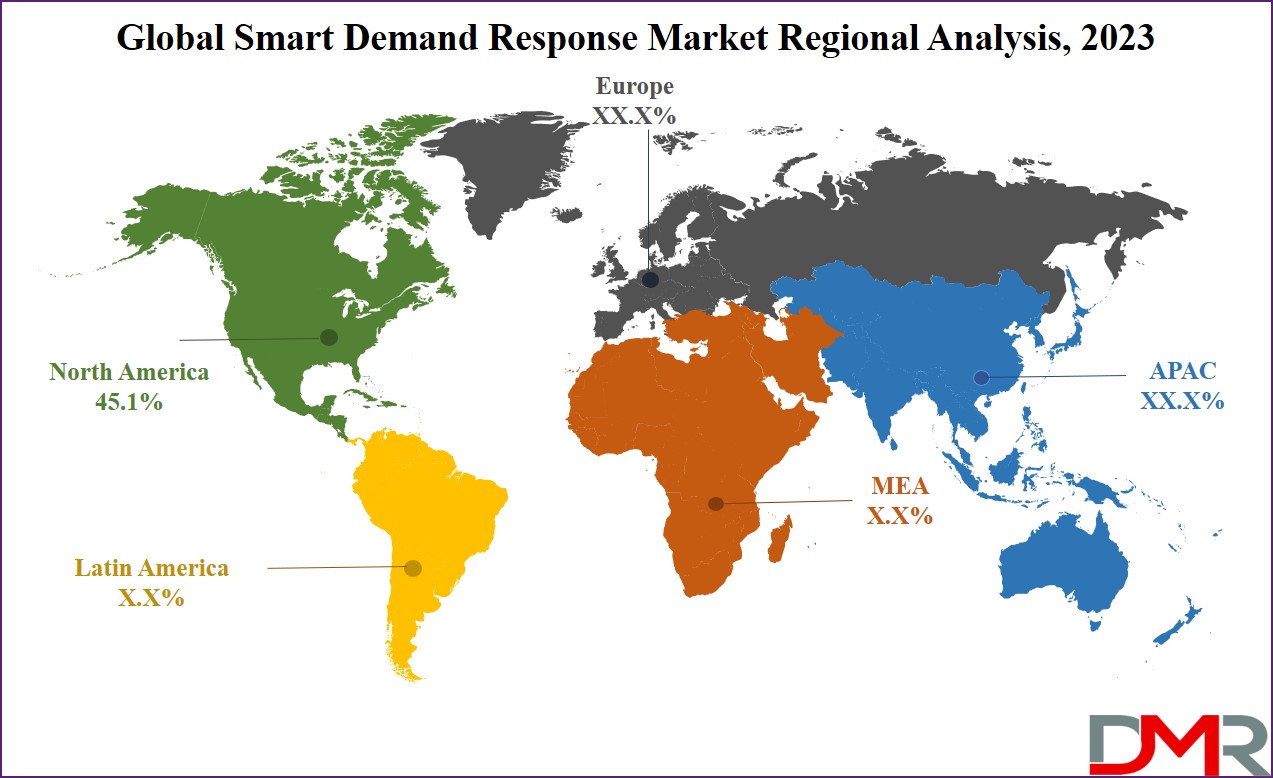
Further, Asia Pacific is anticipated to have more significant growth during the forecast period, mainly driven by the growing adoption of smart meters in the region. The rise in the number of these meters allows households to access real-time data on energy consumption & pricing, enabling the introduction of time-based electricity pricing options, as mass deployment of these smart meters is expected to create fresh opportunities for the region in the energy sector.
By Region
North America
Europe
- Germany
- The U.K.
- France
- Italy
- Russia
- Spain
- Benelux
- Nordic
- Rest of Europe
Asia-Pacific
- China
- Japan
- South Korea
- India
- ANZ
- ASEAN
- Rest of Asia-Pacific
Latin America
- Brazil
- Mexico
- Argentina
- Colombia
- Rest of Latin America
Middle East & Africa
- Saudi Arabia
- UAE
- South Africa
- Israel
- Egypt
- Rest of MEA
Competitive Landscape
The Global Smart Demand Response Market experiences intense competition from a range of industry players offering diverse solutions. Established players with smart demand response offerings compete alongside innovative startups that aim & focus on developing advanced technologies. As the market expands, collaborations between utilities & technology firms are on the rise, intensifying competition as companies look into addressing the growing demand for energy-efficient and sustainable solutions.
For instance, in February 2023, Tata Power along with AutoGrid announced a partnership to introduce an AI-driven smart energy management system in Mumbai, with an aim to encourage behavioral demand response among residential, commercial, & industrial users. This initiative looks into addressing challenges linked to growing energy demand while supporting India's rapid movement towards renewable energy & achieving Net Zero Goals. The program's scope extends to engaging 55,000 households & 6,000 major commercial & industrial clients.
Some of the prominent players in the Global Smart Demand Response Market are:
- General Electric
- Eaton
- Honeywell Smart Grid
- Siemens
- Johnson Controls
- ABB
- Comverge
- EnerNOC
- Itron
- Schneider Electric
- Other Key Players
Recent Developments
- In January 2025, the European Union awarded €5.89 million in funding under Horizon Europe to the DR-RISE residential demand response innovation project coordinated by smartEn.
- In December 2024, Iberdrola announced plans to sell its UK smart metering business, managing over 2.5 million smart meters, for about 1 billion pounds.
- In December 2024, Arcus’ Horizon Energy Infrastructure merged with KKR’s Smart Metering Systems, consolidating operations and boosting capabilities within the smart demand response sector.
- In February 2023, Tata Power partnered with AutoGrid to launch an AI-powered smart energy management platform in Mumbai, engaging tens of thousands of residential, commercial, and industrial customers.
- In July 2022, CPower acquired the US demand response division of Centrica, enhancing its services and expanding smart demand response capacity in the US market.
Report Details
| Report Characteristics |
| Market Size (2023) |
USD 29.7 Bn |
| Forecast Value (2032) |
USD 132.0 Bn |
| CAGR (2023–2032) |
18.0% |
| Historical Data |
2017 – 2022 |
| Forecast Data |
2023 – 2032 |
| Base Year |
2022 |
| Estimate Year |
2023 |
| Report Coverage |
Market Revenue Estimation, Market Dynamics, Competitive Landscape, Growth Factors and etc. |
| Segments Covered |
By End User (Residential, Commercial, and Industrial) |
| Regional Coverage |
North America – The US and Canada; Europe – Germany, The UK, France, Russia, Spain, Italy, Benelux, Nordic, & Rest of Europe; Asia-Pacific – China, Japan, South Korea, India, ANZ, ASEAN, Rest of APAC; Latin America – Brazil, Mexico, Argentina, Colombia, Rest of Latin America; Middle East & Africa – Saudi Arabia, UAE, South Afri |
Frequently Asked Questions
The Global Smart Demand Response Market is estimated to reach USD 29.7 billion in 2023, which is
further expected to reach USD 132.0 billion by 2032.
North America dominates the Global Smart Demand Response Market with a share of 45.1% in 2023.
Some of the major key players in the Global Smart Demand Response Market are ABB, Eaton, Siemens,
and many others.
The market is growing at a CAGR of 18.0 percent over the forecasted period.