Market Overview
The Software Carbon Intensity Measurement Platform market covers purpose-built tools that quantify and report the carbon emissions attributable to software execution. The Green Software Foundation's SCI specification defines the core score as SCI = (E × I + M) per functional unit R, combining energy consumed, carbon intensity of electricity, and embodied hardware emissions per unit of software work. That formula separates SCI platforms from general ESG reporting suites by anchoring emissions to code behavior rather than energy bills or purchased offsets.
ℹ
To learn more about this report –
Download Your Free Sample Report Here
The platform category excludes financial carbon-offset ledgers, physical asset emissions sensors, and general sustainability dashboards unless those tools natively compute SCI scores against software functional units. Workiva and Persefoni formalized a strategic partnership in March 2024 to deliver investor-grade carbon disclosures to joint customers, signaling that SCI platforms are integrating with broader ESG data supply chains. Vendors that bridge SCI calculation with audit-ready disclosure will hold structural pricing power as compliance mandates tighten across jurisdictions.
Enterprise adoption carries validated scale evidence. The AFAS SB cloud-native financial platform, assessed under SCI methodology, serves 7,540 unique users with approximately 90% weekly retention, as reported by the Green Software Foundation case study library. Retention at that level confirms that SCI-instrumented platforms carry no meaningful user-experience penalty relative to unoptimized alternatives. For vendors positioning SCI as a performance discipline rather than a compliance cost, that data point is a direct commercial argument.
Key Takeaways
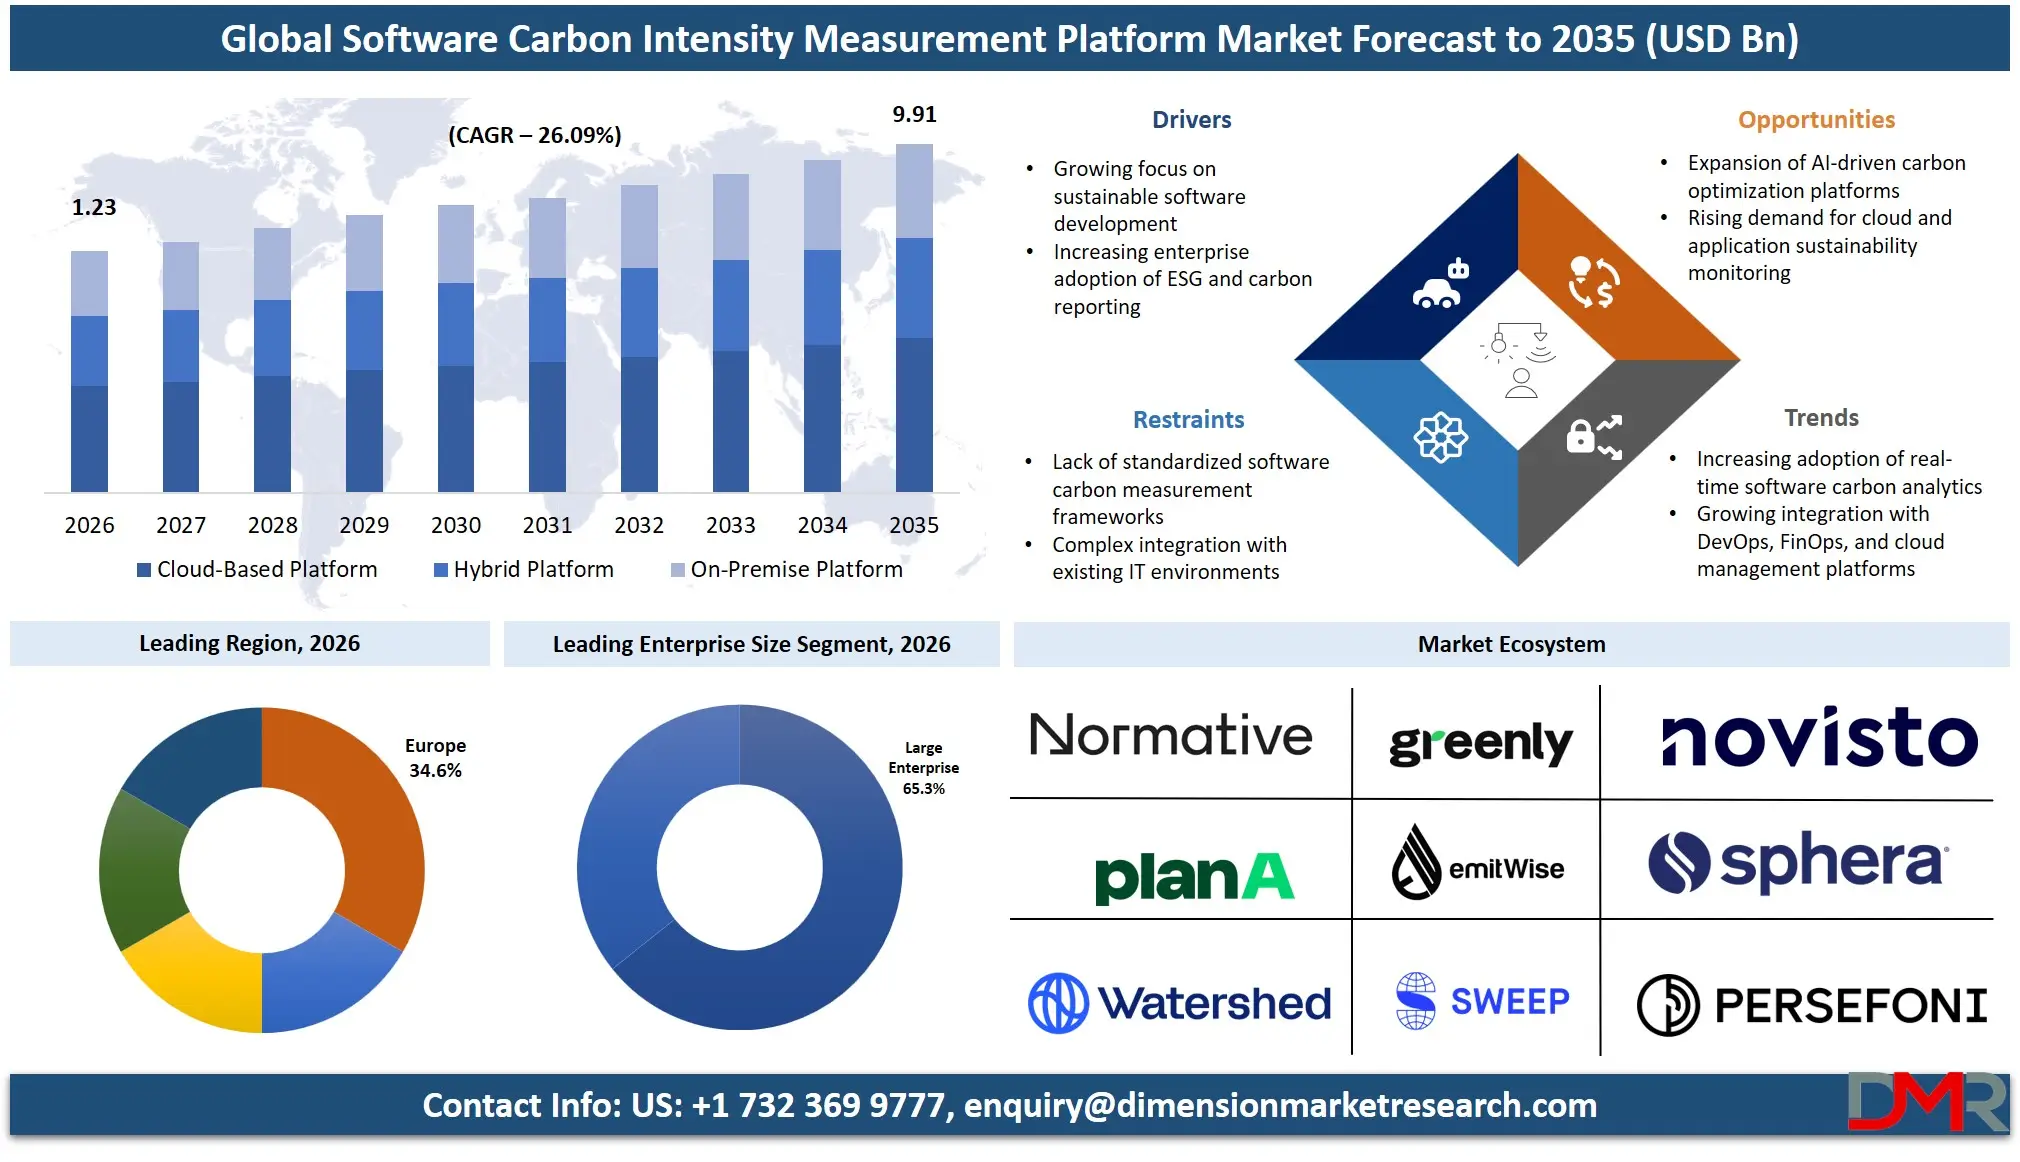
- The Software Carbon Intensity Measurement Platform market was valued at USD 0.98 Billion in 2025, reached USD 1.23 Billion in 2026, and is forecast to reach USD 9.91 Billion by 2035 at a CAGR of 26.09%.
- Cloud-Based Platform leads the deployment type segment with a 67.12% revenue share in 2026.
- Large Enterprises hold a 65.34% revenue share by enterprise size in 2026.
- Cloud and Infrastructure Carbon Measurement leads the application segment with a 29.45% revenue share in 2026.
- IT and Telecom leads the end-use industry segment with a 26.84% revenue share in 2026.
- Europe dominates regional demand with a 34.63% revenue share in 2026.
Market Size and Forecast
The Global Software Carbon Intensity Measurement Platform Market size is estimated at USD 1.23 Billion in 2026 from USD 0.98 Billion in 2025, and is projected to reach USD 9.91 Billion by 2035, exhibiting a CAGR of 26.09% during the forecast period.
Databricks closed a USD 10 Billion Series J round in December 2024, led by Thrive Capital and Andreessen Horowitz, signaling that the data infrastructure layer underpinning sustainability analytics commands investor conviction at a scale pure-play SCI vendors cannot yet match. That capital concentration at the infrastructure tier will pressure SCI measurement platforms upmarket. Vendors that deliver SCI scores as actionable engineering signals, rather than raw telemetry, will capture disproportionate margin as hyperscalers commoditize basic carbon dashboards.
AFAS SB's garbage collection optimization under SCI methodology produced a 29.5%–30.6% carbon reduction, with disk I/O operations identified as the primary emissions correlate at r = 0.997, as documented by the Green Software Foundation case study library. That near-perfect statistical correlation between a specific engineering action and a measurable emissions outcome is the evidence enterprise buyers need to justify platform procurement to finance and sustainability committees simultaneously. As SCI case studies accumulate across industries, procurement cycles will shorten and average contract values will rise, anchoring the forecast trajectory through 2035.
Deployment Type Analysis
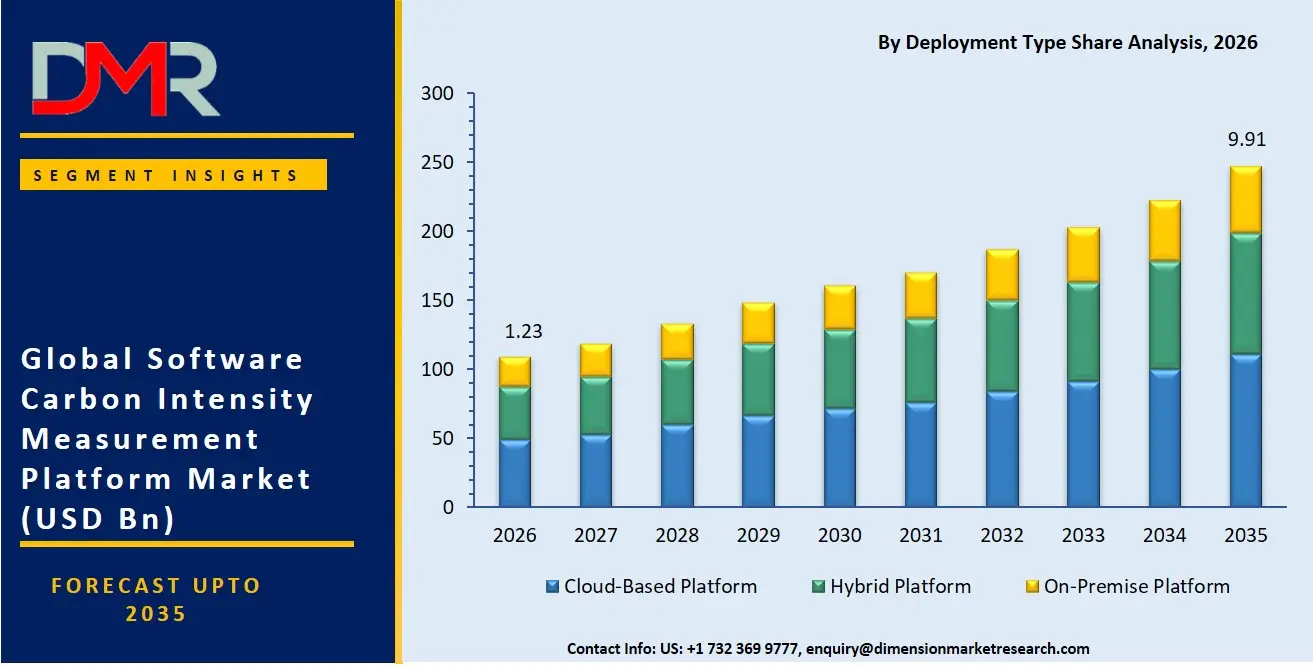
Cloud-Based Platform led the deployment type segment with a 67.12% share in 2026.
ℹ
To learn more about this report –
Download Your Free Sample Report Here
Cloud-based SCI platforms captured dominant share because they align natively with the environments generating the most measurable software emissions: public cloud workloads on hyperscaler infrastructure. Vendors instrument containerized environments, serverless functions, and managed Kubernetes clusters without requiring customers to manage on-premise telemetry agents. Cloud-based platforms also receive real-time grid carbon intensity feeds, enabling time-averaged and marginal SCI calculations that on-premise deployments cannot replicate at comparable speed or cost.
Cloud-based deployment holds 72.4% of the broader carbon management software market, as reported by the Green Software Foundation, confirming that the SCI segment tracks the wider category's structural preference. Hybrid platforms will absorb enterprises with data sovereignty requirements, particularly financial services and defense contractors where regulated workloads cannot reside in public cloud environments. On-premise deployments remain a niche, primarily serving utilities and industrial operators with air-gapped infrastructure. Vendors building hybrid connectors rather than treating on-premise as a separate product line will protect revenue from the segment's long tail without splitting their engineering roadmap.
Enterprise Size Analysis
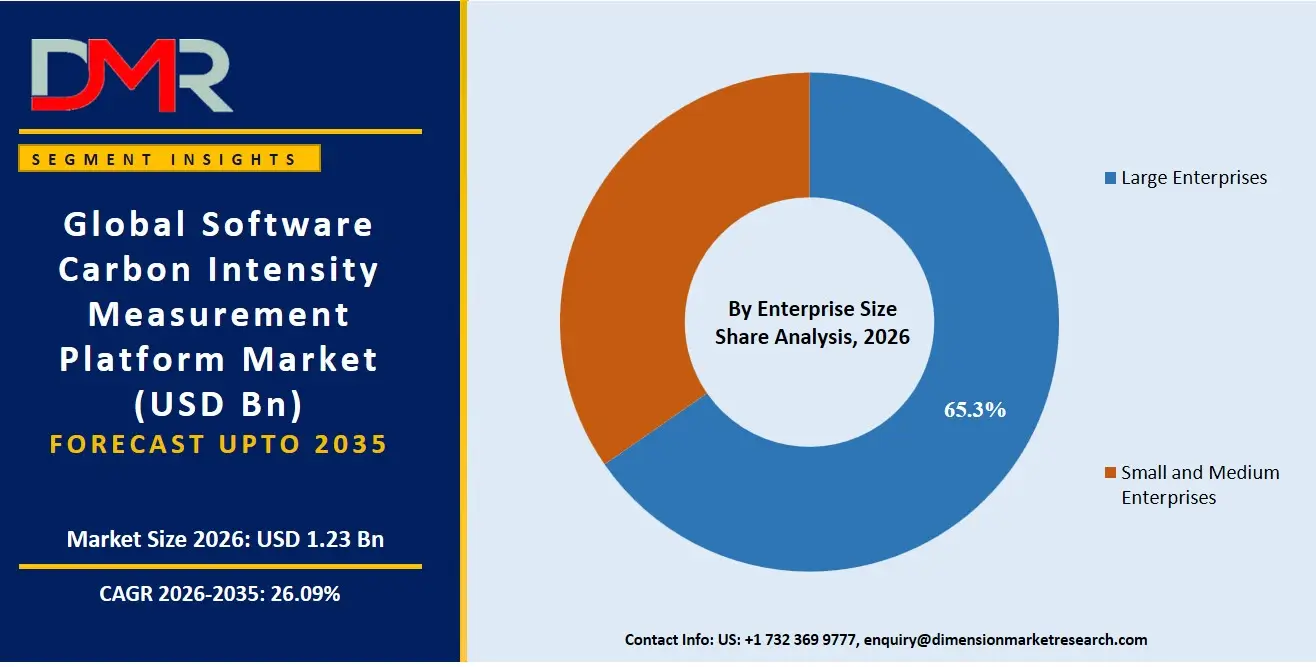
With a 65.34% share in 2026, Large Enterprises outpaced all other enterprise size categories.
ℹ
To learn more about this report –
Download Your Free Sample Report Here
Large enterprises dominate because SCI measurement requires continuous telemetry pipelines, dedicated engineering capacity for functional-unit definition, and internal stakeholders who can translate SCI scores into procurement or product decisions. Only organizations with mature FinOps or sustainability engineering functions can operationalize SCI at the granularity the standard demands. The Aveva SCI case study measured application energy consumption at a precision of 0.01 Watts using a high-precision benchtop power supply, as reported by the Green Software Foundation, confirming that rigorous SCI instrumentation presupposes tooling and expertise that most SMEs do not yet hold.
SMEs represent the growth tier, not the current revenue base. Regulatory relief from the EU Omnibus Directive's CSRD Wave 2 delay removes near-term mandatory pressure on listed SMEs, but large enterprise customers demanding SCI certificates from software vendors in their supply chains will pull SME adoption forward through commercial pressure rather than regulatory obligation. NTT DATA's 3-tier web system SCI case study divides embodied emissions across 35,040 hours across a 4-year lifespan, as reported by the Green Software Foundation, showing that even simplified on-premise deployments can produce standardized SCI outputs usable for supplier attestation. Platforms offering pre-configured SME templates at lower price points will capture this second adoption wave before larger rivals discount enterprise licenses downmarket.
Application Analysis
Cloud and Infrastructure Carbon Measurement accounted for 29.45% of application demand in 2026, the highest of any category.
Cloud and infrastructure measurement leads because hyperscaler workloads represent the largest, most instrumented, and most commercially pressured emissions source within enterprise software estates. Carbon-aware scheduling is migrating from research concept into production scheduling logic. Shifting compute to lower-grid-intensity time windows now runs inside live production schedulers at several hyperscaler-native platforms, giving this application category a performance optimization rationale that extends well beyond compliance reporting.
Software Development Carbon Measurement and AI and High-Performance Compute Emissions Measurement are the fastest-growing application categories. AI workload electricity demand is projected to reach 426 TWh of U.S. data-center use by 2030, elevating per-inference carbon accountability to board-level scrutiny. Carbon Reporting and Benchmarking and Engineering Workflow Integration represent the connective tissue of the platform stack. Buyers that purchase standalone reporting modules today will demand integrated Engineering Workflow connectors within two to three renewal cycles, making cross-sell depth a stronger retention signal than initial contract size.
End-Use Industry Analysis
A 26.84% share made IT and Telecom the clear leader across end-use industry categories in 2026.
IT and Telecom leads because the sector operates the software infrastructure generating the emissions that SCI platforms measure. CIOs and CTOs in this vertical face simultaneous pressure from CSRD Scope 3 Category 1 mandates, hyperscaler carbon reporting requirements, and internal FinOps-to-GreenOps convergence programs that tie carbon telemetry to existing cloud cost-optimization budgets. BFSI follows as the second-largest adopter, driven by investor disclosure obligations and the sector's heavy reliance on cloud-native financial platforms subject to SCI assessment.
Retail and E-Commerce, Industrial Manufacturing, and Energy and Utilities are mid-tier adopters building SCI capacity ahead of supply-chain disclosure requirements. Oil and Gas, Food and Beverage Manufacturing, and Construction and Infrastructure remain early-stage adopters where operational technology emissions dominate over software emissions, limiting immediate SCI relevance. Government and Public Sector adoption is driven by procurement policy rather than market competition, making it a slower but structurally stable revenue source for vendors that invest in public-sector compliance certifications.
Key Market Segments
By Deployment Type
- Cloud-Based Platform
- Hybrid Platform
- On-Premise Platform
By Enterprise Size
- Large Enterprises
- Small and Medium Enterprises
By Application
- Cloud and Infrastructure Carbon Measurement
- Software Development Carbon Measurement
- AI and High-Performance Compute Emissions Measurement
- Carbon Reporting and Benchmarking
- Engineering Workflow Integration
By End-Use Industry
- IT and Telecom
- BFSI
- Retail and E-Commerce
- Industrial Manufacturing
- Energy and Utilities
- Oil and Gas
- Food and Beverage Manufacturing
- Construction and Infrastructure
- Government and Public Sector
Regional Analysis
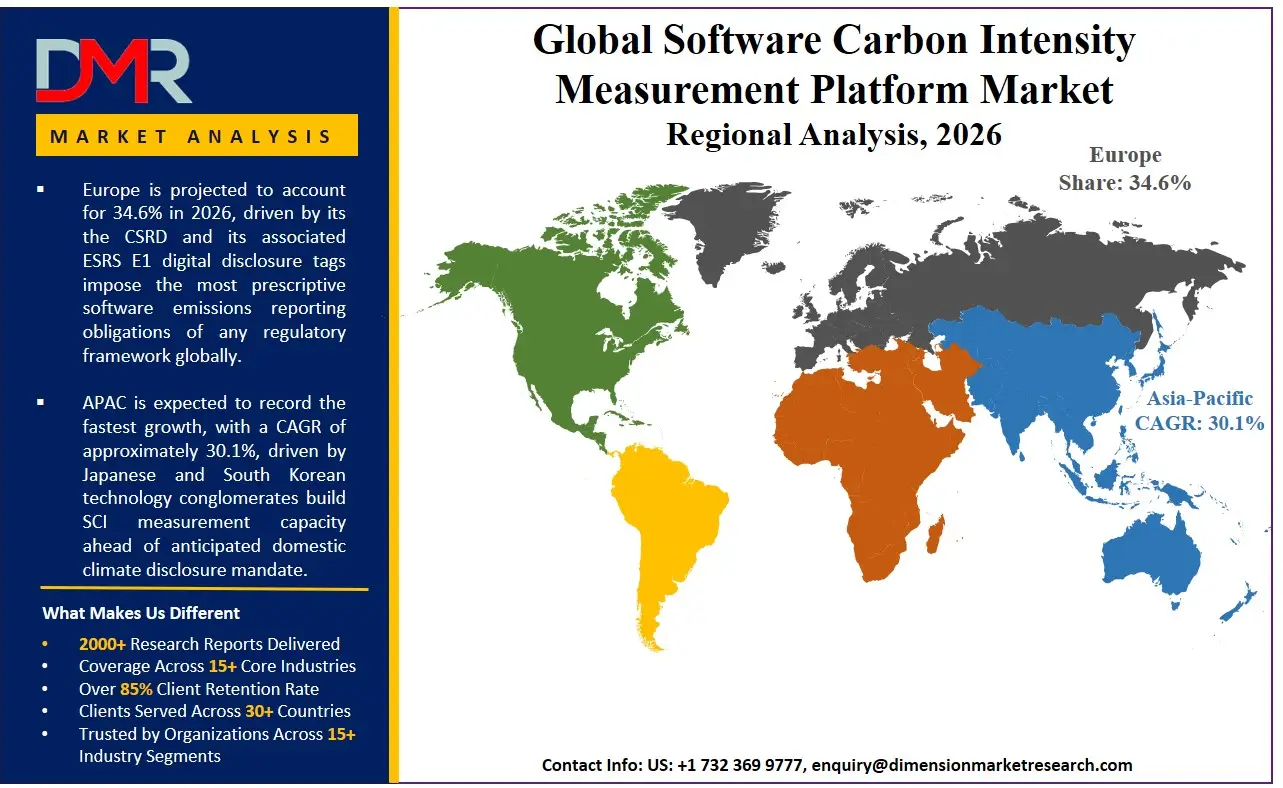
Europe captured 34.63% of global revenue in 2026, the highest share of any region, with an estimated value of USD 0.34 Billion.
ℹ
To learn more about this report –
Download Your Free Sample Report Here
Europe leads because the CSRD and its associated ESRS E1 digital disclosure tags impose the most prescriptive software emissions reporting obligations of any regulatory framework globally. EU-reporting enterprises must quantify cloud, SaaS, and software-service emissions under Scope 3 Category 1, creating a mandatory procurement trigger that no other region currently matches. Germany, France, and the UK concentrate the largest share of CSRD-obligated enterprises, making Western Europe the primary demand center within the region.
North America ranks second, propelled by voluntary ESG disclosure pressure from institutional investors and FinOps-to-GreenOps convergence inside U.S. hyperscaler ecosystems. Asia Pacific is the fastest-growing region, as Japanese and South Korean technology conglomerates build SCI measurement capacity ahead of anticipated domestic climate disclosure mandates. Latin America and Middle East and Africa remain nascent, with adoption concentrated among multinationals operating local subsidiaries subject to parent-company CSRD obligations rather than domestic regulatory drivers. Vendors entering APAC through partnerships with regional system integrators will capture first-mover positioning before compliance mandates crystallize local competitive dynamics.
Key Regions and Countries
North America
Europe
- Germany
- France
- The UK
- Spain
- Italy
- Rest of Europe
Asia Pacific
- China
- Japan
- South Korea
- India
- Australia
- Rest of APAC
Latin America
- Brazil
- Mexico
- Rest of Latin America
Middle East & Africa
- GCC
- South Africa
- Rest of MEA
Market Dynamics
ISO Ratification and CSRD Mandates Create Auditable Procurement Standards
ISO/IEC 21031:2024 converted the SCI specification from a voluntary metric into an auditable, procurement-grade standard for software emissions. Buyers can now require SCI scores in vendor contracts with the same legal standing as financial KPIs. CAST's SCI-based decarbonization analysis estimated that optimizing a single software application reduces annual CO2 emissions by approximately 400 kg, as reported by the Green Software Foundation, giving procurement teams a per-application cost-of-carbon argument that justifies SCI platform spend within existing sustainability budgets.
Autostrade per l'Italia applied SCI calculations across 60 applications and achieved an average 15.1% CO2 saving per application, as reported by the Green Software Foundation. That outcome across a 60-application portfolio demonstrates enterprise-scale repeatability rather than isolated proof-of-concept results. IBM's June 2024 launch of Maximo Emissions Management, integrating with IBM Envizi for operational emissions reporting, further validated that Tier 1 enterprise software vendors treat SCI-aligned measurement as a standard product feature rather than a premium add-on.
Hyperscaler Data Opacity and Regulatory Delays Slow Granular Adoption
AWS withholding free Scope 3 customer carbon data is the single most structurally damaging restraint in Software Carbon Intensity Measurement Platform Market. SCI calculation at the functional-unit level requires granular per-service, per-region energy data that hyperscalers currently monetize or restrict. Multicloud enterprises cannot produce credible SCI scores without that data, forcing reliance on estimated emission factors that auditors and investors are increasingly unwilling to accept as sufficient.
The EU Omnibus Directive's "stop-the-clock" measure delays CSRD Wave 2 to FY2027 and removes listed SMEs from mandatory scope, directly deflating the near-term demand pipeline that vendors had priced into growth projections. Platforms that built sales cycles around SME CSRD urgency must now reposition toward supply-chain commercial pressure or voluntary procurement standards to replace that revenue timing. Vendors that over-indexed on regulatory deadlines rather than operational value will face the sharpest near-term growth-rate compression.
AI Emissions Measurement and CSRD Connectors Open Premium Tier Revenue
Between 67% and 93% of total organizational emissions stem from applications alone, as reported by the Green Software Foundation, making software computation the highest-leverage intervention point in any enterprise decarbonization program. SCI-for-AI lifecycle modules spanning training, fine-tuning, and inference represent the clearest premium pricing opportunity in the market today. Google's 2025 per-prompt Gemini emissions methodology set a public vendor precedent for standardized AI inference carbon disclosure, creating buyer expectation that foundation-model operators will provide SCI-equivalent data as a default procurement input.
Watershed launched Watershed Product Footprints in September 2025, targeting Scope 3 supply-chain emissions with AI-powered measurement across products, materials, and processes. Pre-mapped CSRD Category 1 reporting connectors that translate functional-unit SCI scores directly into ESRS E1 digital disclosure tags represent a second premium tier. Buyers willing to pay for compliance-ready output rather than raw SCI data will generate higher contract values and lower churn, since switching costs rise sharply once audit trails and regulatory filings are embedded in the platform workflow.
Market Trends
Carbon-Aware Engineering Moves From Concept to Production Infrastructure
Autostrade's plan to extend SCI reduction processes from 60 to 250 applications projects a saving of 86.8 kg CO2eq per year — a 14% reduction — as reported by the Green Software Foundation, showing that carbon-aware engineering scales linearly with application portfolio size. Embedded SCI scoring within CI/CD pipelines via the Carbon Aware SDK now captures software emissions at build- and deploy-time rather than through post-hoc reporting. Early movers that instrument their full application portfolios before 2027 will hold benchmarking advantages when per-functional-unit carbon labels become a standard procurement input in enterprise software buying cycles.
Market Competition Overview
The SCI Measurement Platform market is fragmented. No single vendor holds dominant market share, and the competitive field spans pure-play carbon intelligence platforms, ESG disclosure suites with SCI modules, and hyperscaler-native carbon dashboards offered at no incremental cost. Pure-play vendors compete on measurement precision, regulatory connector depth, and AI workflow integration, while hyperscaler-native tools compete on distribution and zero-marginal-cost deployment within existing cloud billing relationships. That asymmetry means pure-play vendors must demonstrate measurably superior SCI granularity to justify per-seat or usage-based pricing against free alternatives.
Consolidation pressure is building. Mid-sized platforms lacking CSRD-ready connectors or AI inference measurement modules face acquisition or margin compression within the next two to three years as buyers rationalize sustainability tooling vendors. Vendors with pre-built integrations into financial reporting systems, CI/CD pipelines, and hyperscaler billing APIs hold the strongest moats against both free hyperscaler tools and enterprise suite incumbents entering the segment through product extensions.
Company Profiles
Watershed Technology, Inc. entered the market as a carbon accounting platform and systematically expanded scope. Watershed raised USD 100 Million in a Series C round in January 2024, led by Greenoaks with Kleiner Perkins and Sequoia participating, valuing the company at USD 1.8 billion. That valuation made Watershed the most valuable climate software firm at the time, giving it capital to move from point-solution carbon accounting into full environmental intelligence through its 2024 acquisition of VitalMetrics. The VitalMetrics acquisition extended Watershed's addressable market beyond carbon into broader environmental data, a positioning shift that creates cross-sell opportunity across existing enterprise accounts while raising the switching cost for buyers who consolidate environmental reporting under a single platform.
Persefoni AI, Inc. built its competitive position around investor-grade carbon disclosure and TCFD-aligned reporting. The March 2024 partnership with Workiva extended Persefoni's reach into the financial reporting stack, connecting carbon data directly with audit-grade financial disclosures for joint enterprise customers. Persefoni's focus on financial-grade auditability positions it as the compliance-first vendor in a market where many competitors lead with engineering or operational tooling, a differentiated approach that targets CFO and audit committee buyers rather than sustainability or engineering teams.
Key Players
- Watershed Technology, Inc.
- Persefoni AI, Inc.
- Normative AB
- Plan A Earth GmbH
- Sweep SAS
- Greenly SAS
- Emitwise Limited
- Asuene Inc.
- 51toCarbonZero Limited
- Key ESG Limited
- FigBytes Inc.
- Novisto Inc.
- Sphera Solutions, Inc.
- Measurabl, Inc.
- Sinai Technologies, Inc.
- CarbonTrail Ltd.
- Brightest GmbH
- Unravel Carbon Pte. Ltd.
- Greenlyte Carbon Technologies GmbH
Regulatory Landscape
The EU Corporate Sustainability Reporting Directive and its associated ESRS E1 standard impose the most granular software emissions disclosure obligations currently active anywhere globally. CSRD Scope 3 Category 1 requires EU-reporting enterprises to quantify cloud, SaaS, and software-service emissions, directly mandating SCI-equivalent measurement for any organization procuring software at scale. ISO/IEC 21031:2024 ratification of the SCI specification elevated the standard from a voluntary framework to an auditable, procurement-grade reference, giving regulators and auditors a named standard to cite in compliance verifications.
The EU Omnibus Directive's "stop-the-clock" measure delays CSRD Wave 2 obligations to FY2027 and removes listed SMEs from mandatory scope. That delay compresses near-term regulatory demand from SMEs but does not affect Wave 1 large enterprises already subject to reporting. Outside Europe, voluntary disclosure frameworks from CDP and TCFD continue to drive adoption in North America and Asia Pacific, with Japan's mandatory climate disclosure rules for listed companies adding regulatory momentum in the APAC region independent of EU timelines.
Investment and White Space Analysis
Investment in the SCI platform ecosystem concentrates at two poles: large infrastructure rounds backing data platforms that support sustainability analytics, and growth-stage rounds for pure-play SCI and carbon intelligence vendors. Climatiq's USD 11.7 million Series A in July 2025 for AI-powered carbon data solutions shows that early-stage capital continues to flow into specialized measurement layers. The white space lies between those poles: mid-market platforms with validated enterprise customers but without the compliance connector depth or AI measurement modules needed to compete for Fortune 500 contracts are the most likely acquisition targets for ESG suite vendors seeking rapid capability expansion.
Geographically, Asia Pacific represents the highest-growth, lowest-competition white space. Japanese and South Korean enterprises are building SCI capacity ahead of domestic disclosure mandates, but few pure-play SCI vendors have established local go-to-market operations in those markets. Vendors that localize compliance mappings for Japanese TCFD and South Korean ESG disclosure frameworks, and price for regional system integrator partnerships, will secure first-mover positioning before European and North American competitors redirect expansion budgets eastward.
Recent Developments
- July 2025, Climatiq raised USD 11.7 Million in a Series A round to accelerate AI-powered carbon data solutions for software emissions measurement.
- December 2025, Diginex Limited signed a non-binding MOU to acquire Plan A Earth GmbH in an all-share deal, targeting consolidation of European AI-powered carbon accounting capabilities.
- March 2024, Salesforce introduced new sustainability features within its Net Zero Cloud platform to help organizations measure, manage, and reduce carbon footprints at the enterprise level.
- June 2024, Workiva launched Workiva Carbon, advancing its ESG platform to support CSRD, SEC climate disclosure, and California SB 253 and SB 261 requirements.
- December 2024, SAP announced general availability of SAP Green Ledger, a carbon accounting solution integrating emissions data directly with financial records for audit-grade, financial-grade insights.
- October 2025, Diginex launched diginexGHG, an AI-automated Corporate Carbon Footprint solution built with Forward Earth to track emissions across all scopes under the GHG Protocol.
Report Details
| Report Characteristics |
| Market Value (2025) |
USD 0.98 Billion |
| Market Value (2026) |
USD 1.23 Billion |
| Forecast Revenue (2035) |
USD 9.91 Billion |
| CAGR (2026–2035) |
26.09% |
| Base Year for Estimation |
2025 |
| Historic Period |
2020 – 2024 |
| Forecast Period |
2026 – 2035 |
| Report Coverage |
Revenue Forecast, Market Dynamics, Competitive Landscape, Recent Developments |
| Segments Covered |
By Deployment Type (Cloud-Based Platform, Hybrid Platform, On-Premise Platform), By Enterprise Size (Large Enterprises, Small and Medium Enterprises), By Application (Cloud and Infrastructure Carbon Measurement, Software Development Carbon Measurement, AI and High-Performance Compute Emissions Measurement, Carbon Reporting and Benchmarking, Engineering Workflow Integration), By End-Use Industry (IT and Telecom, BFSI, Retail and E-Commerce, Industrial Manufacturing, Energy and Utilities, Oil and Gas, Food and Beverage Manufacturing, Construction and Infrastructure, Government and Public Sector) |
| Regional Analysis |
North America – US and Canada; Europe – Germany, France, The UK, Spain, Italy, and Rest of Europe; Asia-Pacific – China, Japan, South Korea, India, Australia, and Rest of APAC; Latin America – Brazil, Mexico, and Rest of Latin America; Middle East & Africa – GCC, South Africa, and Rest of MEA |
| Competitive Landscape |
Watershed Technology Inc., Persefoni AI Inc., Normative AB, Plan A Earth GmbH, Sweep SAS, Greenly SAS, Emitwise Limited, Asuene Inc., 51toCarbonZero Limited, Key ESG Limited, FigBytes Inc., Novisto Inc., Sphera Solutions Inc., Measurabl Inc., Sinai Technologies Inc., CarbonTrail Ltd., Brightest GmbH, Unravel Carbon Pte. Ltd., Greenlyte Carbon Technologies GmbH |
| Customization Scope |
Customization for segments and region or country level will be provided. Additional customization can be done based on requirements. |
| Purchase Options |
Three license options: Single User License, Multi-User License (Up to 5 Users), and Corporate Use License (Unlimited Users and Printable PDF). |
Frequently Asked Questions
What is the biggest investment opportunity in Software Carbon Intensity Measurement Platform Market?
▾ SCI-for-AI lifecycle measurement spanning training, fine-tuning, and inference represents the clearest premium pricing opportunity. AI workload electricity demand in U.S. data centers is projected to reach 426 TWh by 2030, creating board-level accountability pressure that no existing free hyperscaler tool currently addresses at functional-unit granularity. Vendors building dedicated AI inference SCI modules before 2027 will set pricing benchmarks that late entrants will be forced to match.
Who are the top companies in Software Carbon Intensity Measurement Platform Market?
▾ Watershed Technology, Inc. and Persefoni AI, Inc. are the two most capitalized pure-play platforms in the market. Watershed reached a USD 1.8 Billion valuation following its January 2024 Series C and expanded into environmental intelligence through the VitalMetrics acquisition. Persefoni leads on investor-grade audit compliance, targeting CFO and audit committee buyers through its integration with Workiva's financial reporting stack.
Which segment is growing fastest in Software Carbon Intensity Measurement Platform Market and why?
▾ AI and High-Performance Compute Emissions Measurement is the fastest-growing application segment. U.S. data-center electricity demand from AI workloads is projected to reach 426 TWh by 2030, and Google's 2025 per-prompt Gemini emissions methodology established a public vendor precedent for standardized AI inference carbon disclosure. Foundation-model operators and GenAI platform vendors face commercial and reputational pressure to produce verified per-inference SCI scores before enterprise procurement teams begin requiring them contractually.
Which region is growing fastest in Software Carbon Intensity Measurement Platform Market and why?
▾ Asia Pacific is the fastest-growing region. Japanese and South Korean technology conglomerates are building SCI measurement capacity ahead of anticipated domestic climate disclosure mandates, and APAC-headquartered multinationals with European subsidiaries face CSRD obligations regardless of domestic regulatory timelines. Few pure-play SCI vendors have established local APAC go-to-market operations, keeping competitive intensity low relative to the demand signal now building across the region.
What is the biggest challenge holding Software Carbon Intensity Measurement Platform Market back?
▾ Hyperscaler Scope 3 data opacity is the primary structural restraint. AWS withholding free Scope 3 customer carbon data prevents enterprises from computing granular functional-unit SCI scores across multicloud estates. Without per-service, per-region energy data from major cloud providers, SCI platforms must rely on estimated emission factors that auditors and institutional investors are increasingly unwilling to accept as sufficient for regulated disclosure purposes.