Market Overview
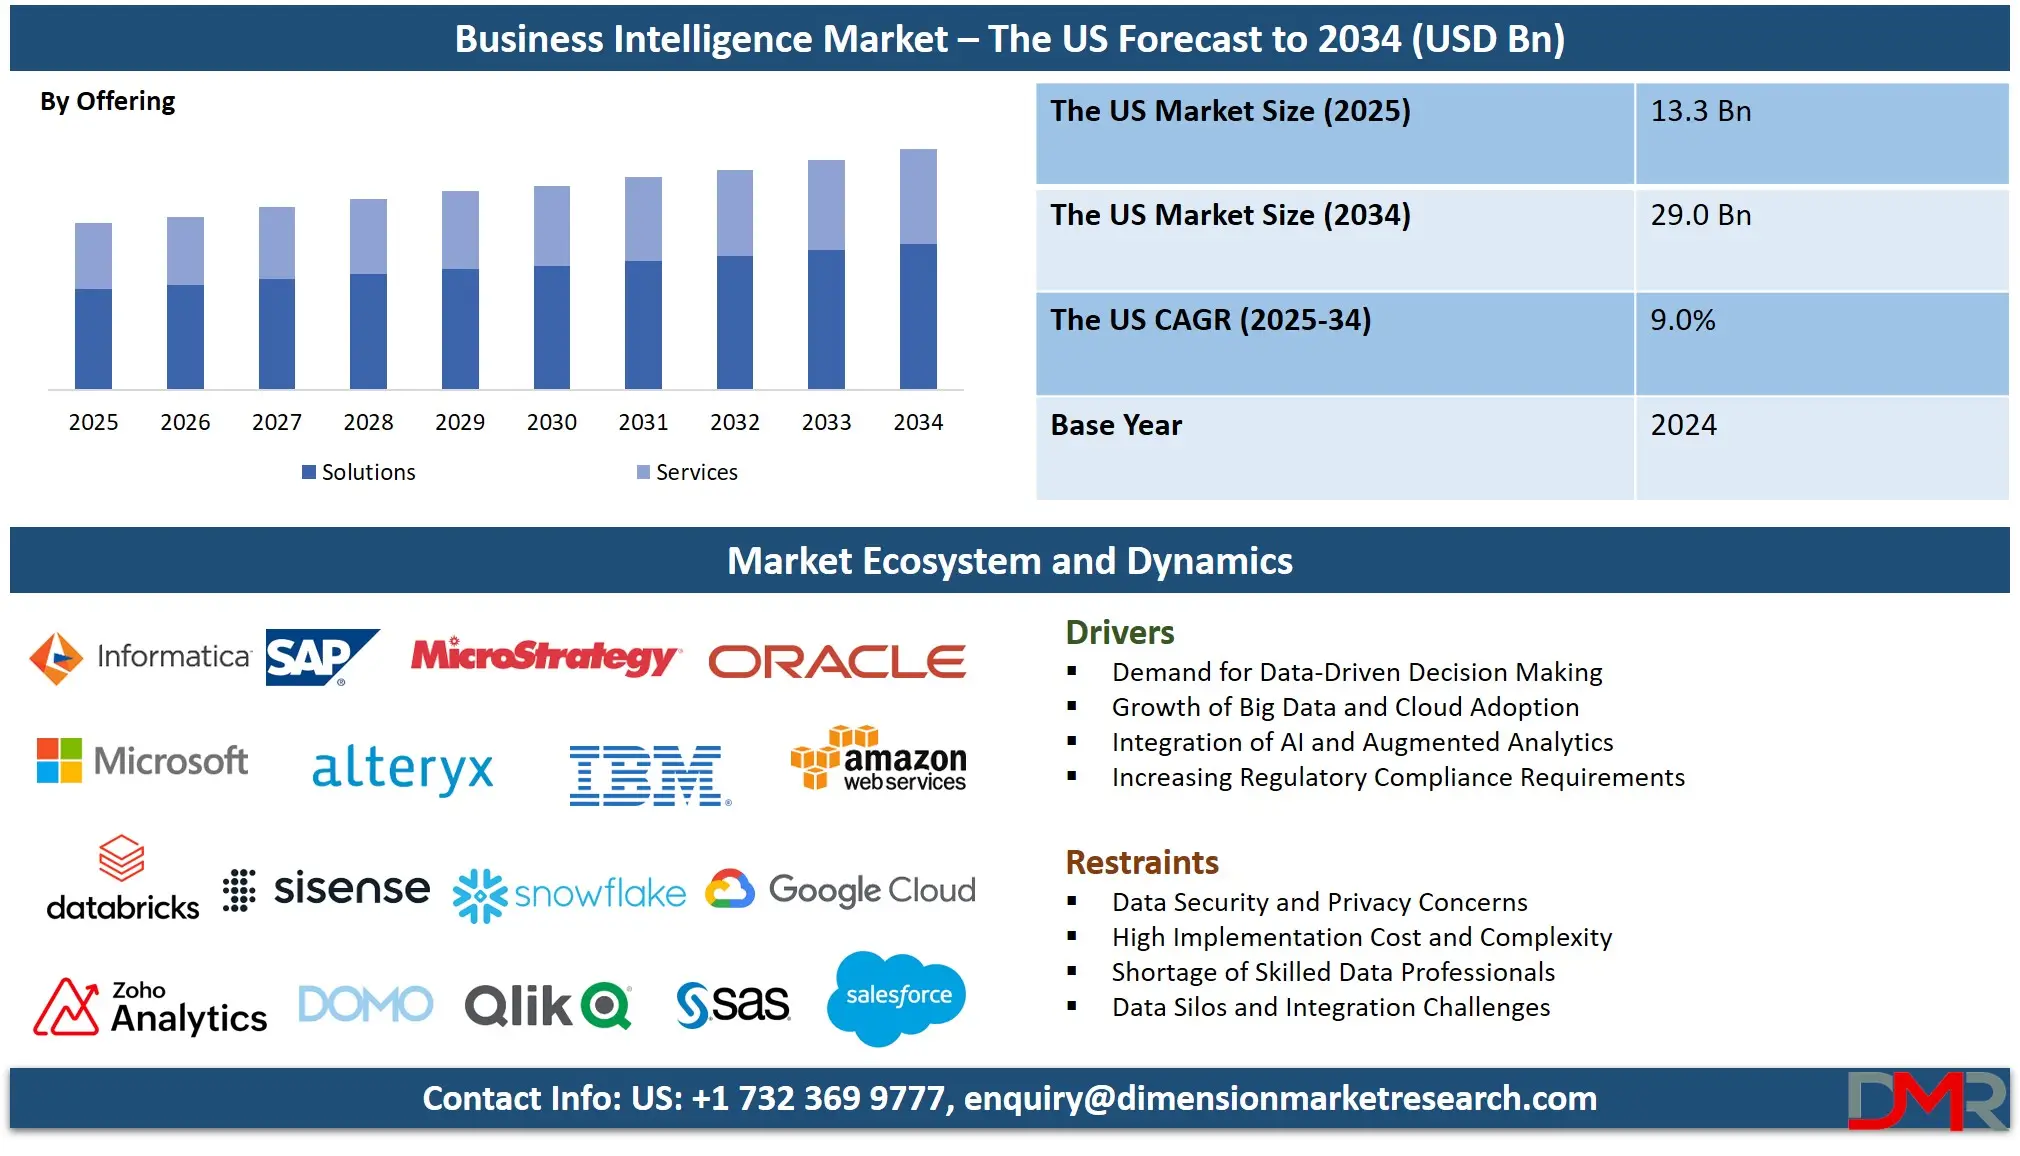
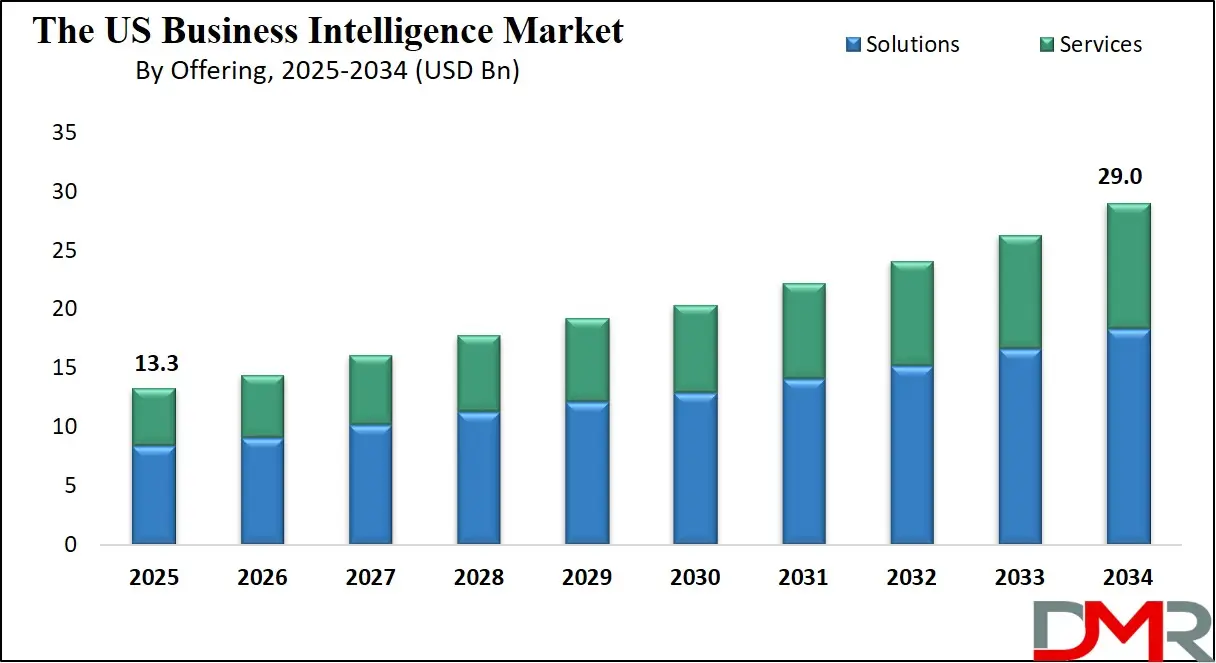
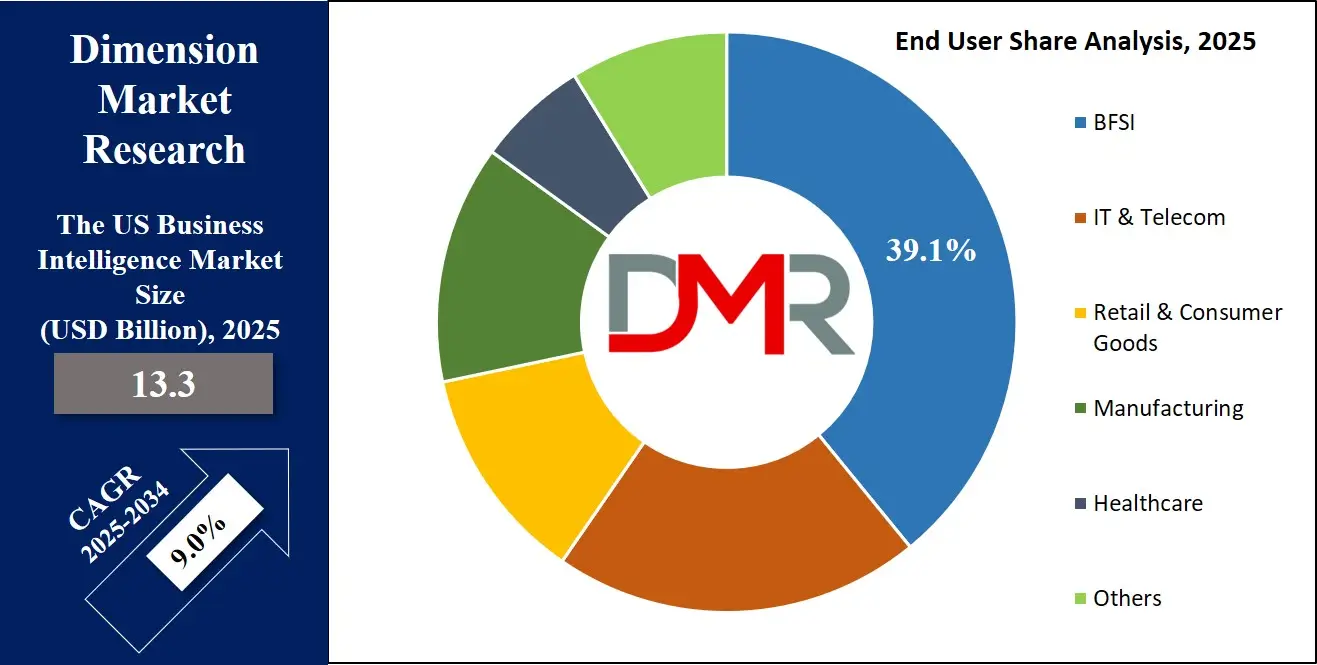
The US Business Intelligence (BI) Market is anticipated to reach USD 13.3 billion in 2025, driven by the exponential growth of enterprise data, the critical need for data-driven decision-making, and the accelerated transition towards cloud-native, AI-powered analytics across all industries. The market is expected to expand at a robust compound annual growth rate (CAGR) of 9.0% from 2025 to 2034, reaching a projected value of USD 29.0 billion by 2034.
This robust growth is fueled by the widespread migration to cloud-native, AI-infused BI platforms, stringent regulatory and compliance demands (including CCPA, SEC, and sector-specific rules), and the competitive imperative to harness real-time and predictive insights for enhancing operational agility, customer experience, and financial performance. Furthermore, the expanding application of BI in supply chain resilience, advanced customer analytics, and ESG (Environmental, Social, and Governance) reporting is creating significant new momentum for market expansion.
The US BI ecosystem is rapidly evolving from static, IT-controlled reporting environments to democratized, intelligent analytics networks. A pivotal trend is the strategic integration of generative AI, natural language processing (NLP), and automated machine learning (AutoML) directly into core BI platforms. This convergence is creating "intelligence hubs" that offer conversational querying, automated insight generation, and personalized data storytelling, fundamentally lowering the barrier to advanced analytics for business users.
This shift is critical for fostering a pervasive data culture and enabling faster, more confident decisions across decentralized and hybrid work models. Concurrently, BI providers are embedding augmented analytics capabilities that proactively surface anomalies, trends, and prescriptive recommendations, transforming platforms from descriptive tools into proactive business advisors. The fusion of predictive and prescriptive analytics with real-time data streams is optimizing complex processes from dynamic pricing and fraud detection to predictive maintenance and hyper-personalized marketing across the diverse US industrial landscape.
The market's trajectory is underscored by substantial opportunities in vertical-specific and embedded analytics solutions. While financial analytics remains a cornerstone, high-growth potential lies in developing sophisticated applications for healthcare patient journey analytics, retail merchandising optimization, and industrial IoT performance monitoring. Large Enterprises continue to be the primary drivers of market revenue, deploying comprehensive, often multi-cloud BI strategies to achieve a single source of truth and manage intricate regulatory reporting.
Simultaneously, Small and Medium-sized Businesses (SMBs) represent the fastest-growing adopter segment, empowered by affordable, user-friendly, cloud-based BI services that require minimal IT overhead. These solutions are proving transformative, enabling SMBs to compete analytically with larger rivals by optimizing operations, understanding customer behavior, and managing growth with data-driven precision.
The US Business Intelligence Market: Key Takeaways
- US Market Size Insights: The US Business Intelligence Market is projected to be valued at USD 13.3 billion in 2025. It is expected to witness subsequent growth in the upcoming period, reaching a projected value of USD 29.0 billion in 2034.
- The US Market Growth Rate: The market is growing at a CAGR of 9.0 percent over the forecasted period from 2025 to 2034.
- Key Drivers: Growth is primarily fueled by the exponential growth of big data and IoT, the integration of AI/ML for augmented analytics, increasing demand for data-driven decision-making across functions, and stringent data security and compliance requirements.
- Competitive Landscape: The market is highly competitive and features a mix of global enterprise software giants (Microsoft, Salesforce, SAP), specialized BI and analytics vendors (Tableau, Qlik), hyperscale cloud platforms (AWS, Google Cloud, Microsoft Azure), and regional system integrators and consultants.
- Segment Insights: Within offerings, Solutions, particularly Data Integration & ETL and Reporting & Visualization, are the largest components, while Financial Performance & Strategy Management remains a dominant application segment due to universal need for profitability and performance insights.
The US Business Intelligence Market: Use Cases
- AI-Powered Demand Sensing for a National Retailer: A major US retail chain implements an integrated BI and AI platform featuring real-time dashboards and predictive analytics models. The system analyzes point-of-sale, weather, and social sentiment data to forecast demand at a hyper-local level, enabling dynamic inventory replenishment and personalized promotional campaigns, significantly reducing stockouts and markdowns.
- 360-Degree Patient Analytics for a Healthcare Network: A large hospital system deploys a cloud-based BI solution with stringent HIPAA-compliant data governance. The platform unifies electronic health records (EHR), claims data, and operational metrics, providing clinicians and administrators with dashboards on patient outcomes, resource utilization, and population health trends, driving improvements in care quality and cost management.
- Real-Time Fraud Detection for a Financial Services Firm: A US-based bank adopts an AI-enhanced BI platform specializing in anomaly detection. The system monitors millions of transactions in real-time, using machine learning to identify patterns indicative of fraud or money laundering, generating automated alerts for investigators and streamlining compliance reporting to regulators like FinCEN.
- Predictive Maintenance in Aerospace Manufacturing: An aircraft manufacturer utilizes an IoT-enabled BI platform with sensors embedded in assembly line machinery. ML algorithms analyze vibration, temperature, and throughput data to predict equipment failures before they occur, scheduling pre-emptive maintenance during planned downtimes, which enhances overall equipment effectiveness (OEE) and prevents costly production delays.
- SMB Growth Dashboard via Cloud BI: A mid-sized software-as-a-service (SaaS) company subscribes to a comprehensive cloud BI service with pre-built connectors to Salesforce, QuickBooks, and Google Analytics. The leadership team uses self-service dashboards to track customer acquisition cost (CAC), lifetime value (LTV), churn rate, and burn rate in real-time, enabling agile, data-informed strategic and fundraising decisions without dedicated data staff.
The US Business Intelligence Market: Stats & Facts
U.S. Bureau of Labor Statistics (BLS)
- The median annual wage for Data Scientists was USD 112,590 in May 2024.
- About 245,900 people were employed as Data Scientists in the most recent BLS estimate.
- Projected employment growth for Data Scientists is +34% for the 2024–2034 decade.
- The median annual wage for Computer & Information Technology occupations (group) was USD 105,990 in May 2024.
- The median annual wage for Computer and Information Systems Managers was USD 171,200 in May 2024.
- Employment in Computer Systems Design & Related Services (NAICS 5415) was about 2,530,820 employees with a median hourly wage of USD 49.86 (May snapshot).
O*NET / Department of Labor
- O*NET lists the Data Scientist occupation (15-2051.00) with employment and wage estimates consistent with the BLS numbers above.
- BLS employment projections materials included skills and occupation detail for hundreds of occupations in the latest release.
Bureau of Economic Analysis (BEA)
- BEA reports that software spending rose from roughly 1.2% of real GDP in 2007 to about 3.6% of real GDP in 2023.
- BEA estimates business software spending grew at an average annual real rate of approximately 9.3% between 2007 and 2023.
- BEA’s “digital economy” reporting showed real gross output of the digital economy grew about 7.1% in 2022 and averaged roughly 6.3% annual growth from 2017–2022.
U.S. Census Bureau (CBP / SUSB) & FRED (St. Louis Fed)
- The Census Bureau’s County Business Patterns and SUSB provide annual counts of firms and establishments by NAICS, which show Computer Systems Design & Related Services is a large employer within professional services.
- A reported total revenue figure for Computer Systems Design & Related Services (NAICS 5415) in the referenced service surveys was shown as 648,805 for 2022 in the cited series.
- CBP/SUSB industry tables are the primary federal source for establishment, employment and payroll counts used by BI teams for market sizing and regional analysis.
Data.gov (U.S. open data portal)
- Data.gov lists about 364,505 datasets across federal and partner catalogs that are commonly used to build public-sector dashboards and analytics.
U.S. Small Business Administration (SBA)
- New business applications in the U.S. reached an aggregate of roughly 16 million in the 2021–2023 period, with a monthly average near 440,000 applications in that interval.
National Institute of Standards and Technology (NIST)
- NIST lists Artificial Intelligence and trustworthy-AI testing and evaluation as priority program areas that support enterprise analytics and model governance.
- NIST 2023/2024 guidance and reports emphasize measurement, testing and standards work that federal and industry BI/security teams adopt for model governance.
Federal Data Strategy / White House data efforts
- The Federal Data Strategy establishes a 10-year vision to accelerate federal use of data for mission delivery and accountability, which underpins federal BI modernization.
- White House data and equitable-data working group reports document agency steps to improve data governance and interoperability, increasing federal demand for BI tools and dashboards.
Federal Reserve / FRED (economics & software investment)
- FRED tags and series indicate there are on the order of 1,759 economic data series related to “software,” which are often used in macro BI dashboards.
- BEA and Federal Reserve statistics show private fixed investment in information processing equipment and software represents a material share of business investment, with the IPP investment category representing about 31.3% of private fixed investment in a recent quarter cited in BEA discussions.
National Science Foundation (NSF) — Annual Business Survey (ABS)
- The NSF Annual Business Survey provides official federal estimates of business R&D and innovation by industry and shows Computer Systems Design and related professional services among industries performing substantial business R&D.
Office of Management & Budget (OMB) / Federal IT oversight
- OMB policies such as “Cloud Smart” and Federal Data Strategy implementation guidance require agencies to increase enterprise analytics, centralized dashboards and cloud services, driving procurement of BI and analytics capabilities.
The US Business Intelligence Market: Market Dynamic
Driving Factors in the US Business Intelligence Market
Convergence of AI, Cloud, and Real-Time Data Processing
A dominant force is the market's rapid consolidation around platforms that unify data ingestion, AI/ML model deployment, and interactive visualization in a seamless, often cloud-native, architecture. US businesses are demanding integrated intelligence environments to break down silos between historical reporting and real-time operational data.
This convergence is critical for cross-functional orchestration such as correlating marketing spend with supply chain fulfillment and for responding with agility to market shifts. Regulatory pressures for transparency and investor expectations for data-driven governance further accelerate investment in platforms capable of aggregating, cleansing, and analyzing data from diverse sources, including SaaS applications, IoT networks, and legacy on-premises systems, to deliver a holistic, trustworthy view of business performance.
Democratization through Augmented and Low-Code Analytics
A powerful adoption catalyst is the proliferation of AI-augmented analytics and low-code/no-code development tools within BI platforms. Features like natural language querying ("Ask Your Data"), automated insight generation, and smart data preparation are moving from premium add-ons to standard offerings. This formalizes advanced analytics as an everyday business process, empowering line-of-business users.
Simultaneously, intuitive drag-and-drop interfaces for building dashboards and data apps allow business units to create their own solutions with minimal IT support. Platforms that successfully integrate these democratized capabilities into a governed workflow deliver significant value by shortening decision cycles and embedding data literacy into the organizational culture.
Restraints in the US Business Intelligence Market
Legacy System Integration and Data Fragmentation
A persistent and significant challenge is the complex reality of integrating modern BI solutions with legacy enterprise systems and fragmented data architectures prevalent across many US corporations. IT departments face substantial costs, resource demands, and technical complexity in connecting new cloud BI tools with older ERP, CRM, and custom databases.
This creates a critical imperative for strategic data management and middleware investments. Business leaders are increasingly viewing modern data integration and BI platforms as essential strategic assets for breaking down data silos, ensuring high data quality, and establishing a single source of truth, directly targeting the inefficiencies and risks associated with decisions made on incomplete or inconsistent information.
Intensifying Talent Shortage and Evolving Skill Requirements
The accelerated transition to data-centric operating models and the rising sophistication of BI/AI tools act as both a driver and a significant barrier. While corporate digital transformation initiatives and internal data literacy programs are reducing usage barriers, they also highlight acute shortages of personnel with skills in data engineering, data science, and change management.
These strategic efforts are actively funding analytics projects and clarifying data stewardship roles, which de-risks investment for some organizations. However, the competition for specialized analytics talent remains fierce, potentially stalling or limiting the scope of BI implementations, especially for companies outside major tech hubs.
Opportunities in The US Business Intelligence Market
Advanced AI/ML for Prescriptive and Autonomous Decision Support
The application of advanced AI and machine learning to move beyond predictive analytics into prescriptive and autonomous decision-making represents a high-value frontier. The next wave involves systems that not only forecast market trends or operational failures but also recommend optimized actions, simulate outcomes, and, in rule-bound cases, execute decisions automatically.
Applications in autonomous supply chain orchestration, AI-driven customer service routing, and algorithmic financial trading or risk hedging can deliver transformative efficiency and competitive advantages. Vendors that can embed these sophisticated, yet explainable, AI capabilities into user-friendly platforms will capture premium market opportunities, particularly with enterprises focused on strategic agility and operational autonomy.
Proliferation of Embedded Analytics and Vertical Solution Bundles
While horizontal BI tools are mature, substantial greenfield opportunity exists in embedded analytics and deeply verticalized applications. This includes embedding interactive analytics directly into widely-used SaaS platforms (e.g., within CRM, HR, or service management applications), providing real-time operational intelligence for field service or logistics managers, and developing industry-specific analytic applications for sectors like healthcare (clinical trial analysis), retail (assortment optimization), or energy (carbon emission tracking).
Platforms that offer robust APIs, real-time data streaming capabilities, and pre-built domain-specific content packs will address critical unmet needs. The development of embedded analytics SDKs and vertical solution bundles in partnership with industry experts presents a major avenue for growth and differentiation.
Trends in The US Business Intelligence Market
Escalating Integration Complexity and Data Governance Demands
A major ongoing challenge is the significant technical and organizational complexity of implementing modern BI in heterogeneous IT environments. Achieving seamless data integration across cloud and on-premises systems, while maintaining high standards of data quality, security, and governance, requires substantial ongoing investment in data engineering, master data management (MDM), and cross-functional collaboration.
These hurdles are compounded by the lack of standardized data models across industries and varying levels of data maturity between organizations. For many, this results in high implementation costs, prolonged time-to-value, and user dissatisfaction when promises of instant insights meet the reality of data wrangling, which can derail projects, especially in SMBs with constrained resources.
Intensifying Scrutiny on Business Value and Tangible ROI
Despite recognized strategic importance, justifying continued and expanding investment in advanced BI capabilities remains a hurdle. While core reporting is considered a necessity, the ongoing costs of enterprise platform licenses, complex data integration projects, specialized staffing, and continuous user training face rigorous financial scrutiny.
Closely linked is the persistent challenge of quantifying a clear and attributable Return on Investment (ROI). While benefits like "better decision-making" and "increased agility" are acknowledged, translating them into immediate, hard-dollar cost savings or revenue uplift for a specific business unit can be difficult. This often leads to more protracted, risk-averse procurement cycles and demands for phased, proof-of-value deployments.
The US Business Intelligence Market: Research Scope and Analysis
By Offering Analysis
Solutions projected to constitute the dominant and core value segment of the US BI market, projected to hold the largest revenue share. This category encompasses the essential software platforms and tools that form the technological foundation for data-driven decision-making. Dashboards & Scorecards are pivotal for providing executives and managers with real-time, visual performance monitoring against key performance indicators (KPIs), enabling swift strategic adjustments.
Data Integration & ETL (Extract, Transform, Load) tools serve as the critical data backbone, tasked with ingesting, cleansing, and harmonizing data from a vast array of disparate sources from legacy mainframes and ERP systems to modern cloud APIs and IoT sensor streams. This process is fundamental to creating a reliable, unified data foundation.
Reporting & Visualization Platforms democratize data access by enabling both technical and business users to create, distribute, and consume static reports and highly interactive data explorations, transforming complex datasets into intuitive visual narratives. Query & Analysis Tools empower data-savvy users and analysts to perform ad-hoc, deep-dive investigations without reliance on predefined reports.
The sustained demand for these solutions is driven by the universal business imperative to convert sprawling, raw data into actionable, consumable intelligence that drives efficiency, innovation, and competitive advantage. As data volumes and varieties explode, the sophistication and necessity of these core software components only intensify.
By Deployment Analysis
Cloud-based deployment is unequivocally expected to dominate and fastest-growing model in the US, projected to capture an overwhelming majority of market share. Its ascendancy is fueled by technological, economic, and operational advantages perfectly aligned with modern business needs. The cloud model offers elastic scalability, allowing organizations to seamlessly adjust compute and storage resources in line with data growth and user demand, eliminating the need for costly, periodic infrastructure refreshes.
It transforms large upfront capital expenditure (CapEx) into predictable operating expenses (OpEx) via the subscription-based Software-as-a-Service (SaaS) model, a critical factor for financial planning and agility. Automatic, seamless updates ensure all users have immediate access to the latest features, performance enhancements, and security patches without disruptive and expensive upgrade projects. Ubiquitous accessibility from any location or device robustly supports remote, hybrid, and distributed work models, fostering enterprise-wide collaboration.
Crucially, major US-based cloud providers offer the most advanced global security and compliance certifications, directly addressing the stringent data protection requirements of heavily regulated industries like finance and healthcare. This ecosystem effectively democratizes enterprise-grade analytics, enabling a small or medium-sized business to leverage the same powerful BI, AI, and data warehousing capabilities as a Fortune 500 company through a scalable, pay-as-you-go subscription, thereby leveling the competitive playing field.
By Organization Size Analysis
Large Enterprises are anticipated to poised to remain the primary revenue contributors and most sophisticated users in the BI market. These organizations manage complex, often global operations that generate massive volumes of data across numerous siloed departments, legacy systems, and acquisitions. Their use of BI is comprehensive and strategic, focusing on enterprise-wide data consolidation to achieve a trusted single source of truth, advanced predictive and prescriptive modeling for long-range planning and risk management, and complex, auditable reporting to satisfy stringent regulatory and stakeholder demands.
They typically invest in comprehensive, often multi-vendor or custom-configured BI platforms capable of handling extreme data volumes, integrating with a wide suite of enterprise applications (SAP, Oracle, Salesforce), and supporting thousands of concurrent users. Conversely, Small and Medium-sized Businesses (SMBs) represent the segment with the highest growth rate.
This surge is driven almost exclusively by the proliferation of affordable, cloud-based, and user-friendly BI solutions. These platforms offer pre-built connectors to popular business applications (e.g., QuickBooks, Shopify, Google Workspace), intuitive drag-and-drop interfaces, and subscription pricing that eliminates large upfront software licenses and hardware costs. For SMBs, modern BI tools act as a strategic force multiplier, enabling them to optimize core operations, gain deep customer insights, and manage financial performance with a level of analytical rigor previously accessible only to larger competitors, all without requiring a large, dedicated in-house data team. This access is transformative for their agility and market competitiveness.
By Application Analysis
Financial Performance & Strategy Management are poised to remain the dominant and most universal application segment. It is the cornerstone of corporate intelligence, essential across all industries for mission-critical functions like enterprise budgeting, rolling forecasting, profitability analysis (by product, region, channel), financial consolidation, and regulatory/board reporting.
BI tools automate and enhance these processes, providing CFOs, finance teams, and executives with real-time visibility into revenue, costs, margins, cash flow, and key financial ratios, enabling proactive financial control and strategic pivots. Supply Chain Analytic Applications have become critically important, especially in manufacturing, retail, and logistics, for end-to-end logistics optimization, intelligent inventory management, demand sensing and forecasting, and supplier risk/performance analysis.
They provide vital visibility, resilience, and cost mitigation in complex global networks. CRM Analytics Operations are revenue-centric, focusing on sales pipeline and performance tracking, customer segmentation and lifetime value analysis, marketing campaign attribution and ROI measurement, and service analytics to drive growth, retention, and customer experience improvements.
Production Planning Analytic Operations are key for discrete and process manufacturers to optimize production schedules, improve quality control through statistical process control (SPC), and implement predictive maintenance strategies, thereby maximizing asset utilization and minimizing unplanned downtime.
The Others category encompasses a rapidly growing range of applications, including Human Capital analytics for talent acquisition and retention, ESG (Environmental, Social, Governance) analytics for sustainability reporting, and Risk Management analytics for identifying operational, cybersecurity, or compliance threats, indicating the expanding permeation of BI across all business functions.
By End User Analysis
The BFSI (Banking, Financial Services, and Insurance) sector is poised to a leading and sophisticated end-user, leveraging BI as a mission-critical tool for credit risk modeling, fraud detection and AML, customer 360-degree profiling, regulatory compliance (e.g., CCAR, Basel III), and investment portfolio performance analysis. The data-intensive and highly regulated nature of finance makes advanced, explainable BI indispensable.
Healthcare & Life Sciences organizations are rapidly adopting BI for operational efficiency (staffing, equipment utilization), clinical outcome and population health analysis, pharmaceutical R&D analytics, and financial performance management amidst rising cost pressures and value-based care models. Retail & Consumer Goods relies heavily on BI for omnichannel inventory analysis and optimization, granular sales and margin forecasting, understanding customer buying behavior and sentiment, and personalizing marketing and merchandising efforts at scale.
Manufacturing employs BI for end-to-end supply chain visibility, operational efficiency monitoring (OEE), predictive maintenance of machinery, quality assurance analytics, and sustainability tracking. Technology & Telecom companies utilize BI for network performance monitoring, predicting and reducing customer churn, optimizing service quality, analyzing product usage patterns, and managing SaaS metrics.
The Others category includes vital sectors like Energy & Utilities (for smart grid and asset analytics), Transportation & Logistics (for route and fleet optimization), and the Public Sector (for performance tracking and citizen service analytics), demonstrating the pervasive and expanding utility of business intelligence across the entire US economy.
The US Business Intelligence Market Report is segmented on the basis of the following:
By Offerings
- Solutions
- Dashboards & Scorecards
- Data Integration & ETL
- Reporting & Visualization
- Query & Analysis
- Services
- Consulting
- Deployment & Integration
- Support & Maintenance
By Deployment
By Organization Size
By Application
- Supply Chain Analytic Applications
- CRM Analytics Operations
- Financial Performance & Strategy Management
- Production Planning Analytic Operations
- Others
By End User
- BFSI
- IT & Telecom
- Retail & Consumer Goods
- Manufacturing
- Healthcare
- Others
Impact of Artificial Intelligence in the US Business Intelligence Market
- Automation and Faster Insights: AI significantly enhances U.S. business intelligence by automating data processing, reducing manual workloads, and delivering faster insights. Organizations gain real-time visibility, improved accuracy, and streamlined analytics workflows, enabling better strategic decision-making across increasingly complex and competitive business environments.
- Stronger Predictive Capabilities: AI-powered predictive analytics enables U.S. companies to forecast market shifts, customer behaviors, and operational risks with greater accuracy. This strengthens strategic planning, enhances resilience, and supports proactive decision-making, giving organizations a competitive advantage in fast-changing domestic business landscapes.
- Conversational and Accessible Analytics: AI-driven conversational analytics allows employees to query data using natural language, making business intelligence more accessible. This democratizes insights, reduces dependence on technical teams, increases organizational agility, and empowers broader participation in data-informed decision-making across diverse U.S. industries.
- Personalized BI Experiences: AI enhances personalization in BI platforms by tailoring dashboards, alerts, and recommendations to user roles. This contextual intelligence improves relevance, minimizes information overload, supports targeted decision-making, and helps U.S. organizations maintain operational focus in increasingly dynamic and data-rich.
- Scalability and Performance Improvement: AI enables greater scalability in U.S. BI systems by processing massive data volumes from cloud, IoT, and enterprise sources. This enhances performance, supports complex analytics workloads, and allows organizations to adapt quickly as data demands and competitive pressures.
The US Business Intelligence Market: Competitive Landscape
The competitive landscape of the US Business Intelligence market is intensely dynamic and innovation-driven, characterized by a convergence of global software powerhouses, pure-play analytics innovators, hyperscale cloud platforms, and a deep bench of consulting and system integration partners.
Established Software Giants like Microsoft (Power BI), Salesforce (Tableau), Oracle, and SAP leverage their massive installed bases, extensive enterprise application ecosystems, and cloud infrastructure to offer deeply integrated, enterprise-grade analytics suites. Specialized Analytics Vendors (e.g., Qlik, ThoughtSpot, SAS Institute, MicroStrategy) compete by offering best-in-class, user-centric platforms renowned for superior data visualization, associative analytics engines, and advanced, governed self-service capabilities.
Hyperscale Cloud Providers (AWS, Google Cloud, Microsoft Azure) play a pivotal and expanding dual role: as the dominant infrastructure partners hosting BI workloads and as platform providers offering tightly integrated data warehousing (Snowflake, BigQuery, Redshift, Synapse), AI/ML services, and native analytics tools (QuickSight, Looker, Power BI) that form the core of modern data stacks.
Global and Domestic System Integrators and Consultancies (Accenture, Deloitte, IBM Consulting, Slalom) are critical enablers in the market, providing essential implementation, customization, integration, change management, and strategic data advisory services. Competition is fierce and centers on which vendors and partners can most effectively deliver a combination of ease-of-use for business users, powerful AI/ML capabilities for data experts, seamless integration into complex tech stacks, and demonstrable, measurable business value and ROI.
Some of the prominent players in the US Business Intelligence Market are
- Microsoft
- Salesforce
- Qlik
- Oracle
- SAP
- IBM
- SAS Institute
- Google
- Amazon Web Services
- MicroStrategy
- Alteryx
- Domo
- Snowflake
- Databricks
- ThoughtSpot
- Sisense
- TIBCO Software
- Informatica
- Zoho Analytics
- Other Key Players
Recent Developments in the US Business Intelligence Market
- January 2025: Microsoft launched Microsoft Fabric Copilot for general availability in the US market, deeply integrating generative AI across its data and BI platform to automate code, report, and data pipeline generation, significantly accelerating time-to-insight.
- December 2024: Salesforce announced the full integration of Tableau GPT capabilities into its Customer 360 platform, enabling conversational analytics and automated insight generation directly within sales, service, and marketing workflows for US enterprises.
- November 2024: AWS unveiled major enhancements to Amazon QuickSight Q, its generative BI assistant, introducing multi-step reasoning for complex queries and industry-specific analytics templates for retail and financial services clients, aiming to simplify predictive analytics.
- October 2024: A consortium of leading US healthcare providers and payers announced a collaborative initiative to develop and adopt a shared BI and data model framework for patient outcome and cost analytics, aiming to improve interoperability and value-based care measurement.
- September 2024: Google Cloud expanded the capabilities of Looker Studio with new real-time data streaming connectors and enhanced machine learning integrations, specifically targeting US manufacturing and logistics companies for operational intelligence.
- August 2024: Snowflake and Salesforce deepened their strategic partnership, announcing native integration of Snowflake's Data Cloud with Tableau, enabling secure, governed, and high-performance analytics on live data for joint customers.
- May 2024: Oracle launched Oracle Analytics Cloud with AI Assistants for the US market, featuring new natural language data preparation and automated narrative generation tools designed to simplify analytics for business users across its ERP and HCM application suites.
Report Details
| Report Characteristics |
| Market Size (2025) |
USD 13.3 Bn |
| Forecast Value (2034) |
USD 29.0 Bn |
| CAGR (2025–2034) |
9.0% |
| Historical Data |
2019 – 2024 |
| Forecast Data |
2026 – 2034 |
| Base Year |
2024 |
| Estimate Year |
2025 |
| Report Coverage |
Market Revenue Estimation, Market Dynamics, Competitive Landscape, Growth Factors and etc. |
| Segments Covered |
By Offering (Solutions, Services), By Deployment (Cloud, On-premises), By Organization Size (SMEs, Large Enterprises), By Application (Supply Chain Analytic Applications, CRM Analytics Operations, Financial Performance & Strategy Management, Production Planning Analytic Applications, Others), By End User (BFSI, IT & Telecom, Retail & Consumer Goods, Manufacturing, Healthcare, Others) |
| Regional Coverage |
The US |
| Prominent Players |
Microsoft, Salesforce, Qlik, Oracle, SAP, IBM, SAS, Google, AWS, MicroStrategy, Salesforce, Alteryx, Domo, Snowflake, Databricks, ThoughtSpot, Sisense, TIBCO, Informatica, Zoho, and Other Key Players |
| Purchase Options |
We have three licenses to opt for: Single User License (Limited to 1 user), Multi-User License (Up to 5 Users) and Corporate Use License (Unlimited User) along with free report customization equivalent to 0 analyst working days, 3 analysts working days and 5 analysts working days respectively. |
Frequently Asked Questions
The US Business Intelligence Market size is estimated to have a value of USD 13.3 billion in 2025 and is expected to reach USD 29.0 billion by the end of 2034.
The market is growing at a CAGR of 9.0 percent over the forecasted period from 2025 to 2034.
Some of the major key players are Microsoft, IBM, Oracle, SAP, Amazon Web Services, Google LLC, and Tableau (Salesforce), and many others.