Market Overview
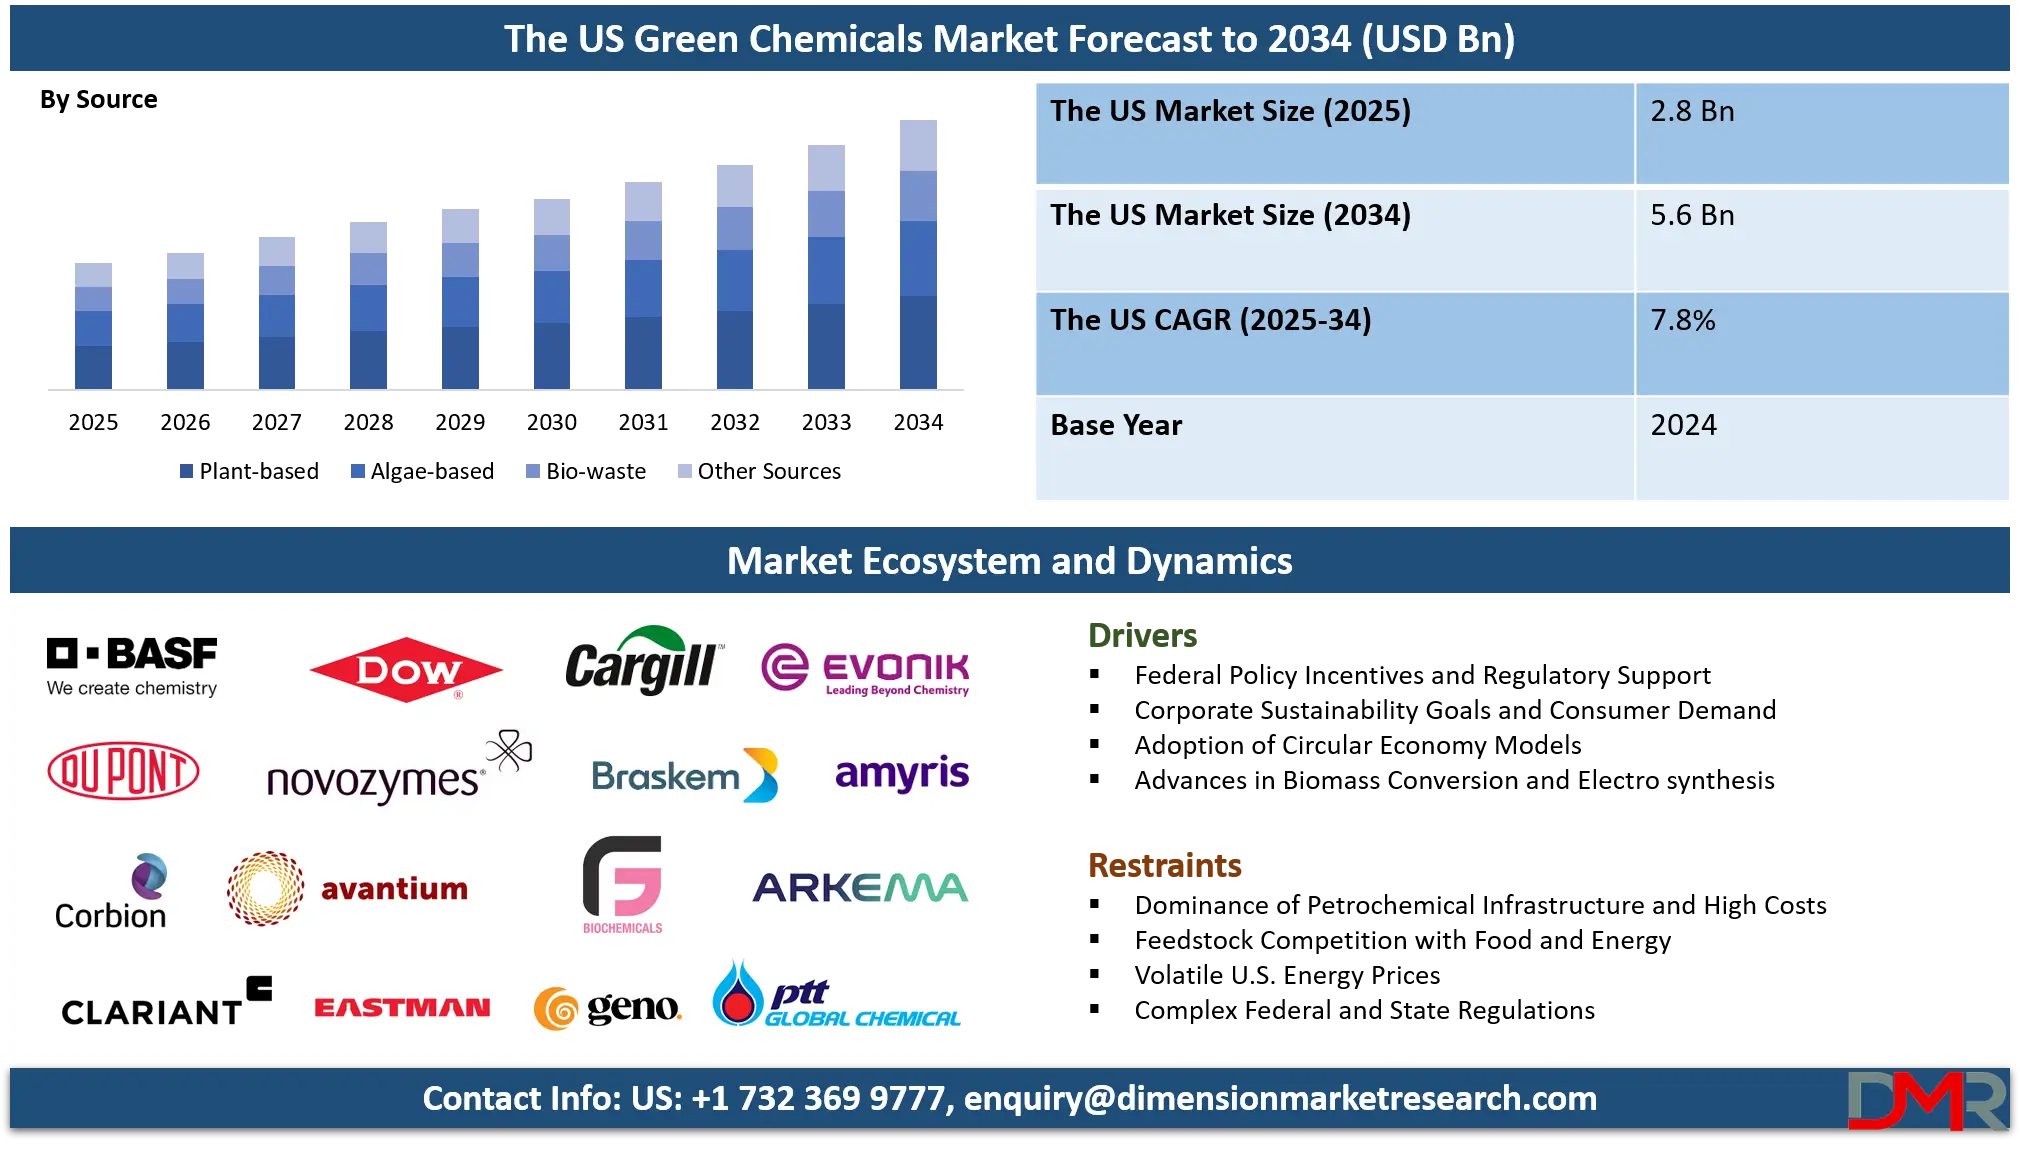
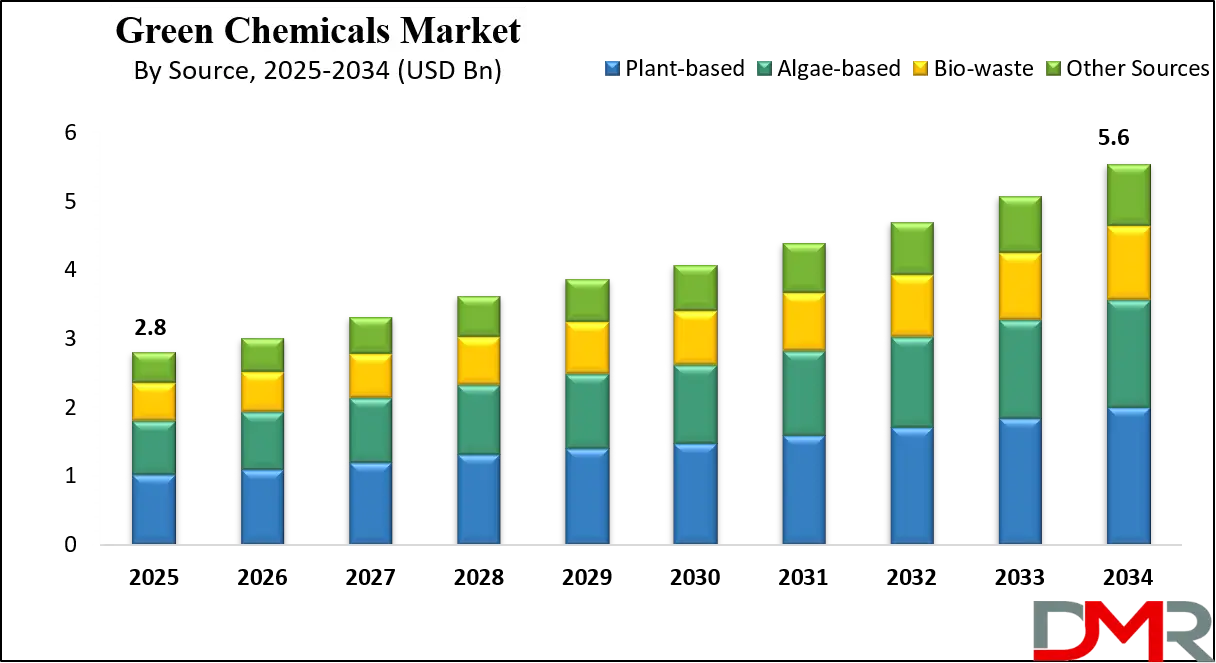
The U.S. Green Chemicals Market is forecasted to reach USD 2.8 billion in 2025 and grow at a compound annual growth rate (CAGR) of 7.8% through 2034, ultimately achieving a market value of USD 5.6 billion.
This rapid growth is underpinned by the nation’s transition toward sustainable chemistry, renewable raw materials, and bio-based industrial processes. Green chemistry principles are driving U.S. chemical manufacturers to adopt atom-economy reactions, solvent substitution, catalytic and biocatalytic pathways, and lifecycle-based production models, all of which reduce carbon intensity, hazardous byproducts, and energy consumption while supporting federal and state-level sustainability targets.
The U.S. market benefits from strong alignment between policy, decarbonization strategies, and industrial R&D investment. Federal initiatives such as the Inflation Reduction Act (IRA), the U.S. Department of Energy’s Bioenergy Technologies Office (BETO) programs, and the USDA BioPreferred Program are incentivizing the adoption of bio-based products and low-carbon technologies. This policy framework is enabling rapid scale-up of biorefineries, fermentation and enzymatic conversion systems, and renewable electricity-driven electrosynthesis platforms.
These facilities are commercializing the production of bio-alcohols (ethanol, butanol), biopolymers (PLA, PHA), biosurfactants, and green solvents that are increasingly used across packaging, coatings, agriculture, personal care, and pharmaceuticals. By embedding these alternatives into U.S. supply chains, industries are reducing their dependence on imported petrochemicals and enhancing supply-chain resilience.
Despite these opportunities, challenges remain. The U.S. is home to some of the world’s largest and most entrenched petrochemical complexes, particularly along the Gulf Coast, which slows the transition toward greener substitutes. Feedstock competition with food production, farmland allocation, and forestry management adds complexity to bio-based value chains.
Moreover, capital-intensive electrification, green hydrogen integration, and large-scale biorefinery construction present high financial barriers. Volatile U.S. energy prices, coupled with fragmented regulatory frameworks across states, lengthen commercialization timelines and compliance costs, restraining widespread adoption.
Still, the U.S. possesses an abundant biomass potential. Studies highlight hundreds of millions of tonnes of agricultural residues (corn stover, wheat straw), forestry byproducts (wood chips, sawdust), and municipal solid waste as viable feedstocks for green chemical production. Leveraging these waste streams supports circular economy models, zero-waste targets, and U.S. climate commitments, while reducing reliance on virgin raw materials. This availability gives the U.S. a strategic advantage in building a competitive bioeconomy, particularly as industries push toward net-zero carbon emissions by 2050.
Growth prospects hinge on the pace of conversion technology innovation, such as enzymatic hydrolysis, advanced fermentation, catalytic pyrolysis, and electrochemical synthesis, combined with investments in biorefinery infrastructure and advanced recycling systems. Federal and state-level incentives—carbon pricing, green public procurement mandates, renewable energy integration, and expanded R&D funding—will play a decisive role in accelerating adoption.
If these regulatory, financial, and technological forces align, the U.S. Green Chemicals Market will capture a significant share of the polymer, specialty chemical, surfactant, and solvent markets. Beyond economic growth, the sector will deliver measurable benefits in environmental protection, occupational health and safety, energy security, and industrial competitiveness, firmly positioning the U.S. as a leader in the global green chemistry revolution.
The US Green Chemicals Market: Key Takeaways
- Market Size and Growth: The U.S. Green Chemicals Market is projected to reach USD 2.8 billion in 2025 and expand to USD 5.6 billion by 2034, growing at a CAGR of 7.8%, driven by increasing adoption of bio-based chemicals and sustainability mandates.
- Dominant Products: Bio-alcohols (bioethanol and biobutanol) is projected to lead the market due to their scalability, mature production infrastructure, policy support, and versatile applications across fuels, bioplastics, coatings, and personal care industries.
- Primary Feedstocks: Plant-based sources (corn, soy, sugarcane, wheat) is anticipated to dominate the U.S. green chemicals market due to abundant availability, mature supply chains, cost-effectiveness, and strong alignment with federal renewable energy and BioPreferred programs.
- Key End-User: The packaging sector drives green chemical adoption, fueled by regulatory mandates, corporate sustainability goals, and consumer preference for recyclable, compostable, and bio-based materials, particularly in food, beverage, and e-commerce packaging.
- Market Drivers and Trends: Growth is propelled by federal incentives, corporate sustainability commitments, circular economy integration, and industrial electrification, alongside technological innovation in biorefineries, advanced enzymatic conversion, and electrosynthesis for cost-effective bio-based chemical production.
- Competitive Landscape: The market features multinational corporations (BASF, Dow, Cargill, DuPont, Evonik) and startups focusing on renewable feedstocks, biopolymers, green solvents, and circular economy solutions, emphasizing R&D, partnerships, and sustainability-driven strategies to capture market share.
The US Green Chemicals Market: Use Cases
- Packaging Industry: Green chemicals enable bio-based polymers and biodegradable coatings that replace petroleum plastics in packaging. U.S. companies leverage PLA and PHA to meet consumer demand, reduce landfill waste, and comply with federal regulations promoting sustainable packaging solutions and circular economy commitments.
- Agriculture Sector: Bio-based fertilizers, pesticides, and soil conditioners derived from green chemicals improve crop yields while reducing reliance on synthetic agrochemicals. U.S. agribusinesses adopt these inputs to enhance soil health, lower emissions, and support climate-smart farming aligned with USDA sustainability guidelines.
- Personal Care & Cosmetics: Green solvents, bio-surfactants, and plant-derived polymers are used in skincare, haircare, and cosmetic products. U.S. brands adopt green chemicals to meet consumer demand for eco-friendly formulations, reduce toxic ingredients, and comply with FDA safety and environmental regulations.
- Automotive & Transportation: Bio-based polymers, lubricants, and resins support lightweight materials, fuel efficiency, and lower emissions in U.S. automotive manufacturing. Green chemicals help OEMs replace petroleum-based materials, align with EPA emission standards, and meet EV sector sustainability and recyclability objectives.
- Pharmaceuticals & Healthcare: Green chemistry innovations enable sustainable drug synthesis, biodegradable medical polymers, and eco-friendly solvents. U.S. pharmaceutical firms adopt these solutions to lower hazardous waste, ensure regulatory compliance with FDA and EPA guidelines, and strengthen sustainable supply chains in healthcare systems.
The US Green Chemicals Market: Stats & Facts
U.S. Department of Energy (DOE) — Bioenergy / Billion-Ton findings
- The U.S. currently uses ~342 million tons of biomass (including corn grain for ethanol and wood/wood waste) to meet energy needs.
- DOE’s assessment shows the U.S. could sustainably produce more than one billion tons of biomass per year, enabling large-scale renewable-carbon feedstocks for chemicals and fuels.
- DOE estimates that scaling sustainable biomass could yield an estimated ~60 billion gallons of low-GHG liquid fuels while still meeting food, fiber, and forest product demands.
USDA — BioPreferred / Biobased products economic impact
- USDA BioPreferred reporting finds biobased products contributed USD 489 billion to the U.S. economy in 2021 (up from USD 464 billion in 2020).
- The USDA BioPreferred / related study reports ~3.94 million people employed in the U.S. biobased products industry in 2021.
- The USDA report documents that the BioPreferred program has certified more than 7,800 products for the USDA Certified Biobased Product label.
- The BioPreferred program has identified roughly 20,000 biobased products/categories in its tracking and resources.
U.S. Environmental Protection Agency (EPA) — Greenhouse Gas Reporting Program (GHGRP) & emissions
- For the reporting year 2021, 7,608 facilities in nine industry sectors reported direct GHG emissions to the GHGRP.
- Those reporters recorded 2.71 billion metric tons of CO₂-equivalent (direct emissions) in 2021.
- EPA national highlights show U.S. GHG emissions increased by 0.2% in 2022 compared with 2021.
EPA — Toxics Release Inventory (TRI)
- In 2023, facilities reported managing 34.6 billion pounds of TRI-listed chemicals as waste (recycled, combusted for energy recovery, treated, disposed of, or released).
- EPA’s 2022 TRI National Analysis notes 305 facilities in a specific sector reported managing 115 million pounds of TRI chemicals as waste in 2022, with ~89 million pounds released in that sector.
U.S. Energy Information Administration (EIA) — industry energy & MECS 2022 highlights
- The industrial sector accounted for ~35% of total U.S. end-use energy consumption (2022) and ~33% of total U.S. energy consumption.
- EIA/MECS (2022) shows chemicals, petroleum & coal products, paper, and primary metals account for the majority of manufacturing energy consumption, with chemicals being the largest feedstock user.
- In MECS 2022 data, the chemicals sector accounts for ~36% of feedstock (nonfuel) consumption in manufacturing (using energy as a raw input rather than fuel).
- U.S. manufacturing total consumption ≈ 20.7 quadrillion Btu (MECS context shown in 2022 slide deck).
National Renewable Energy Laboratory (NREL) / National lab assessments
- National lab assessments estimate ~1.3 billion tons of domestic biomass resources can be available at low cost thresholds, supporting feedstock economics.
U.S. Bureau of Labor Statistics (BLS) — chemical industry employment & occupations
- BLS NAICS 325 (chemical manufacturing) shows employment in chemical manufacturing at ≈ 902 thousand workers in the 2025 monthly data.
- The occupation Chemical Plant and System Operators had ~17,980 employed in May 2023 with a mean annual wage ≈ $79,450.
U.S. Department of Commerce — Census (Manufacturers’ Shipments, Inventories & Orders, M3)
- The Census M3 program reports monthly new orders and shipments for manufactured goods. Example: new orders for manufactured goods in April 2025 totaled $594.6 billion.
U.S. Forest Service / Forestry feedstock context
- State forest reports highlight the scale of wood/forest feedstocks. Example: Washington state harvested >2.9 billion board feet in 2020; many states produce hundreds of millions to billions of board feet annually that underpin wood residues feedstock.
U.S. Food & Drug Administration (FDA) — cosmetics/ingredients regulatory context
- FDA clarifies that cosmetic products and ingredients (except color additives) do not require FDA pre-market approval before being marketed in the U.S.; manufacturers are responsible for safety.
U.S. Department of Transportation (DOT) / Bureau of Transportation Statistics
- DOT/BTS data show CO₂ comprises ~97.3% of transportation GHG emissions, a key factor in lifecycle carbon accounting across chemical value chains.
USDA / Forest & Agricultural residues — economic & job context
- USDA/Forest Service and companion analyses estimate the logging industry contributes ~$36.2 billion to the U.S. economy and supports ~488,000 jobs.
General Services Administration (GSA) / Federal procurement & BioPreferred purchasing context
- The USDA BioPreferred program and GSA materials note that federal buyers and contractors represent “billions of dollars” in annual purchasing opportunity for biobased products.
DOE / industrial electrification & hydrogen (policy levers)
- DOE analyses emphasize that industrial electrification and green hydrogen adoption are capital-intensive and among the key cost drivers and barriers to decarbonizing chemical production at scale.
EPA / Sectoral emission reporting (chemicals sector highlights)
- EPA GHGRP sector pages provide sector-specific breakouts (e.g., fluorinated vs. non-fluorinated chemicals) and emissions ranges, enabling granular chemical-sector emissions accounting used by industry decarbonization planning.
The US Green Chemicals Market: Market Dynamics
Driving Factors in the US Green Chemicals Market
Federal Policy Incentives and Regulatory Mandates
Federal incentives are the backbone driving the U.S. Green Chemicals Market forward. Policies embedded in the Inflation Reduction Act (IRA), the USDA BioPreferred Program, and the Department of Energy Bioenergy Technologies Office (BETO) funding initiatives are incentivizing large-scale investment in green chemistry.
These programs promote tax credits for renewable fuel production, expand funding for biorefinery demonstration projects, and enforce procurement mandates for biobased products across federal agencies. The General Services Administration (GSA) also prioritizes sustainable purchasing, creating multi-billion-dollar markets for certified green products.
Additionally, Environmental Protection Agency (EPA) emission reduction requirements push industries to transition from hazardous chemicals to safer, bio-based alternatives. State-level regulations, such as California’s green procurement policies and New York’s clean chemical initiatives, complement federal action by setting ambitious targets that drive compliance.
Together, these frameworks ensure that regulatory and market signals are aligned, reducing investor uncertainty and catalyzing new product launches. The strong presence of supportive policy makes government action one of the most decisive drivers of U.S. market expansion.
Rising Corporate Sustainability Commitments and Consumer Demand
Corporate sustainability agendas and consumer awareness are equally strong growth drivers. Major U.S. corporations in consumer goods, agriculture, automotive, and healthcare are committing to net-zero targets, sustainable sourcing, and product circularity goals. Green chemicals, such as biodegradable plastics, non-toxic solvents, and plant-derived polymers, are vital in meeting these commitments. Increasing consumer preference for eco-friendly packaging, cruelty-free cosmetics, and bio-based household products is amplifying the demand pull.
Surveys indicate U.S. buyers are willing to pay premiums for sustainable products, creating direct financial incentives for manufacturers to scale green chemical production. Retail giants, food and beverage companies, and automotive OEMs are adopting green chemistry solutions not only for branding advantages but also to secure compliance with tightening regulatory standards. This dual push, bottom-up from consumers and top-down from corporate boards which creates a reinforcing cycle. With sustainability integrated into corporate ESG metrics, companies across the U.S. economy view green chemicals as essential tools to maintain competitiveness, profitability, and regulatory readiness.
Restraints in the US Green Chemicals Market
Entrenched Petrochemical Infrastructure and High Capital Costs
A major restraint in the U.S. Green Chemicals Market is the dominance of petrochemical infrastructure, particularly along the Gulf Coast, where decades of investment have created vast economies of scale that bio-based competitors struggle to match. Transitioning away from fossil-based production requires building entirely new facilities or extensively retrofitting existing plants, both of which involve high upfront capital expenditures.
Additionally, green hydrogen integration, industrial electrification, and biorefinery construction demand billions in investment before commercial viability can be achieved. The financial risk is exacerbated by the long payback periods and uncertainties around technology scaling. Without consistent subsidies, tax incentives, or low-cost financing, many investors are hesitant to commit to large-scale projects.
Furthermore, the global competitiveness of petrochemicals, driven by cheap shale gas and abundant oil, puts U.S. bio-based products at a cost disadvantage. As a result, entrenched infrastructure and cost barriers significantly slow down the pace of green chemical adoption in the United States.
Feedstock Competition, Energy Price Volatility, and Regulatory Complexity
Another barrier stems from feedstock competition and regulatory complexity. Agricultural residues and forestry byproducts, while abundant, often face competing demand from food, livestock, and energy sectors, creating potential conflicts in resource allocation.
In addition, volatile U.S. energy prices affect production costs, particularly for processes dependent on renewable electricity or green hydrogen. Regulatory complexity further complicates matters, as businesses must navigate a patchwork of federal and state policies that often differ in scope, timelines, and enforcement mechanisms.Compliance with EPA, USDA, and DOE rules requires significant administrative resources and can delay commercialization.
Moreover, uncertainties in carbon pricing policies and renewable energy incentives create unpredictability for long-term project planning. These combined factors increase operational costs, extend project timelines, and discourage risk-taking by smaller players. Unless harmonized policies and stable pricing frameworks are established, feedstock competition and regulatory hurdles will continue to restrain large-scale adoption of green chemicals across the U.S. economy.
Opportunities in the US Green Chemicals Market
Biorefinery Infrastructure Expansion and Rural Economic Development
One of the most promising opportunities lies in scaling U.S. biorefinery infrastructure. The nation possesses vast agricultural residues, forestry byproducts, and municipal waste streams that can be harnessed as raw materials for bio-alcohols, biopolymers, and green solvents. Establishing more commercial-scale biorefineries not only expands the availability of bio-based chemicals but also stimulates rural economic growth by creating jobs and value-added markets for farmers and foresters.
The USDA and DOE have identified that hundreds of millions of tons of biomass are available annually, positioning the U.S. as a global leader in sustainable chemical feedstock supply. By co-locating biorefineries near feedstock sources, costs can be reduced, transportation impacts minimized, and local economies strengthened.
Federal infrastructure funding and private-sector partnerships further open opportunities for scaling integrated facilities that simultaneously produce fuels, energy, and chemicals. This infrastructure build-out represents a unique pathway for the U.S. to achieve decarbonization while revitalizing rural economies and increasing industrial resilience.
Innovation in Advanced Conversion Technologies and Electrosynthesis
Technological innovation represents another key growth opportunity. Advanced enzymatic hydrolysis, fermentation processes, catalytic pyrolysis, and electrochemical synthesis are enabling the cost-efficient conversion of biomass into high-value chemicals. Electrosynthesis powered by renewable electricity is particularly promising in the U.S., where solar and wind power capacity continues to expand rapidly.
These technologies reduce reliance on fossil inputs, lower greenhouse gas emissions, and create entirely new product categories. U.S. research institutions, supported by federal R&D programs like ARPA-E and BETO, are piloting scalable conversion technologies that can directly compete with petrochemical-based production. Commercialization of these technologies would allow for localized, modular chemical manufacturing units, reducing supply chain vulnerabilities and enabling customized production at regional scales.
Furthermore, breakthroughs in catalyst design and metabolic engineering are driving efficiency improvements, making bio-based production economically viable. By accelerating innovation and commercialization, the U.S. can achieve technological leadership in green chemicals and capture significant export opportunities in global markets.
Trends in the US Green Chemicals Market
Integration of Circular Economy Models Across the U.S. Chemical Industry
A prominent trend in the U.S. Green Chemicals Market is the adoption of circular economy models where waste streams are repurposed into high-value raw materials. U.S. companies are shifting toward bio-based polymers, recyclable packaging materials, and low-toxicity solvents as part of strategies to minimize landfill contributions and reduce carbon emissions. Federal and state initiatives, such as extended producer responsibility (EPR) programs, push industries to redesign supply chains for product reuse and recycling.
This circularity approach not only mitigates environmental impacts but also creates economic opportunities by extending product lifecycles and lowering long-term costs. The trend is highly visible in the U.S. packaging, consumer goods, and construction sectors, where demand for recycled or biodegradable alternatives is surging. With growing consumer pressure for sustainability, U.S. brands are increasingly marketing eco-friendly products, further accelerating the mainstreaming of green chemicals within a circular economy framework.
Industrial Electrification and Bio-Based Feedstock Diversification
Another strong trend is the diversification of feedstocks and the electrification of chemical production processes. U.S. manufacturers are moving beyond fossil-based inputs by investing in biomass, agricultural residues, forestry byproducts, and municipal solid waste streams as reliable raw material sources. The Department of Energy’s push for biorefineries and sustainable biomass utilization supports this transition.
At the same time, industrial electrification powered by renewable energy, along with green hydrogen integration, is gaining momentum in chemical production facilities across the United States. These shifts reduce dependence on imported oil and gas while aligning with federal decarbonization policies and corporate ESG goals.
Bio-based feedstock use also allows for localized sourcing, reducing supply chain vulnerabilities exposed during global disruptions. In particular, bioethanol, PLA, and bio-surfactants are becoming core components of U.S. specialty chemicals and packaging markets. This electrification-feedstock diversification trend signals a long-term transformation in how U.S. industries approach sustainability, energy use, and resource security.
The US Green Chemicals Market: Research Scope and Analysis
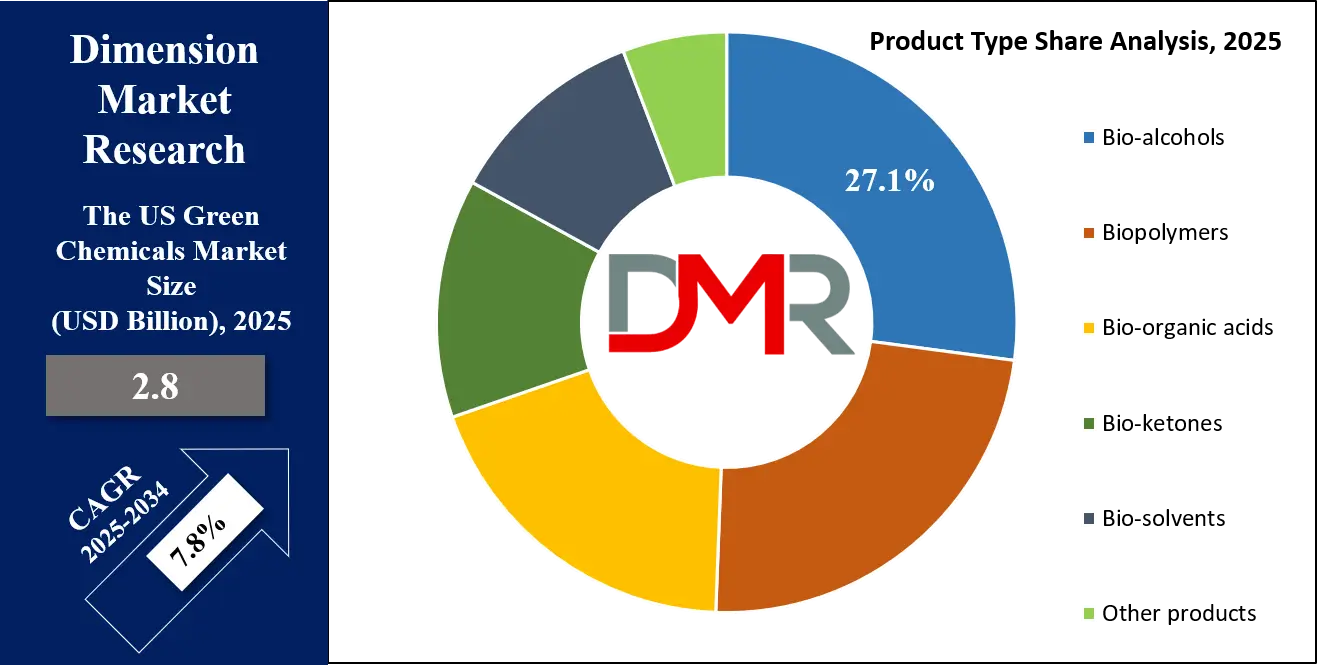
By Product Type Analysis
Bio-alcohols, led by bioethanol and biobutanol, are projected to dominate the U.S. green chemicals market due to their scalability, policy support, and wide industrial applicability. In the United States, bioethanol is the most commercially mature biofuel, produced largely from corn and other renewable feedstocks. The Renewable Fuel Standard (RFS) mandates blending bioethanol with gasoline to lower greenhouse gas (GHG) emissions, enhance energy security, and reduce reliance on crude oil imports. Today, the U.S. remains the world’s largest bioethanol producer, supported by a vast agricultural base and decades of infrastructure investments.
Biobutanol is emerging as a next-generation fuel alternative, offering higher energy density, lower volatility, and compatibility with existing pipelines and engines, giving it a potential edge over ethanol. Similarly, bio-methanol, produced through biomass gasification and carbon recycling, is gaining traction in the U.S. as a sustainable feedstock for biodiesel and as a marine fuel aligned with the International Maritime Organization’s decarbonization agenda.
Beyond fuels, bio-alcohols serve as essential building blocks for bioplastics, adhesives, coatings, pharmaceuticals, and cosmetics, ensuring deep integration into U.S. industrial supply chains. Compared with biopolymers, bio-ketones, or bio-acids, bio-alcohols enjoy lower production costs, greater scale, and mature commercialization. Their dual role as immediate substitutes for fossil fuels and versatile industrial solvents secures their leadership in the U.S. green chemicals market, reinforcing their critical role in the nation’s energy transition and decarbonization strategies.
By Source Analysis
Plant-based feedstocks are anticipated to dominate the U.S. green chemicals market because of their availability, mature supply chains, and proven commercialization potential. Corn, soybeans, sugarcane, and wheat serve as the backbone for producing bioethanol, biodiesel, bio-based solvents, and bioplastics on an industrial scale. The U.S., with its vast agricultural output, enjoys a strategic advantage in supplying biomass for renewable chemicals. Federal programs like the USDA BioPreferred Program and the Department of Energy’s Bioenergy Technologies Office (BETO) incentivize large-scale utilization of plant-based biomass, driving bioeconomy growth.
Corn-based bioethanol is a cornerstone of U.S. renewable energy policy, while soybean and canola oils play a major role in biodiesel production, strengthening the nation’s clean transportation sector.
Additionally, plant-based sources are powering the growth of bioplastics such as PLA, bio-PET, and starch-based polymers, widely used in packaging, textiles, and consumer goods. Compared to algae and bio-waste, plant-derived feedstocks benefit from established farming, processing, and logistics infrastructure, making them the most cost-effective and reliable raw material for large-scale production. While algae-based chemicals hold long-term promise due to higher oil yields and reduced land requirements, they face high cultivation costs and scaling challenges. Bio-waste feedstocks, although sustainable, lack consistency and infrastructure for broad commercialization. In contrast, the compatibility of plant-based inputs with existing refining systems, coupled with advancements in crop genetics and biotechnology, ensures that plant-based sources maintain their leadership position in the U.S. green chemicals industry.
By End-User Analysis
The packaging sector is poised to lead the end-user of green chemicals in the U.S., driven by regulatory mandates, corporate sustainability commitments, and rising consumer demand for eco-friendly products. The U.S. is actively tackling plastic pollution through single-use plastics restrictions, extended producer responsibility (EPR) programs, and federal procurement of bio-based materials. This has accelerated the adoption of biopolymers like PLA, bio-PET, polyhydroxyalkanoates (PHA), and starch blends, which are increasingly used for bottles, films, trays, and containers.
U.S. food and beverage giants, such as Coca-Cola, Nestlé, and PepsiCo, have pledged to achieve 100% recyclable, compostable, or bio-based packaging by 2030. These corporate commitments, combined with consumer expectations for sustainable packaging, are fueling demand growth. The rapid expansion of e-commerce in the U.S. has further increased packaging consumption, pushing logistics and retail companies toward lightweight, recyclable, and biodegradable options.
Compared to automotive, agriculture, or healthcare sectors, packaging benefits from high consumption volumes, faster commercialization timelines, and easier integration of green materials into existing supply chains. U.S. consumer awareness amplifies this shift, with growing preference for environmentally responsible packaging influencing retail and FMCG sales.
Moreover, compliance with both federal sustainability directives and state-level mandates (such as California’s plastics reduction laws) ensures packaging remains the primary driver of green chemical adoption in the U.S.. With its visibility and scale, the packaging industry acts as a catalyst for mainstreaming bio-based materials across the American economy.
The US Green Chemicals Market Report is segmented on the basis of the following:
By Product Type
- Bio-alcohols
- Biopolymers
- Bio-organic acids
- Bio-ketones
- Bio-solvents
- Other products
By Source
- Plant-based
- Algae-based
- Bio-waste
- Other Sources
By End-User
- Construction
- Healthcare
- Pharmaceuticals and Personal Care Products
- Packaging
- Food and beverages
- Paints and coatings
- Automotive
- Agriculture
- Other Applications
Impact of Artificial Intelligence in the US Green Chemicals Market
- AI-Driven Process Optimization: AI enables predictive modeling and real-time analytics in green chemical manufacturing, improving energy efficiency, reducing waste, and enhancing yield. This supports bio-based processes and accelerates commercialization while cutting costs across industrial-scale production facilities.
- Smart Feedstock Utilization: Machine learning helps optimize agricultural residue, forestry waste, and municipal biomass feedstock selection. By predicting chemical conversion efficiencies, AI ensures sustainable raw material sourcing and minimizes competition with food systems, strengthening renewable resource integration into supply chains.
- AI in Biocatalysis and Fermentation: AI accelerates the discovery and design of enzymes, microbes, and catalysts, enabling efficient fermentation and enzymatic processes. These advancements reduce process timelines, enhance scalability, and expand green chemical applications in packaging, coatings, personal care, and industrial products.
- Supply Chain Resilience: AI-powered platforms improve demand forecasting, lifecycle assessment, and logistics planning. This enhances traceability of bio-based products, reduces transportation emissions, and ensures resilient green chemical supply chains aligned with U.S. sustainability and decarbonization targets.
- Regulatory Compliance and Safety: AI automates environmental monitoring, emission tracking, and regulatory reporting in green chemical facilities. This reduces compliance costs, ensures workplace safety, and strengthens alignment with EPA, DOE, and circular economy commitments, accelerating green chemical adoption across industries.
The US Green Chemicals Market: Competitive Landscape
The competitive landscape of the U.S. Green Chemicals Market is shaped by a mix of multinational corporations, emerging bio-based startups, and industry collaborations focusing on sustainable chemical innovations. Leading companies such as Cargill, BASF SE, DuPont, Braskem, NatureWorks, and Novozymes are heavily investing in research and development to expand portfolios in bio-based polymers, renewable solvents, and eco-friendly surfactants. Many players emphasize integrating circular economy principles, reducing carbon footprints, and transitioning from fossil-based raw materials to renewable feedstocks.
Strategic partnerships between chemical producers, biotechnology firms, and agricultural suppliers are fueling innovation, particularly in bioplastics, bioethanol, and bio-based resins. Startups supported by venture capital are introducing disruptive technologies, while established corporations leverage economies of scale and extensive distribution networks. Competitive differentiation often rests on intellectual property, technological expertise, and compliance with U.S. regulatory frameworks such as EPA sustainability standards.
Additionally, global companies are localizing operations to cater to U.S. demand for greener alternatives in packaging, automotive, agriculture, and consumer goods. Investments in production facilities across states like Iowa, Minnesota, and Louisiana highlight regional growth. Firms are also pursuing mergers, acquisitions, and joint ventures to strengthen their market position.
Overall, the U.S. green chemicals market is characterized by intense competition, rapid innovation, and sustainability-driven strategies, with players striving to balance profitability and environmental responsibility while meeting the nation’s decarbonization and renewable energy goals.
Some of the prominent players in the US Green Chemicals Market are:
- BASF SE
- Dow Inc.
- Cargill, Incorporated
- Evonik Industries AG
- DuPont de Nemours, Inc.
- Novozymes A/S
- Corbion N.V.
- Amyris, Inc.
- Braskem S.A.
- Eastman Chemical Company
- Clariant AG
- Arkema S.A.
- PTT The US Chemical Public Company Limited
- Avantium N.V.
- GFBiochemicals
- Genomatica, Inc.
- Metabolic Explorer S.A.
- Borregaard ASA
- Mitsubishi Chemical Holdings Corporation
- Other Key Players
Recent Developments in the US Green Chemicals Market
- August 2024: The U.S. Department of Energy allocated $118 million to bioenergy research centers, advancing green chemicals through biomass conversion, enzymatic innovation, and sustainable fuels development, supporting national goals of reducing carbon emissions and strengthening domestic renewable chemical manufacturing.
- July 2024: Dow announced expansion of its U.S. green solvents portfolio with bio-based glycol ethers for coatings and adhesives, reinforcing its commitment to circular economy strategies and providing sustainable alternatives to petrochemical solvents in industrial and consumer applications.
- June 2024: The USDA expanded its BioPreferred Program, certifying additional U.S.-produced bioplastics, lubricants, and green solvents, increasing federal procurement opportunities and enhancing visibility of domestic green chemical innovators across agriculture, packaging, and consumer product sectors.
- May 2024: LanzaTech and ArcelorMittal USA completed a demonstration project converting industrial emissions into ethanol for downstream green chemicals, showcasing circular carbon utilization and industrial symbiosis models for U.S. heavy industries targeting decarbonization.
- April 2024: The American Chemical Society’s Green Chemistry & Engineering Conference in Reston, Virginia, highlighted U.S. research breakthroughs in catalytic processes, biopolymers, and renewable solvents, emphasizing industry–academia collaborations for scaling sustainable chemical pathways.
- March 2024: Eastman Chemical advanced its U.S. molecular recycling facilities, enabling circular production of specialty green chemicals and sustainable materials for textiles, packaging, and coatings, aligning with corporate climate goals and extended producer responsibility regulations
Report Details
| Report Characteristics |
| Market Size (2025) |
USD 2.8 Bn |
| Forecast Value (2034) |
USD 5.6 Bn |
| CAGR (2025–2034) |
7.8% |
| Historical Data |
2019 – 2024 |
| Forecast Data |
2026 – 2034 |
| Base Year |
2024 |
| Estimate Year |
2025 |
| Report Coverage |
Market Revenue Estimation, Market Dynamics, Competitive Landscape, Growth Factors, etc. |
| Segments Covered |
By Product Type (Bio-alcohols, Biopolymers, Bio-organic acids, Bio-ketones, Bio-solvents, and Other products), By Source (Plant-based, Algae-based, Bio-waste, and Other Sources), By End- user (Construction, Healthcare, Pharmaceuticals and Personal Care Products, Packaging, Food and Beverages, Paints and Coatings, Automotive, Agriculture, and Other Applications) |
| Regional Coverage |
The US |
| Prominent Players |
BASF SE, Dow Inc., Cargill, Incorporated, Evonik Industries AG, DuPont de Nemours, Inc., Novozymes A/S, Corbion N.V., Amyris, Inc., Braskem S.A., Eastman Chemical Company, Clariant AG, Arkema S.A., PTT Global Chemical Public Company Limited, Avantium N.V., GFBiochemicals, Genomatica, Inc., Metabolic Explorer S.A., Borregaard ASA, Mitsubishi Chemical Holdings Corporation, and Other Key Players |
| Purchase Options |
We have three licenses to opt for: Single User License (Limited to 1 user), Multi-User License (Up to 5 Users), and Corporate Use License (Unlimited User) along with free report customization equivalent to 0 analyst working days, 3 analysts working days, and 5 analysts working days respectively. |
Frequently Asked Questions
The US Green Chemicals Market size is estimated to have a value of USD 2.8 billion in 2025 and is expected to reach USD 5.6 billion by the end of 2034.
The market is growing at a CAGR of 7.8 percent over the forecasted period of 2025.
Who are the key players in the US Green Chemicals Market?