Market Overview
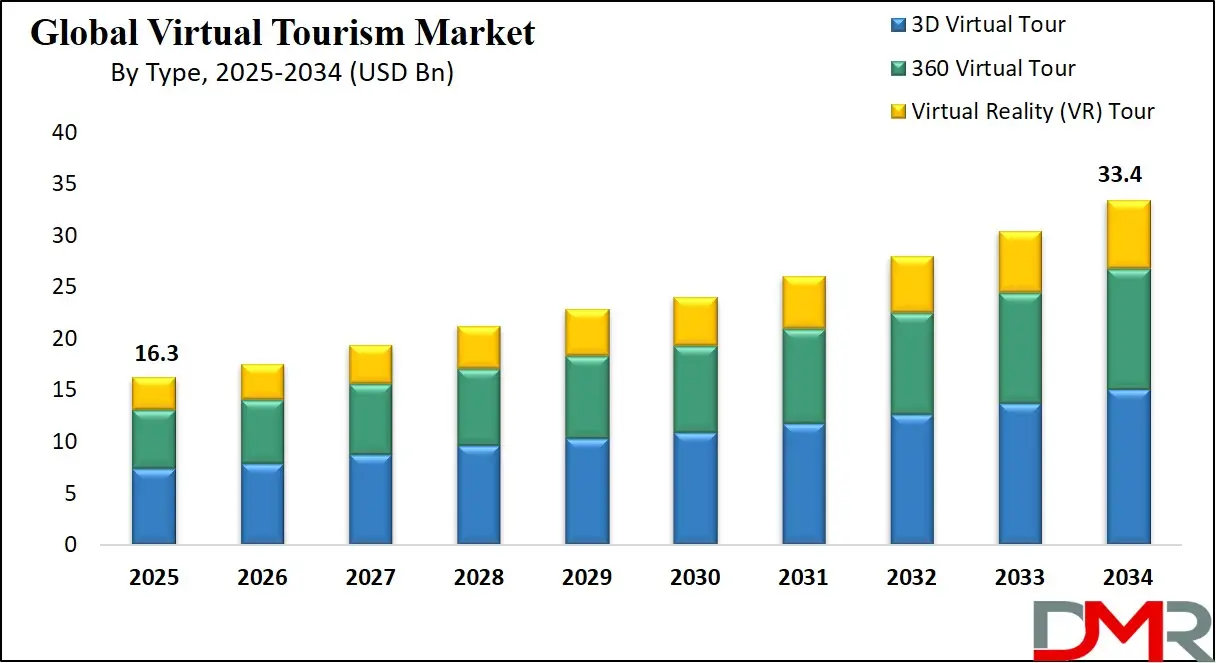
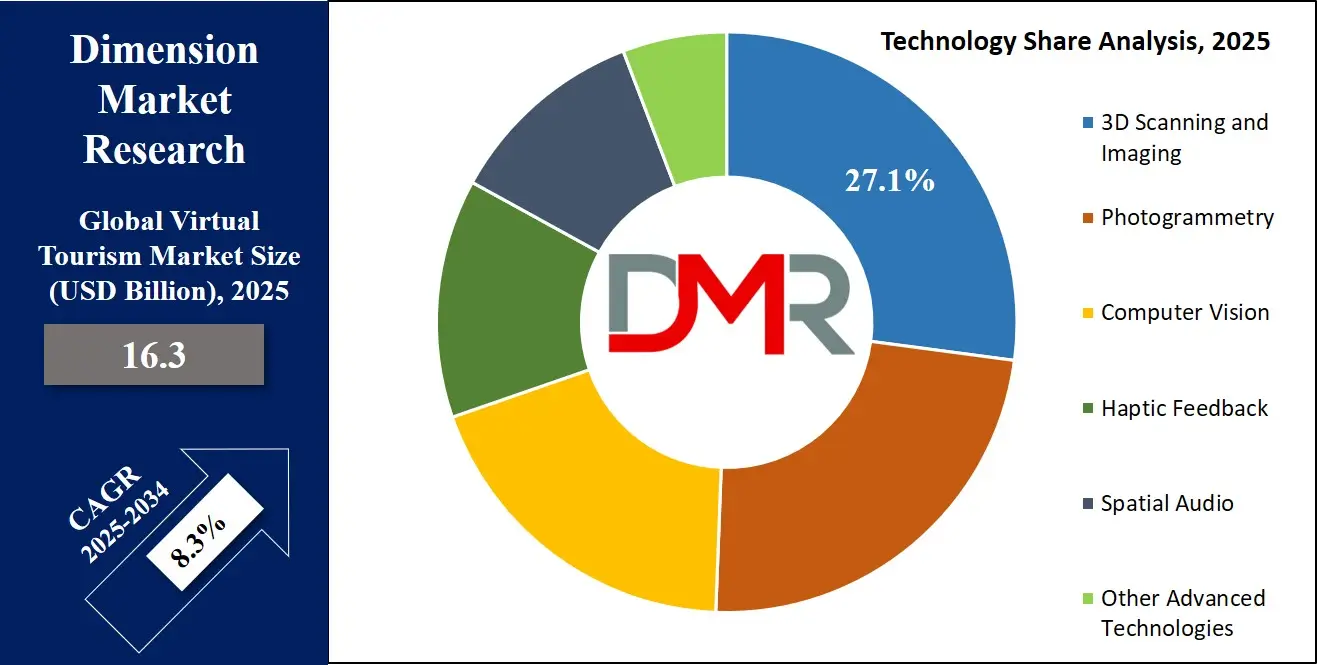
The Global Virtual Tourism Market is projected to reach USD 16.3 billion in 2025 and grow at a compound annual growth rate of 8.3% from there until 2034 to reach a value of USD 33.4 billion.
The global virtual tourism market is undergoing a major transformation, driven by the convergence of immersive technologies such as virtual reality, 360-degree video, 3D modeling, spatial audio, and photogrammetry. With the growing emphasis on experiential travel, virtual tourism provides users the ability to explore global destinations from the comfort of their homes. This has led to a surge in adoption across sectors such as real estate, education, cultural heritage, and entertainment.

ℹ
To learn more about this report –
Download Your Free Sample Report Here
The shift towards sustainable tourism, especially in light of climate concerns, has further propelled interest in virtual alternatives. Furthermore, rising smartphone penetration, availability of affordable VR headsets, and high-speed internet access are making virtual tours more accessible across demographics and geographies.
Opportunities abound for content developers, VR hardware manufacturers, and tourism boards looking to engage with audiences in innovative ways. The rise of metaverse platforms also presents a compelling space for integrating virtual travel with social and commercial interactions. Government tourism boards are increasingly digitizing national heritage sites and promoting them through immersive technologies. Educational institutions are leveraging virtual tours to teach geography, art history, and global cultures in more engaging formats.
Despite the promising growth, challenges persist. Lack of standardization in VR content quality, motion sickness among users, limited awareness in developing economies, and high production costs of high-quality 3D tours can restrain broader adoption. Data privacy concerns and digital fatigue are also emerging as key concerns.
ℹ
To learn more about this report –
Download Your Free Sample Report Here
Statistically, the market is expected to grow exponentially due to rapid technological progress and expanding content consumption trends. Asia-Pacific is emerging as the fastest-growing region, while North America continues to dominate in revenue terms. Going forward, collaborations between tech firms, cultural institutions, and government bodies will define the next phase of innovation in the virtual tourism ecosystem, where virtual experiences complement physical travel to shape a hybrid model for global exploration.
The US Virtual Tourism Market
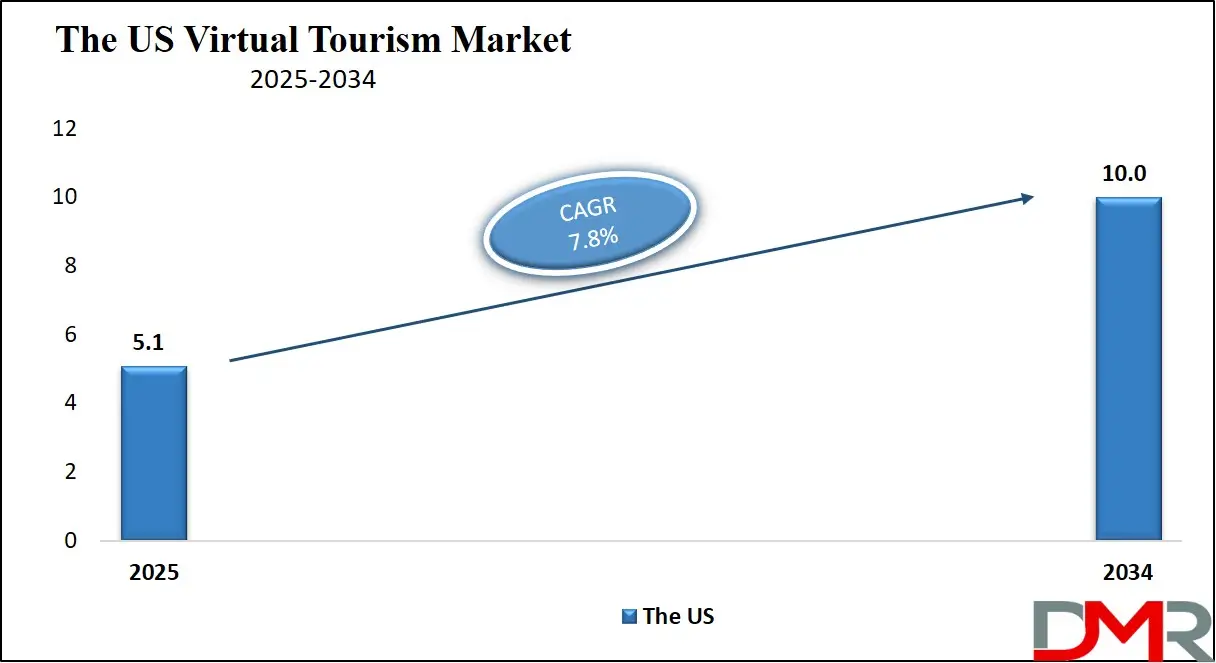
The US Virtual Tourism Market is projected to reach USD 5.1 billion in 2025 at a compound annual growth rate of 7.8% over its forecast period.
The United States' virtual tourism market is thriving due to the country’s technological leadership, digital infrastructure, and cultural diversification. According to the National Travel and Tourism Office (NTTO), the U.S. continues to attract millions of international and domestic tourists each year. This tourism influx has prompted both public and private stakeholders to digitize national landmarks and cultural attractions to extend accessibility and boost educational outreach. The National Park Service (nps.gov) has actively supported virtual exploration through web-based 3D tours of heritage parks and protected reserves, enabling users to experience Yosemite, Yellowstone, and other major destinations remotely.
In terms of demographics, the U.S. benefits from a highly internet-literate population with more than 93% internet penetration (U.S. Census Bureau, 2022), widespread device ownership, and increasing interest in sustainable and accessible tourism. Young travelers, particularly Gen Z and millennials, are most likely to engage in immersive digital travel content and VR simulations. The Department of Education has also encouraged virtual field trips to enhance experiential learning through federal funding initiatives.
The Smithsonian Institution and the Library of Congress have digitized vast cultural archives, museums, and artifacts to allow global access and promote cultural tourism. These initiatives show the government’s commitment to leveraging immersive technology to democratize travel and learning.
Moreover, with major tech companies such as Google, Meta, and Microsoft headquartered in the U.S., the domestic virtual tourism market continues to enjoy advanced innovation in VR hardware, immersive content creation, and overall digital experiences. These factors collectively offer a strong demographic and technological advantage for ongoing virtual tourism growth in the United States.
ℹ
To learn more about this report –
Download Your Free Sample Report Here
The Europe Virtual Tourism Market
The Europe Virtual Tourism Market is estimated to be valued at USD 2.4 billion in 2025 and is further anticipated to reach USD 4.50 billion by 2034 at a CAGR of 7.0%.
Europe has established itself as a global hub for virtual tourism, owing to its extensive cultural heritage, strong digitization policies, and high tourism inflow. According to the European Commission’s Digital Economy and Society Index (DESI), European nations rank among the most digitally advanced in the world. The European Union has funded numerous digitization projects through programs like Europeana.eu, which aims to provide access to over 50 million digitized items from European museums, galleries, libraries, and archives. These efforts are central to making cultural and historical tourism more immersive and accessible via virtual platforms.
Countries like France, Italy, and Germany have adopted immersive tourism strategies, where national tourism boards and cultural ministries offer 3D walkthroughs of iconic landmarks such as the Louvre, Colosseum, and Brandenburg Gate. UNESCO World Heritage Sites across Europe have increasingly been mapped in high-resolution for VR and AR consumption.
Demographically, Europe has an aging but highly connected population with a strong appreciation for heritage, making virtual travel an attractive, low-barrier form of tourism. The Eurostat portal confirms that over 90% of EU households have internet access, facilitating mass-market adoption of virtual experiences.
Furthermore, Europe is a major proponent of sustainable tourism. Virtual tourism aligns well with environmental policies targeting carbon reduction by limiting physical travel, especially for short-term or high-impact tourism. Education ministries have also incorporated virtual tours of cultural institutions into school curricula to support digital pedagogy. With strong institutional support, rich cultural assets, and advanced digital readiness, Europe is expected to remain a key growth engine for the virtual tourism sector.
The Japan Virtual Tourism Market
The Japan Virtual Tourism Market is projected to be valued at USD 978 million in 2025. It is further expected to witness subsequent growth in the upcoming period, holding USD 1,891 million in 2034 at a CAGR of 7.6%.
Japan's virtual tourism market is witnessing accelerated adoption fueled by advanced technology, a rich cultural ecosystem, and government-led digitization efforts. According to the Ministry of Economy, Trade, and Industry (METI), Japan's “Cool Japan” initiative promotes the global visibility of its cultural assets via immersive technologies like VR and AR. National tourism campaigns led by the Japan National Tourism Organization (JNTO) have started incorporating virtual previews of destinations such as Kyoto temples, Tokyo’s urban landscapes, and Hokkaido’s scenic routes.
Japan has one of the highest internet penetration rates in Asia, with over 94% of the population online, according to the Statistics Bureau of Japan. This widespread digital connectivity, coupled with a tech-savvy population and world-class electronics infrastructure, provides a solid foundation for virtual tourism growth. Educational institutions and museums are also implementing virtual field trips and interactive learning tours in response to increased demand for safe, remote experiences during global events like the COVID-19 pandemic.
Japanese tech firms are actively collaborating with municipalities to develop immersive virtual content. Companies like NTT, Sony, and Panasonic have developed cutting-edge VR and 3D capture technologies that support virtual cultural events, heritage tours, and entertainment attractions. At the municipal level, several smart city projects integrate virtual tourism modules for digital visitors.
In terms of demographics, Japan’s aging population benefits significantly from virtual tourism’s accessibility, especially those with mobility constraints. Additionally, rising international interest in Japanese culture and tourism ensures that global demand for Japanese virtual tourism content will remain strong in the coming years.
Global Virtual Tourism Market: Key Takeaways
- Global Market Size Insights: The Global Virtual Tourism Market size is estimated to have a value of USD 16.3 billion in 2025 and is expected to reach USD 33.4 billion by the end of 2034.
- The Global Market Growth Rate: The market is growing at a CAGR of 8.3 percent over the forecasted period of 2025.
- The US Market Size Insights: The US Virtual Tourism Market is projected to be valued at USD 5.1 billion in 2025. It is expected to witness subsequent growth in the upcoming period as it holds USD 10.0 billion in 2034 at a CAGR of 7.8%.
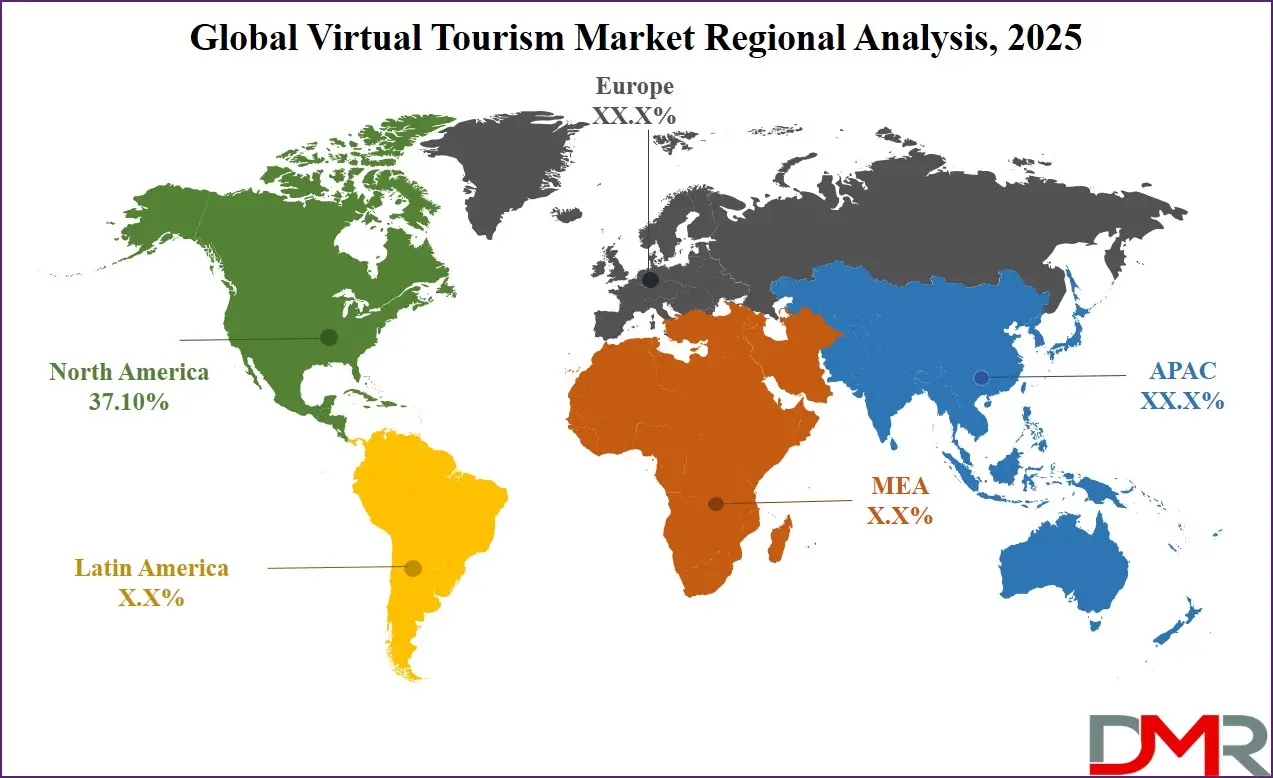
- Regional Insights: North America is expected to have the largest market share in the Global Virtual Tourism Market with a share of about 37.10% in 2025.
- Key Players: Some of the major key players in the Global Virtual Tourism Market are Google, Meta (Oculus), Microsoft, Expedia Group, Samsung, Dubai 360, Matterport, and many others.
Global Virtual Tourism Market: Use Cases
- Virtual Heritage Exploration: Users can explore iconic world heritage sites such as Machu Picchu, the Pyramids of Giza, or the Taj Mahal through 3D reconstructions and VR headsets, offering cultural insights without travel costs or physical limitations.
- Real Estate Virtual Staging: Prospective homebuyers can take immersive, guided 360° property tours, reducing the need for physical visits and expediting the buying process, especially effective for international buyers and remote investors.
- Museum & Art Gallery Access: Institutions like the British Museum and the Louvre offer virtual walkthroughs that allow users to navigate curated exhibitions, view artifacts in detail, and interact with educational content via desktops or VR.
- Eco-Tourism & Wildlife Safaris: Virtual tours of national parks or safaris in Africa deliver high-definition wildlife experiences, using drones and 360-degree cameras to raise awareness about conservation without human impact on ecosystems.
- Educational Travel Experiences: Schools and universities provide students with interactive virtual tours of historical landmarks, global cities, or ancient civilizations to enrich learning, especially in subjects like history, geography, and world studies.
Global Virtual Tourism Market: Stats & Facts
UNESCO
- UNESCO has over 1,200 World Heritage Sites globally, many of which are featured in virtual tourism initiatives that offer interactive tours, 3D maps, and cultural walkthroughs to enhance global accessibility.
- Over 300 heritage sites across continents have been scanned or mapped in 3D, enabling digital preservation and remote access through VR-enabled platforms for education and tourism.
- The “World Heritage in Young Hands” program actively promotes virtual access for youth, enabling students and educators to explore cultural heritage digitally in over 30 countries.
U.S. National Park Service (nps.gov)
- More than 400 U.S. national parks now offer immersive digital access, including interactive maps, narrated video tours, and panoramic imagery, supporting remote tourism and education.
- The National Park Service’s “Virtual Visits” section draws over 1.6 million user interactions annually, mainly from students, senior citizens, and families who seek virtual nature experiences.
- High-demand parks such as Yellowstone and Grand Canyon record over 200,000 virtual tour views per month, showcasing their global appeal even in virtual formats.
Smithsonian Institution
- The Smithsonian's virtual museum offerings recorded over 4 million global visits in 2023, enabling access to exhibits on natural history, aerospace, and anthropology through 360-degree navigation.
- Its Open Access initiative has released more than 4.5 million digital assets, including 3D models and immersive content, which are widely used in educational VR platforms.
- These digital tools are integrated into over 15,000 classrooms in the U.S. annually, enhancing student learning through virtual field trips and cultural exploration.
Library of Congress
- The Library of Congress has digitized more than 60 million files, including historical documents, maps, and exhibitions, many of which are accessible via virtual tours or 3D walkthroughs.
- Their virtual exhibition galleries attract over 500,000 users each year, with peak usage seen during U.S. heritage months and international awareness days.
- VR-ready content developed by the Library includes virtual reconstructions of American history, like Lincoln’s era and the Civil Rights Movement, supporting both tourism and education.
European Commission – DESI (Digital Economy and Society Index)
- 90% of households in the European Union had internet access as of 2022, which significantly enables the population's ability to engage in virtual cultural tourism from home.
- Nearly 70% of EU cultural and historical institutions now offer virtual tours, digital exhibits, or online reconstructions to support international tourism in a post-COVID world.
- The Europeana.eu platform hosts more than 50 million digitized items, including art, photographs, architecture, and manuscripts, many of which support immersive tourist experiences.
Japan National Tourism Organization (JNTO)
- The JNTO provides over 40 immersive virtual tourism experiences, including city previews, cultural hotspots, and temple tours accessible from any device worldwide.
- Japan’s government-backed travel videos and virtual destinations attracted 80 million global views in 2022, with particular interest from Southeast Asia, the U.S., and Europe.
- The Tokyo Metropolitan Government has funded high-resolution VR walkthroughs, including virtual cherry blossom tours, which are part of its tourism promotion strategy.
Ministry of Culture and Tourism – China
- Since 2020, China has digitized more than 200 national-level heritage sites, incorporating advanced technologies like 3D laser scanning, panoramic imaging, and VR for tourism development.
- The Dunhuang Research Academy offers 30+ immersive tours of the Mogao Caves, a UNESCO site, accessible through global platforms like Google Arts & Culture and local apps.
- During the 2023 Chinese New Year, the ministry recorded 1.2 billion virtual cultural tourism interactions, including AR festivals, online temple fairs, and VR museum visits.
National Institute of Statistics and Geography (INEGI) – Mexico
- INEGI data indicates 62% of Mexican museums introduced digital tours, walkthroughs, or exhibition videos during and after the COVID-19 pandemic to maintain visitor engagement.
- In 2021, Mexico City’s virtual “Day of the Dead” celebration attracted over 12 million viewers, blending animation, drone footage, and cultural performances into a VR experience.
- Between 2020 and 2022, online engagement with digital tourism and cultural platforms increased by 36%, highlighting growing demand for virtual content in Latin America.
VisitBritain – UK’s National Tourism Board
- The “Virtual Britain” campaign features over 150 digitally curated experiences, including Stonehenge, the Tower of London, and Edinburgh Castle, promoted for global remote tourism.
- The British Museum’s virtual platform logged over 10 million interactions in 2023, offering educational and leisure exploration of historical artifacts and exhibits in multiple languages.
- Shakespeare’s Globe Theatre saw a 300% increase in global viewership of its digital performances and backstage tours, as audiences worldwide accessed British culture from home.
U.S. Census Bureau
- As of 2022, 93.5% of U.S. households had broadband internet, creating a robust foundation for virtual tourism consumption across urban and rural regions.
- The average U.S. household owns 3.6 internet-connected devices, making it easier for users to access VR experiences, 3D tours, and AR-integrated apps on mobile or desktops.
- During the 2021–2022 academic year, over 73% of U.S. students participated in at least one virtual field trip, which often included online visits to museums and heritage sites.
National Endowment for the Humanities (NEH) – U.S.
- The NEH has funded over 290 virtual heritage projects in the last five years, including digital storytelling, VR reconstruction of historic buildings, and immersive archives.
- Grants have been awarded to museums, universities, and libraries to create VR experiences of Indigenous cultures, battlefields, and immigrant journeys, expanding digital tourism resources.
Statistisches Bundesamt (Destatis) – Germany
- In Germany, 85% of cultural institutions have integrated digital visitor services, from virtual exhibits to 360° media experiences and multilingual virtual guides.
- Virtual museum tours experienced a 6x increase in viewership from 2019 to 2022, a trend accelerated by COVID-19 lockdowns and sustained through ongoing digital funding.
- Berlin State Museums’ digital experiences registered 4.8 million online visits in 2023, reflecting rising demand for accessible, virtual cultural content among global audiences.
Australian Government – Australia Council for the Arts
- In 2022, 39% of Australians reported participating in virtual cultural tourism, including online festivals, digital art tours, and interactive heritage experiences.
- That same year, over 2,500 events across Australia incorporated hybrid or virtual formats, demonstrating the country’s strong post-pandemic pivot to digital tourism engagement.
Ministry of Tourism – India
- Under the “Dekho Apna Desh” initiative, India launched 65+ immersive virtual tours, covering UNESCO heritage sites, religious destinations, and cultural trails in multiple languages.
- The Archaeological Survey of India (ASI) has digitized over 250 monuments, such as Qutub Minar, Sun Temple, and Hampi, using drone footage and VR walkthroughs.
- The Taj Mahal’s virtual tour received 2.1 million unique visits in its first year, offering global travelers a chance to explore the monument via 360° views, audio guides, and historical context.
Global Virtual Tourism Market: Market Dynamic
Driving Factors in the Global Virtual Tourism Market
Government-led digitization of national parks, museums, and monuments
Public-sector digitization initiatives across nations are laying the groundwork for the virtual tourism market’s rapid expansion. Institutions like the U.S. National Park Service, Smithsonian Institution, British Museum, Louvre, and the Indian Ministry of Culture are increasingly digitizing collections, launching virtual walkthroughs, and investing in immersive storytelling.
The U.S. government’s Open Access initiative has placed over 3 million artifacts online for public engagement, many in VR-compatible formats. Meanwhile, the Smithsonian Institution reported a 25% year-on-year increase in digital museum visits between 2021 and 2023. Similarly, India’s “Adopt a Heritage” scheme incentivizes private participation in VR content development for historical sites.
These efforts enhance accessibility for domestic and international audiences, especially those unable to travel. Beyond tourism, they serve educational and diplomatic purposes, allowing institutions to project national heritage globally while also monetizing digital assets. Many of these initiatives are funded by government grants, UNESCO partnerships, or recovery funds aimed at revitalizing the cultural sector post-COVID.
Additionally, several countries have developed digital heritage guidelines (e.g., Italy's “Digital Cultural Heritage Observatory”) to ensure quality, authenticity, and standardization. These foundational digital resources are now being integrated into virtual travel platforms, e-learning modules, and travel planning apps, acting as catalysts for market scalability.
Rising internet penetration and VR/AR hardware accessibility
Expanding broadband infrastructure and increasing the affordability of immersive technology are democratizing access to virtual tourism. According to the ITU, global internet penetration reached 67% in 2023, with over 95% in North America and Europe. Developing countries like India and Brazil have also seen broadband subscriptions rise sharply due to 4G/5G rollouts and government-led digital inclusion schemes.
Parallelly, the cost of VR and AR hardware has reduced by over 35% in the last five years. Devices like Meta Quest 2, Samsung Gear VR, and affordable Google Cardboard-based headsets have enabled even middle-income consumers to access high-quality immersive experiences. Educational and public institutions are also adopting VR equipment at scale.
For instance, Germany’s federal libraries and Japan’s public schools integrate VR tools in public education initiatives, expanding use beyond leisure travel. Furthermore, major platforms like YouTube, Facebook, and Expedia now support 360-degree videos and WebVR, eliminating the need for specialized apps or expensive gear.
This convergence of high-speed connectivity and consumer-ready immersive devices has created a fertile ecosystem where virtual travel experiences can thrive, whether streamed from smartphones, desktops, or dedicated VR gear. The accessibility shift not only fuels adoption but also encourages content creators and destination marketers to invest in virtual storytelling formats.
Restraints in the Global Virtual Tourism Market
Limited infrastructure and digital readiness in emerging markets
One of the most significant challenges for virtual tourism’s global expansion is the uneven digital infrastructure across regions. While developed countries enjoy widespread 5G connectivity, fiber broadband, and affordable VR-compatible devices, large parts of Africa, South Asia, and Latin America still lack reliable, high-speed internet.
According to the World Bank, nearly 40% of people in low-income nations lack any internet access. Even where basic connectivity exists, unstable power supply, low bandwidth, and high data costs render streaming immersive content difficult. These issues disproportionately affect rural populations, informal education centers, and small tourism operators that might otherwise benefit from digital tourism.
Public libraries, schools, and cultural institutions in many developing regions lack the funding and technical know-how to digitize or host virtual content. The digital divide limits not only user access but also content creation from these geographies, leading to an imbalanced representation of global culture in virtual tourism platforms. Without targeted government programs, private-sector investment, and international development support, the immersive tourism market risks reinforcing digital inequities. Therefore, robust infrastructure development and localized content strategies are crucial to ensuring that virtual tourism becomes a globally inclusive experience rather than a luxury of the digitally privileged.
Lack of regulation and content quality standardization
Despite its rapid growth, the virtual tourism industry still suffers from inconsistent content quality, a lack of technical interoperability, and the absence of clear legal and regulatory frameworks. Virtual tours today vary dramatically in terms of resolution, navigability, narrative quality, and user accessibility. Some may be little more than slideshow-based walkthroughs, while others offer fully immersive, interactive simulations.
This inconsistency undermines consumer trust and makes it difficult for educators, tourism boards, and public institutions to integrate virtual experiences into formal programming. Additionally, issues like copyright disputes over 3D models, inadequate disclosure of virtual vs. real footage, and non-compliance with data privacy laws have surfaced.
Organizations such as the Global Sustainable Tourism Council (GSTC) have offered guidelines for sustainable tourism, but immersive digital experiences remain outside most regulatory purviews. This lack of oversight also enables misinformation or culturally insensitive representations to circulate, especially in user-generated content. Without international or national standards for quality assurance, accessibility, metadata structuring, and cultural authenticity, the market faces reputational and legal risks. Institutional adoption, such as by museums, schools, or tourism boards, also remains hesitant due to the lack of universally accepted evaluation frameworks. To unlock scalable trust and value, industry-wide protocols and certifications are urgently needed.
Opportunities in the Global Virtual Tourism Market
Broadening access for mobility-challenged, elderly, and underserved communities
Virtual tourism holds transformative potential for individuals restricted by physical, geographic, or financial limitations. Globally, over 1 billion people live with some form of disability, according to the WHO. Many of them face barriers when engaging in traditional travel due to mobility impairments, visual or auditory challenges, or chronic health issues. Virtual tourism platforms can help overcome these barriers by offering screen-reader–friendly interfaces, narrated experiences, subtitles, and haptic feedback. Government institutions like the Library of Congress and the National Gallery in London have adopted accessible virtual exhibition standards, enabling inclusive cultural experiences.
In rural areas or developing nations, where travel infrastructure is sparse or unaffordable, virtual experiences open doors to global discovery. Additionally, for the aging population, especially in countries like Japan, Germany, and Italy, virtual tours offer a safe, convenient, and cognitively engaging alternative to physical travel. Such applications are increasingly embedded in telehealth and elderly care facilities.
The emotional well-being impact is also noteworthy, as virtual travel reduces social isolation. Educationally, students from remote or low-income areas can digitally visit NASA museums, the Vatican, or the Great Barrier Reef at zero cost. Thus, virtual tourism stands not only as a leisure innovation but as a powerful enabler of cultural inclusion and mental enrichment.
Local government partnerships for regional promotion and cultural exports
Tourism boards and local municipalities are increasingly investing in immersive storytelling to promote regional destinations. Governments are collaborating with startups and visual content firms to showcase local heritage, gastronomy, festivals, and ecotourism assets. Japan’s JNTO, for instance, has partnered with VR companies to build immersive experiences of Kyoto, Mount Fuji, and remote islands, allowing global viewers to ‘walk’ through scenic lanes or temples. Similarly, India’s Ministry of Tourism, via the “Dekho Apna Desh” initiative, launched over 65 curated virtual experiences of palaces, battlefields, and folk traditions during the pandemic, now hosted on YouTube and government portals.
Such efforts not only support national branding but also enable small towns and indigenous communities to monetize culture through digital footfall and storytelling. In Europe, France and Italy have funded the digital reconstruction of medieval towns and Renaissance art galleries, collaborating with VR studios for education and tourism. These localized projects benefit from government backing, authenticity, and integration with national tourism websites. They also attract diaspora engagement and encourage off-season digital tourism revenue. This presents a scalable model for other countries to transform their regional cultural capital into immersive assets that fuel inbound virtual tourism demand and soft power projection.
Trends in the Global Virtual Tourism Market
Immersive heritage digitization is gaining global momentum.
The acceleration of immersive heritage digitization is transforming how global audiences experience cultural landmarks. International organizations like UNESCO and national governments are now funding advanced 3D mapping, LiDAR scans, and photogrammetry to preserve and showcase monuments virtually. UNESCO’s “Memory of the World” initiative and partnerships with Google Arts & Culture have helped digitize over 300 cultural landmarks, including Angkor Wat, the Colosseum, and Machu Picchu. These virtual archives go beyond visual experience by offering voiceovers, interactive timelines, and context-based storytelling. The shift enables museums, schools, and even tourism boards to promote global accessibility and cultural preservation.
It also ensures digital resilience in the face of geopolitical conflicts, climate events, or mass tourism that endangers sensitive sites. Furthermore, tech companies and nonprofits are collaborating to protect endangered sites, e.g., CyArk has created digital twins of at-risk structures. Such digitization aligns with a rising demand for edutainment experiences and helps fuel sustainable tourism objectives without relying on physical footfall.
Governments are also increasingly issuing grants for VR-based educational projects, embedding such experiences into public libraries, classrooms, and embassies for soft power diplomacy. In sum, this digitization wave is not just a trend but a policy-backed movement that intertwines culture, conservation, and virtual experience economy.
Smart tourism integration in digital city frameworks
Cities embracing digital transformation are now embedding virtual tourism capabilities into their smart city blueprints. Leading examples include Amsterdam, Seoul, and Barcelona, which incorporate digital kiosks, geospatial overlays, and AI-driven virtual guides into their tourism infrastructure.
According to the EU’s Smart Tourism Capitals program, 60% of major European destinations have at least one immersive tourism pilot. These features allow real-time updates on events, weather-based itinerary adjustments, and AI-assisted crowd flow monitoring to optimize both in-person and virtual engagement. In Japan, Yokohama’s Smart Tourism Initiative offers a hybrid tourism model blending AR navigation in physical spaces and immersive VR tours online.
Similarly, the UAE’s “Digital Dubai” vision integrates 360° site simulations and virtual museum walkthroughs into its city tourism apps. These platforms enhance user engagement, reduce over-tourism in saturated zones, and expand digital visitation during low seasons. With cities increasingly reliant on digital economies and tourism as a GDP contributor, these immersive features act as scalable extensions of city branding and traveler experience. As 5G infrastructure rolls out globally, latency-free streaming of 4K and 8K virtual environments will further enhance this transformation, making smart tourism an embedded and expected service layer in destination management strategies.
Global Virtual Tourism Market: Research Scope and Analysis
By Type Analysis
The 3D Virtual Tour segment is projected to lead the global virtual tourism market owing to its immersive visual experience and higher realism compared to traditional formats. Unlike static images or video walkthroughs, 3D virtual tours provide a dynamic, navigable environment that closely replicates real-world travel experiences. Travelers can explore destinations as if they were physically present, moving through spaces, zooming in on details, and viewing locations from different angles. This type is especially popular among tourism boards, luxury resorts, and cultural institutions looking to recreate lifelike experiences for marketing or educational purposes.
Moreover, 3D tours are often integrated with geospatial data and interactive hotspots that provide historical, architectural, or cultural insights during the digital visit. They also support virtual guides, language translation, and personalized narratives, improving user engagement. The growth of 3D content creation tools and the accessibility of cloud rendering platforms have further fueled adoption. The COVID-19 pandemic accelerated the use of 3D virtual tours in travel and real estate, and the trend has persisted post-pandemic as users and providers embrace hybrid tourism models.
Additionally, integration with VR headsets enhances realism, allowing users to "walk" through heritage sites, national parks, or hotel rooms with full visual depth. With increased investment in smart tourism infrastructure and digitization of historical assets, 3D virtual tours are expected to see sustained growth. Countries like the UAE, Japan, and the U.S. have incorporated these tours into national tourism portals, emphasizing their market dominance. The versatility and engagement factor make 3D Virtual Tours the most preferred type among global users and suppliers.
By Type Analysis
3D Virtual Tours are anticipated to dominate this segment due to their immersive and interactive design, offering users a realistic experience of exploring destinations from their homes. Unlike traditional video or image-based content, 3D tours allow virtual travelers to navigate through locations at their own pace, choose paths, zoom into features, and interact with clickable hotspots. These capabilities have made 3D tours particularly attractive for tourism boards, hotels, museums, and even cultural heritage sites.
This type is widely used for marketing, virtual walk-throughs, and promotional content by travel agencies and national tourism bodies. The increasing availability of 3D mapping software and integration with VR devices has further accelerated its popularity. Additionally, 3D virtual tours have proven valuable in democratizing access to tourism, allowing users from any part of the world to explore iconic landmarks, regardless of physical or financial limitations. With tourism entities striving for inclusivity, 3D virtual tours present a cost-effective, sustainable, and accessible alternative.
Moreover, they contribute to carbon footprint reduction by substituting physical travel for educational or preliminary exploration purposes. Advancements in photogrammetry and drone-based 3D modeling continue to improve visual fidelity, further reinforcing their dominance. Several destinations, like the Louvre Museum, Machu Picchu, and the Burj Khalifa, now offer official 3D virtual experiences. As more organizations digitize physical spaces for engagement, branding, or monetization, the 3D Virtual Tour segment is expected to retain its leading position in the global virtual tourism landscape.
By Product Type Analysis
Cloud-based solutions are expected to dominate the product type segment due to their scalability, accessibility, and cost efficiency. Unlike web-based systems that often rely on local infrastructure and browsers, cloud platforms provide flexible access across devices and allow storage, management, and delivery of virtual tour content from centralized servers. This makes them ideal for travel agencies, hotel chains, and cultural institutions operating across multiple geographies. Cloud hosting ensures uninterrupted service availability and enables real-time updates, analytics integration, and global content distribution, which are crucial in delivering high-quality virtual experiences.
Additionally, cloud platforms often support AI-driven personalization, multilingual support, and user behavior tracking to refine offerings. Many cloud-based virtual tourism platforms integrate with SaaS tools such as CRM and CMS systems, enhancing marketing and engagement efforts. Cloud computing also supports rendering-intensive applications like 3D tours, spatial audio, and VR content without requiring high-end hardware on the user's end. Moreover, cloud platforms simplify collaboration among developers, designers, and marketers who can co-create and update content seamlessly.
The pay-as-you-go model allows small and mid-sized providers to enter the market without heavy upfront investment. Enhanced data security protocols offered by major providers like AWS, Google Cloud, and Azure further boost confidence among stakeholders. The ability to instantly scale user capacity during peak seasons or marketing campaigns makes cloud-based solutions the backbone of the virtual tourism infrastructure. As global tourism authorities and organizations embrace digital transformation, cloud-based deployment remains the dominant and most future-ready approach.
By Technology Analysis
3D Scanning and Imaging technology is projected to hold dominance in the virtual tourism market because it provides unparalleled detail, realism, and spatial accuracy. This technology enables the creation of digital twins of physical environments, capturing the geometry, texture, and spatial layout of real-world sites with precision. These digital replicas can be experienced in 3D environments or VR, offering a true-to-life simulation of visiting a place.
For destinations such as UNESCO heritage sites, historic monuments, and remote natural landscapes, 3D scanning ensures cultural preservation and provides global access to fragile or restricted locations. It is increasingly used by museums, tourism boards, and real estate developers for virtual walkthroughs. The combination of LiDAR, drone photogrammetry, and structured light scanning allows for intricate modeling of indoor and outdoor environments. These models can be enhanced with AI, metadata tagging, and virtual guides to enrich the experience.
Moreover, 3D imaging is compatible with head-mounted displays (HMDs) and AR glasses, expanding its reach in both consumer and enterprise applications. The growing demand for digital heritage preservation and remote tourism experiences, especially during travel restrictions, has positioned 3D scanning at the forefront of technology adoption. Institutions like the Smithsonian, British Museum, and Petra’s archaeological sites have embraced 3D imaging to open up access. With the rise of XR (Extended Reality) platforms, this technology’s role is set to expand further. Its capability to deliver high-resolution, photorealistic environments with spatial awareness makes it the cornerstone technology for immersive virtual tourism.
ℹ
To learn more about this report –
Download Your Free Sample Report Here
By Supplier Analysis
Direct Suppliers are projected to dominate this segment because they offer immediate access to content creators, developers, and solution providers, allowing tourism organizations to customize and control the virtual experience. These suppliers typically consist of virtual tour software developers, 3D scanning companies, and VR content creators who work directly with tourism operators, hotels, and cultural institutions to develop tailored solutions. The advantage of direct interaction is greater creative freedom, integration with proprietary tools, and reduced dependency on intermediaries.
As demand for hyper-personalized and location-specific virtual experiences grows, direct suppliers can incorporate client branding, specific data layers (such as maps, audio tours, and ticketing systems), and compliance with local tourism regulations. Direct suppliers also offer technical support, training, and platform integration services, which are critical for government tourism boards, museums, and educational institutions venturing into virtual platforms.
Moreover, they usually provide scalable solutions that accommodate both basic 360° photography and high-end VR simulations. With the shift toward experiential digital marketing, many travel firms now prefer direct partnerships to maintain creative control and ensure brand consistency.
These suppliers are also more agile in adopting emerging technologies like haptic feedback and real-time localization. Several high-profile virtual tourism experiences, such as Dubai 360 or Matterport-powered property tours, are produced through direct collaborations. As the industry evolves from generic to niche offerings, direct suppliers will continue to dominate by delivering bespoke, data-integrated, and immersive solutions that exceed standard distribution capabilities.
By Application Analysis
Tourism is poised to be the leading application segment in the virtual tourism market, driven by increasing demand for immersive travel experiences, especially among tech-savvy and mobility-restricted populations. Virtual tourism platforms allow users to explore famous landmarks, cultural sites, resorts, and cities before booking or in place of physical travel. These experiences serve as both a marketing tool and a stand-alone service, especially in regions where geopolitical tensions, environmental concerns, or accessibility issues deter physical tourism.
Tourism boards, national heritage organizations, and international travel operators are leveraging virtual experiences to attract global audiences. For instance, destinations like Paris, Dubai, and Kyoto offer immersive tours of key landmarks, allowing virtual visitors to walk through historic districts, museums, and marketplaces. These applications not only boost destination visibility but also serve as educational tools, especially for students and remote learners. The use of VR headsets enhances user engagement, providing realistic simulations of weather, lighting, sounds, and cultural performances.
Additionally, virtual tourism has proven effective for senior citizens and differently-abled individuals who face challenges in long-distance travel. Several tour operators now offer hybrid packages where users begin their journey virtually and transition into real travel. The ability to monetize virtual experiences through ticket sales, merchandise, and advertising also supports growth. Post-pandemic travel hesitancy has further driven interest in digital alternatives. As sustainable and inclusive travel gains traction, virtual tourism is becoming a key channel within the broader tourism industry. Its scalability and reach make it the most dominant application in this market.
By End Use Analysis
Travelers and Tourists are anticipated to represent the dominant end-user segment, primarily because they are the most frequent and engaged consumers of virtual tourism experiences. Whether planning a future trip, exploring inaccessible destinations, or satisfying curiosity from home, individual users are increasingly turning to virtual tours for both inspiration and entertainment. Platforms like Google Earth VR, YouVisit, and Expedia VR offer immersive previews of destinations, enabling travelers to make informed decisions about hotels, itineraries, and cultural attractions. These experiences enhance customer confidence and reduce travel anxiety, especially for international or first-time travelers.
Moreover, tourists use virtual tourism as a planning tool, identifying must-see spots, understanding local geography, and exploring cultural nuances before arrival. The integration of AR and VR into mobile apps and travel booking platforms has made virtual content more accessible to the average tourist. For example, apps that overlay AR information at historic sites or museums enrich physical travel while providing continuity between virtual and real-world exploration. The pandemic also triggered a shift in traveler behavior, with many using virtual travel to substitute canceled trips or engage in “armchair tourism.
Additionally, this segment includes digital nomads and adventure seekers using virtual tools to scout destinations for long stays. Younger demographics, particularly Gen Z and Millennials, are more likely to adopt immersive tech as part of their travel planning. As global internet connectivity and smartphone penetration grow, so does this user base. Given their high interaction rate, content consumption patterns, and travel expenditure influence, travelers and tourists remain the central focus of virtual tourism innovations.
The Global Virtual Tourism Market Report is segmented on the basis of the following:
By Type
- 3D Virtual Tour
- 3D Static Tours
- 3D Interactive Tours
- 360 Virtual Tour
- Single Location 360 Tours
- Multiple Location 360 Tours
- Virtual Reality (VR) Tour
- Immersive VR Tours
- Non-immersive VR Tours
By Product Type
By Technology
- 3D Scanning and Imaging
- Photogrammetry
- Computer Vision
- Haptic Feedback
- Spatial Audio
- Other Advanced Technologies
By Suppliers
- Direct Suppliers
- Airlines
- Hotel Campaigns
- Tour Operators
- Government Tourism Bodies
- Indirect Suppliers
- Online Travel Agencies (OTAs)
- Traditional Travel Agencies
- Travel Management Companies (TMCs)
- Corporate Buyers
- Aggregators
By Application
- Tourism
- Real Estate
- Art Galleries & Museums
- Others
By End Use
- Travelers and Tourists
- Hospitality & Accommodation Providers
- Cultural & Historical Institutions
- Entertainment & Recreational Venues
- Educational & Training Institutions
- Others
Impact of Artificial Intelligence in the Global Virtual Tourism Market
- Personalized Virtual Itineraries: AI algorithms analyze user behavior, preferences, and search history to generate customized virtual travel experiences, including tailored tour routes, attraction suggestions, and accommodation previews, significantly enhancing user satisfaction and engagement across virtual platforms.
- Intelligent Chatbots and Virtual Guides: AI-powered chatbots and virtual tour guides offer real-time assistance during virtual tours, providing contextual information, answering queries, and enhancing interactivity. These guides simulate human-like interactions, making virtual tourism more engaging, informative, and accessible for global audiences.
- Enhanced Visual Recognition and Tagging: Computer vision and AI-driven image recognition help automatically tag landmarks, artworks, or historical sites within virtual environments, enriching the user experience by providing instant data overlays and immersive storytelling through augmented facts and multimedia integration.
- AI-Driven Multilingual Translation: AI-based language models enable seamless real-time translation of tour content, subtitles, and voice narration. This allows virtual tourism platforms to serve diverse global users, breaking language barriers and making cultural experiences more inclusive and widely accessible.
- Predictive Analytics for Demand Forecasting: AI leverages big data to forecast user demand trends, peak engagement periods, and content preferences. This allows tourism boards and businesses to optimize content creation, server resources, and marketing strategies, enhancing operational efficiency and user retention.
Global Virtual Tourism Market: Regional Analysis
Region with the Largest Revenue Share
North America is projected to lead the global virtual tourism market with 37.10% of the total market share in 2025, due to its advanced technological infrastructure, high penetration of high-speed internet, and widespread adoption of immersive technologies like VR and AR. The United States, in particular, houses several tech giants such as Meta (Oculus), Microsoft, and Google that are pivotal in advancing virtual tourism platforms. These companies have heavily invested in developing 3D visualization, virtual tours, and immersive VR experiences that attract consumers across segments such as travel, education, and entertainment.
Furthermore, consumers in North America exhibit high digital literacy, enabling quicker adoption of virtual tourism tools for planning, exploration, and remote engagement. The region also benefits from strong content creation capabilities, with firms producing high-quality virtual tours of cultural landmarks, national parks, museums, and iconic cities.
Another key factor contributing to North America’s dominance is the region’s focus on accessible tourism solutions, especially post-COVID, enabling vulnerable or disabled travelers to explore destinations virtually. Government support in digitizing cultural and historical assets and funding VR innovation in tourism further enhances market maturity. The strong presence of tourism boards and agencies utilizing virtual platforms for destination marketing has accelerated this trend. Additionally, the education and training sectors in North America are adopting virtual tourism for virtual field trips and geographic learning, expanding their end-use base.
ℹ
To learn more about this report –
Download Your Free Sample Report Here
Region with the Highest CAGR
Asia-Pacific is experiencing the fastest growth in the global virtual tourism market due to the rapid digital transformation, rising middle-class disposable income, and increased smartphone and internet penetration across countries like China, India, Japan, and South Korea. Governments in the region have undertaken large-scale digitization of cultural heritage, museums, and tourist sites, offering virtual access to iconic landmarks. This includes projects like the "Digital Silk Road" in China and "Incredible India" campaigns integrating VR tours.
The region is home to highly tech-savvy populations, particularly millennials and Gen Z, who are enthusiastic users of immersive technologies for travel planning and virtual exploration. Countries such as Japan and South Korea have become innovation hubs for immersive tech development, including VR headsets, 3D imaging, and haptic feedback systems, which are driving virtual tourism solutions locally and globally.
Additionally, rising concerns over travel restrictions, sustainability, and environmental conservation have prompted tourism operators and governments to promote virtual alternatives, which help preserve physical heritage while promoting tourism virtually. The growing presence of affordable VR devices and increasing investment from tech start-ups and tourism firms also accelerates adoption. With increased focus on smart tourism initiatives across ASEAN and East Asian nations, and growing demand for immersive and multilingual tourism content, Asia-Pacific is poised to experience the highest CAGR, outpacing developed regions as infrastructure and digital ecosystems mature.
By Region
North America
Europe
- Germany
- The U.K.
- France
- Italy
- Russia
- Spain
- Benelux
- Nordic
- Rest of Europe
Asia-Pacific
- China
- Japan
- South Korea
- India
- ANZ
- ASEAN
- Rest of Asia-Pacific
Latin America
- Brazil
- Mexico
- Argentina
- Colombia
- Rest of Latin America
Middle East & Africa
- Saudi Arabia
- UAE
- South Africa
- Israel
- Egypt
- Rest of MEA
Global Virtual Tourism Market: Competitive Landscape
The global virtual tourism market is highly competitive, marked by the presence of tech giants, tourism service providers, and innovative startups. Key players include Meta (Oculus), Google, Microsoft, and Samsung, all of which are developing immersive VR platforms and content distribution ecosystems. These companies focus on building user-friendly interfaces, real-time interactivity, and compatibility with various VR/AR hardware to enhance consumer engagement. Companies like Matterport and EyeSpy360 specialize in 3D virtual tours and real estate visualization, expanding the use of virtual tourism technology into non-travel applications.
Startups such as Ascape VR, YouVisit, and Nodalview provide scalable, cloud-based solutions targeting small tourism operators and hospitality providers. Meanwhile, travel service platforms like Expedia Group and TripAdvisor (Viator) are integrating virtual experiences for pre-booking exploration and remote destination sampling. The competitive intensity is driven by innovation in immersive content development, localization, gamification, and AI-driven personalization of virtual tours. Strategic collaborations between tourism boards, hotel chains, and tech providers are also shaping the competitive ecosystem, with many forming public-private partnerships to digitize heritage and improve destination marketing.
Additionally, regional players like Dubai 360 and Japan’s virtual temple tours leverage local assets to build a niche presence. Mergers, acquisitions, and R&D investments are frequent, with the goal of enhancing hardware-software integration and platform scalability. With new entrants targeting niche verticals such as education, cultural heritage, and wellness tourism, the market is dynamic and evolving rapidly. The ability to deliver high-quality, interactive, and immersive user experiences remains the central competitive differentiator.
Some of the prominent players in the Global Virtual Tourism Market are:
- Google
- Meta (Oculus)
- Microsoft
- Expedia Group
- Samsung
- Dubai 360
- Matterport
- YouVisit
- Ascape VR
- TripAdvisor / Viator
- EyeSpy360
- Panomatics
- LCP Media (TourBuilder)
- Concept3D
- Nodalview
- RTV, Inc. (Real Tour Vision)
- Within
- Immersion VR
- Varjo
- Glome
- Other Key Players
Recent Developments in the Global Virtual Tourism Market
July 2025
- Meta launched an AI-enhanced VR travel platform that uses generative AI to recreate historical landmarks and simulate natural environments, pushing the boundaries of immersive travel experiences.
- Google Earth VR introduced real-time terrain data overlays, enabling users to experience updated geographical features and tourism hotspots with higher accuracy.
May 2025
- YouVisit partnered with global hotel chains to integrate VR tours into booking platforms, enhancing customer decision-making through immersive previews.
- Samsung unveiled a 360-degree travel camera with real-time streaming, aimed at travel influencers and virtual tour operators to create live immersive tourism events.
March 2025
- Matterport secured investment to expand its AI imaging capabilities, with a focus on high-fidelity virtual tour creation for cultural institutions and remote tourism.
- TripAdvisor/Viator integrated VR previews into its experience booking interface, helping users explore activities virtually before making a purchase.
December 2024
- Dubai 360 announced a major content refresh initiative, capturing updated VR content for 100+ tourism sites, aligning with Expo 2025 visitor demand.
- Panomatics collaborated with European museums to digitize exhibits in 360° walkthroughs, promoting cultural tourism in the virtual space.
October 2024
- Nodalview introduced an AI-optimized visual enhancement engine, improving the lighting and clarity of VR tourism visuals, especially for low-light environments.
- Microsoft’s Mixed Reality unit partnered with tourism boards in Japan and Australia to develop location-based VR travel experiences.
August 2024
- RTV Inc. launched a global VR tourism hub platform consolidating virtual travel experiences across cities and continents in a unified portal.
- EyeSpy360 integrated voice-guided narration features in their tours, enhancing accessibility for visually impaired and multilingual users.
June 2024
- Concept3D hosted a virtual tourism innovation summit, bringing together industry experts to discuss AI, AR/VR, and content development for virtual travel.
- Within and Immersion VR co-launched an immersive cultural storytelling series in partnership with historical foundations across Asia and Europe.
Report Details
| Report Characteristics |
| Market Size (2025) |
USD 16.3 Bn |
| Forecast Value (2034) |
USD 33.4 Bn |
| CAGR (2025–2034) |
8.3% |
| Historical Data |
2019 – 2024 |
| The US Market Size (2025) |
USD 5.1 Bn |
| Forecast Data |
2025 – 2033 |
| Base Year |
2024 |
| Estimate Year |
2025 |
| Report Coverage |
Market Revenue Estimation, Market Dynamics, Competitive Landscape, Growth Factors, etc. |
| Segments Covered |
By Type (3D Virtual Tour, 360 Virtual Tour, Virtual Reality (VR) Tour), By Product Type (Cloud-Based, Web-Based), By Technology (3D Scanning and Imaging, Photogrammetry, Computer Vision, Haptic Feedback, Spatial Audio, Other Advanced Technologies), By Suppliers (Direct Suppliers, Indirect Suppliers), By Application (Tourism, Real Estate, Art Galleries & Museums, Others), By End Use (Travelers and Tourists, Hospitality & Accommodation Providers, Cultural & Historical Institutions, Entertainment & Recreational Venues, Educational & Training Institutions, Others) |
| Regional Coverage |
North America – US, Canada; Europe – Germany, UK, France, Russia, Spain, Italy, Benelux, Nordic, Rest of Europe; Asia-Pacific – China, Japan, South Korea, India, ANZ, ASEAN, Rest of APAC; Latin America – Brazil, Mexico, Argentina, Colombia, Rest of Latin America; Middle East & Africa – Saudi Arabia, UAE, South Africa, Turkey, Egypt, Israel, Rest of MEA |
| Prominent Players |
Google, Meta (Oculus), Microsoft, Expedia Group, Samsung, Dubai 360, Matterport, YouVisit, Ascape VR, TripAdvisor / Viator, EyeSpy360, Panomatics, LCP Media (TourBuilder), Concept3D, Nodalview, RTV, Inc. (Real Tour Vision), Within, Immersion VR, Varjo, Glome, and Other Key Players |
| Purchase Options |
We have three licenses to opt for: Single User License (Limited to 1 user), Multi-User License (Up to 5 Users), and Corporate Use License (Unlimited User) along with free report customization equivalent to 0 analyst working days, 3 analysts working days, and 5 analysts working days respectively. |
Frequently Asked Questions
How big is the Global Virtual Tourism Market?
▾ The Global Virtual Tourism Market size is estimated to have a value of USD 16.3 billion in 2025 and is expected to reach USD 33.4 billion by the end of 2034.
What is the growth rate in the Global Virtual Tourism Market in 2025?
▾ The market is growing at a CAGR of 8.3 percent over the forecasted period of 2025.
What is the size of the US Virtual Tourism Market?
▾ The US Virtual Tourism Market is projected to be valued at USD 5.1 billion in 2025. It is expected to witness subsequent growth in the upcoming period as it holds USD 10.0 billion in 2034 at a CAGR of 7.8%.
Which region accounted for the largest Global Virtual Tourism Market?
▾ North America is expected to have the largest market share in the Global Virtual Tourism Market with a share of about 37.10% in 2025.
Who are the key players in the Global Virtual Tourism Market?
▾ Some of the major key players in the Global Virtual Tourism Market are Google, Meta (Oculus), Microsoft, Expedia Group, Samsung, Dubai 360, Matterport, and many others.