Market Overview
Quality management software (QMS) covers digital platforms that automate and centralize the processes organizations use to control documents, manage corrective actions, track non-conformances, and demonstrate compliance with standards such as ISO 9001 and ISO 13485. Spreadsheets, shared drives, and paper-based binders fall outside the definition; the market counts only purpose-built or deeply embedded QMS applications, whether delivered as standalone tools or as quality modules within enterprise resource planning or product lifecycle management suites.
A 2025 survey by LNS Research found that 25% of companies still rely on paper-based records for quality management rather than digital QMS tools, confirming that a large conversion opportunity sits in front of established vendors. Buyers moving off paper are not simply digitizing a filing cabinet; they are restructuring how quality decisions get made, communicated, and audited across geographically distributed teams and supply chains.
The broader industry context matters here. QMS platforms now sit at the intersection of enterprise software, regulatory technology, and AI-enabled operations. Vendors that historically competed on compliance checklists are now differentiating on workflow intelligence, real-time analytics, and integration depth with manufacturing execution systems. Buyers evaluating new platforms are therefore making infrastructure decisions, not just software purchases.
Quality Management Software Market Key Takeaways
- The Quality Management Software market size is USD 13.90 Billion in 2026 and is projected to hit USD 39.20 Billion by 2035 at a CAGR of 11.8%.
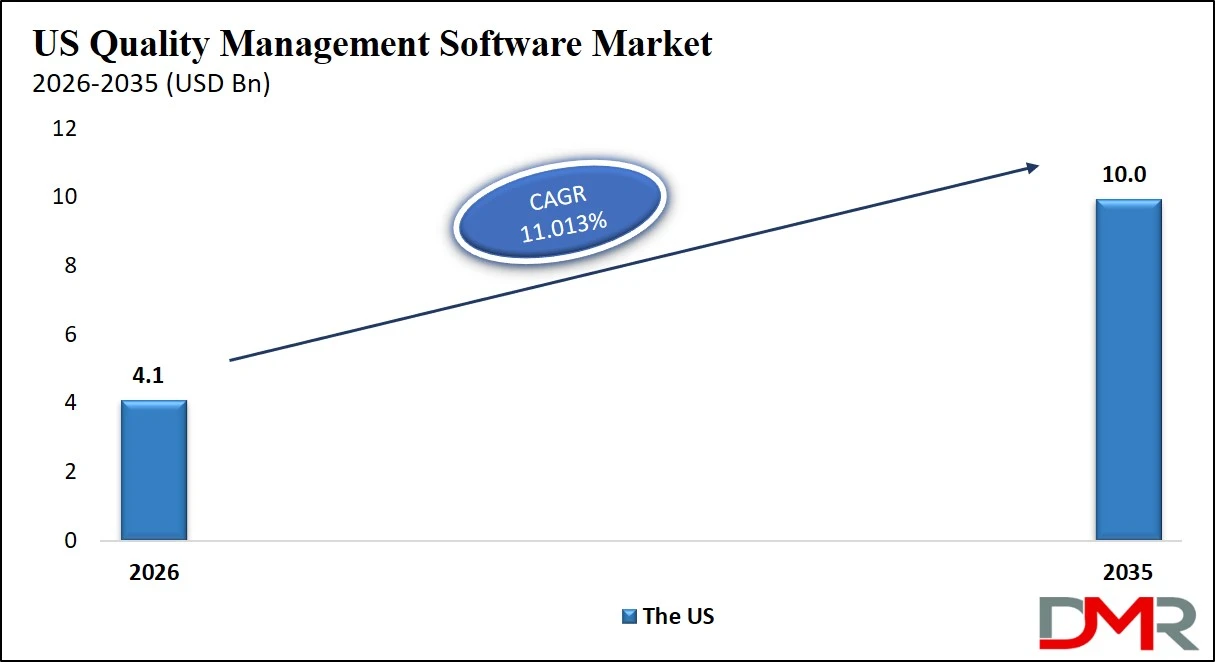
- U.S. QMS market is valued at USD 4.1 Billion in 2026 and is forecast to reach USD 10.0 Billion by 2035, growing at a CAGR of 11.03%.
- By Component: Software led with a 65.3% share in 2026.
- By Deployment: On-premise led with a 60.2% share in 2026.
- By Enterprise Size: Large Enterprise led with a 64.2% share in 2026.
- By Solution: Complaint Handling/Management led with a 16.7% share in 2026.
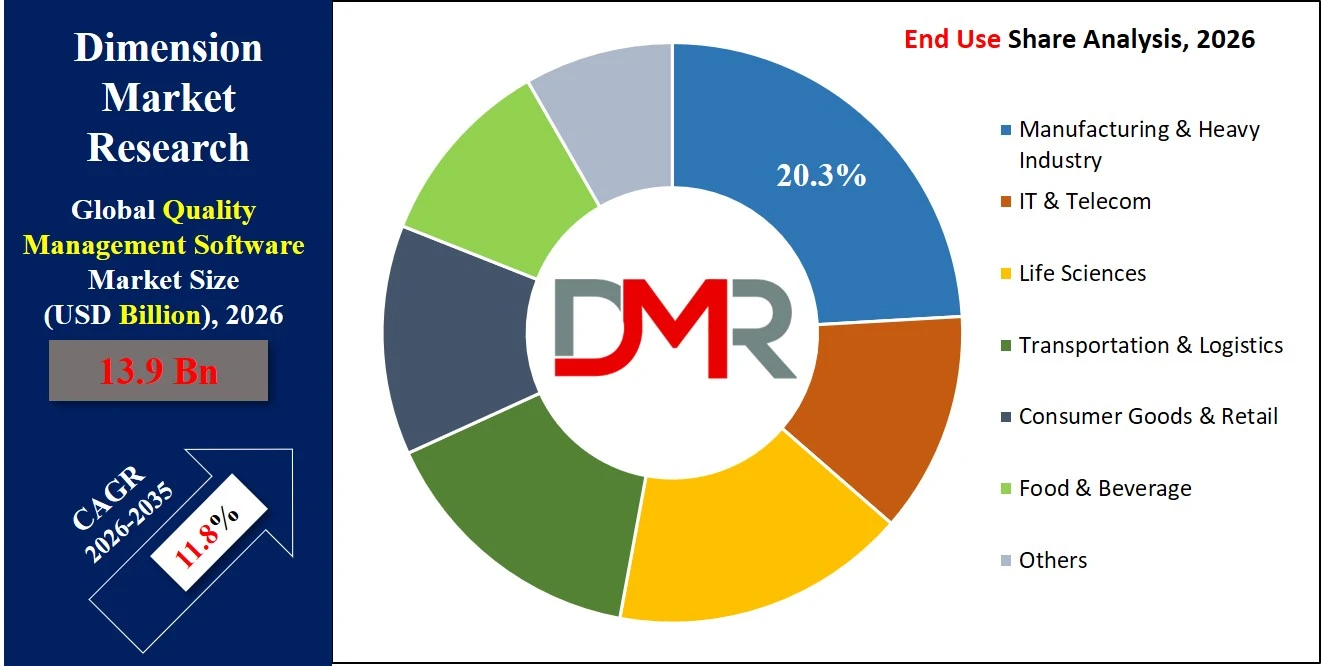
- By End Use: Manufacturing & Heavy Industry led with a 20.3% share in 2026.
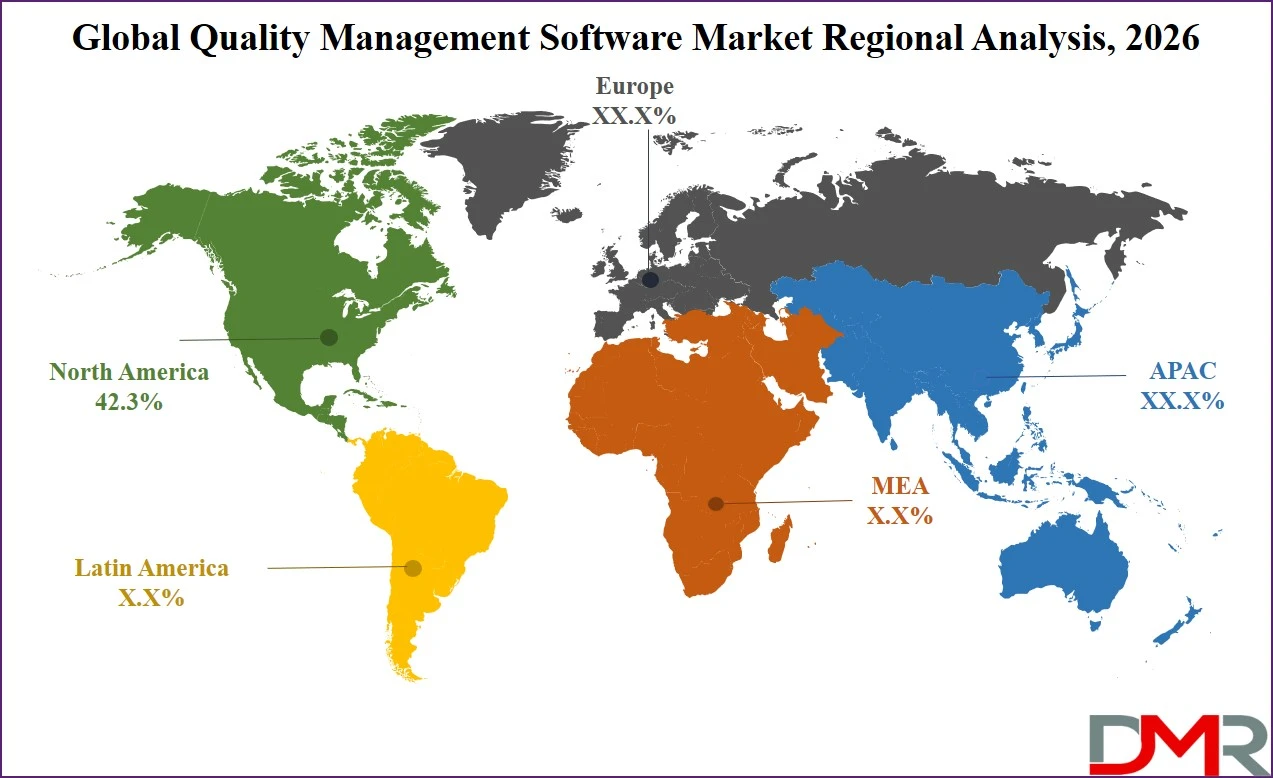
- By Region: North America led with a 42.3% share, valued at USD 5.79 Billion, in 2026.
- Asia Pacific is the fastest-growing region through the forecast period.
Global Quality Management Software Market Size & Forecast
The Global Quality Management Software Market was valued at USD 13.90 Billion in 2026 and is projected to reach USD 39.20 Billion by 2035, exhibiting a CAGR of 11.8% during the forecast period.
Historical growth from 2020 to 2024 was shaped by the accelerated digitization of quality processes during supply chain disruptions, which made the cost of manual error-tracking visible at the executive level for the first time in many organizations. Regulatory tightening across life sciences and medical devices sustained that spending even after supply chains stabilized, converting what was a crisis-driven adoption wave into durable baseline demand.
The 2026-to-2035 forecast rests on two reinforcing assumptions: continued regulatory tightening across life sciences and medical devices, and the expanding return on investment from electronic QMS platforms. Organizations deploying eQMS can realistically target a 20-35% reduction in Cost of Poor Quality by the second year, as reported by CloudTheApp, giving CFOs a defensible business case that accelerates purchasing decisions beyond what pure compliance mandates would otherwise drive.
Use cases
- Regulatory Compliance Management Enables organizations in pharmaceutical, medical device, and food industries to meet FDA, ISO, and GMP requirements through automated documentation control. Reduces audit preparation time and minimizes non-compliance penalties.
- Document Control and Version Management Centralizes SOPs, work instructions, and policy documents with automated version tracking and approval workflows. Prevents use of outdated documents on the production floor and ensures traceability.
- Corrective and Preventive Action (CAPA) Management Automates root cause analysis, corrective action tracking, and effectiveness verification across manufacturing and service operations. Closes quality loops faster and reduces recurring defects.
- Supplier Quality Management Tracks supplier performance, audit scores, and non-conformance history across the vendor base. Helps procurement teams identify and mitigate supply chain quality risks early.
- Audit Management and Inspection Readiness Streamlines internal and external audit scheduling, checklist execution, and findings tracking in a single system. Keeps organizations continuously inspection-ready rather than scrambling before audits.
- Training and Competency Management Links employee certifications and training records directly to job roles and quality procedures. Ensures only qualified personnel perform critical quality-related tasks.
Component Analysis
Software accounted for 65.3% of Component demand in 2026, the highest of any category.
Software's commanding share reflects the reality that most QMS buyers want a configurable application layer, not a services engagement. Standalone QMS software handles discrete compliance use cases, while integrated platforms embedded in ERP or PLM environments lock in long-term switching costs. Vendors offering both deployment models capture a wider range of buyer budgets and IT preferences, which is why the largest players have built hybrid portfolios rather than betting on either model exclusively.
Services remains a necessary segment even as software capabilities expand. Implementation and integration work commands the highest per-engagement fees, particularly in regulated industries where data migration from paper or legacy systems requires extensive validation. Consulting and advisory services grow in tandem with new regulatory releases, because compliance teams need external expertise before committing internal resources to a platform reconfiguration. Training and support maintains recurring revenue across both sub-segments and helps vendors reduce churn on multi-year contracts.
Deployment Analysis
With a 60.2% share in 2026, On-premise outpaced all other Deployment categories.
On-premise retention at this scale is not a legacy hold-out; it reflects active choices by regulated manufacturers, defense contractors, and healthcare systems where data residency, network isolation, and validated environment control carry more weight than total cost of ownership arguments favoring cloud. A plant running FDA-validated QMS software cannot migrate to a new cloud instance on a vendor's upgrade timeline. That constraint creates durable demand for on-premise even as the market slowly rotates toward cloud.
Cloud's 39.8% share understates its trajectory. New customer acquisitions skew heavily toward cloud, particularly among mid-market buyers and life sciences startups that lack the IT infrastructure to run enterprise QMS on-site. Cloud deployment also enables the AI-powered analytics and real-time dashboarding that vendors now use as competitive differentiators. Buyers locked into on-premise platforms will encounter a widening feature gap over the forecast period, creating a natural migration catalyst.
Enterprise Size Analysis
Large Enterprise captured 64.2% of the Enterprise Size segment in 2026, ahead of all rivals.
Large enterprises buy QMS at scale because regulatory pressure falls disproportionately on organizations with the highest production volumes, the most complex supply chains, and the broadest geographic footprints. A single FDA warning letter or ISO surveillance audit can trigger company-wide remediation programs worth multiples of the original software cost. That asymmetry justifies premium platform spending and drives large enterprises toward enterprise-grade QMS vendors with deep compliance coverage and dedicated professional services teams.
Small and medium enterprises represent the segment with the largest untapped potential across the forecast period. A 2025 Act! survey found that 45% of SMBs still rely on paper records and 11% have no document-management system at all, as reported by Sofcom. Vendors addressing this gap with self-service pricing, faster onboarding, and pre-configured regulatory templates will find a receptive buyer base that has historically been priced out of enterprise QMS solutions.
Solution Analysis
Complaint Handling/Management led the Solution segment with a 16.7% share in 2026.
Complaint management's top position follows from regulatory logic. FDA and ISO standards both require documented, traceable complaint handling as a baseline condition of market access. Buyers therefore deploy complaint management modules before expanding into other solution areas, making it the most common entry point into a full QMS suite. Vendors who anchor customer relationships through complaint modules then cross-sell CAPA, document control, and audit management to the same accounts over successive contract cycles.
CAPA closure time dropped from 60-plus days under manual tracking to 15-20 days after organizations moved CAPA management into an eQMS, according to data published by Pyraman. That efficiency gain has made CAPA one of the fastest-displacing sub-segments from manual processes. Document Control, Audit Management, and Supplier Quality Management all address areas where paper-based workflows create measurable compliance exposure. Risk Management and Change Management modules are gaining ground as buyers seek platforms that connect quality events to broader operational risk frameworks rather than treating them as isolated compliance tasks.
End Use Analysis
A 20.3% share made Manufacturing & Heavy Industry the clear leader across End Use categories in 2026.
Manufacturing's dominance is structural. Production environments generate the highest density of quality events per facility: incoming inspections, in-process checks, non-conformance reports, equipment calibrations, and supplier audits all run in parallel. A single automotive plant may manage thousands of PPAP submissions and FAI records alongside continuous layered process audits, creating a volume of quality data that manual systems cannot process without introducing error and delay.
Life Sciences holds a disproportionate revenue position relative to its facility count, because per-seat licensing and validation services carry significantly higher price points than manufacturing QMS deployments. IT and Telecom buyers drive adoption of cloud-native QMS platforms with API-first architectures. Food and Beverage is emerging as a high-volume growth segment as food safety regulations, including FSMA requirements in the U.S. and equivalent frameworks in Europe, mandate electronic traceability. Defense and Aerospace buyers contribute outsized contract values and multi-year commitments tied to AS9100 certification maintenance cycles.
ℹ
To learn more about this report –
Download Your Free Sample Report Here
Key Market Segments
By Component
- Software
- Standalone QMS Software
- Integrated/Enterprise QMS Platforms (ERP/PLM-embedded)
- Services
- Implementation & Integration
- Consulting & Advisory
- Training & Support/Maintenance
By Deployment
By Enterprise Size
- Large Enterprise
- Small & Medium Enterprises (SME)
By Solution
- Complaint Handling/Management
- Document Control
- Non-Conformances/Corrective & Preventive Action (CAPA)
- Employee Training Management
- Quality Inspections (PPAP & FAI)
- Audit Management
- Supplier Quality Management
- Calibration Management
- Change Management
- Mobile Incidents and Event Reporting
- Risk Management
By End Use
- Manufacturing & Heavy Industry
- IT & Telecom
- Life Sciences
- Transportation & Logistics
- Consumer Goods & Retail
- Food & Beverage
- Defense & Aerospace
- Utilities
- Government
- Healthcare
- Others
Regional Analysis
North America led all regions with a 42.3% share valued at USD 5.79 Billion in 2026.
North America's position derives from the concentration of FDA-regulated manufacturers, Fortune 500 enterprises running multi-plant quality operations, and the highest per-user software spending globally. The U.S. regulatory environment creates a floor of QMS spending that does not exist in most other markets: manufacturers must maintain validated quality systems as a condition of market access, not as an operational choice. That mandatory baseline prevents North American QMS revenue from contracting even when broader enterprise software budgets tighten.
ℹ
To learn more about this report –
Download Your Free Sample Report Here
Asia Pacific is the fastest-growing region across the forecast period, driven by the expansion of contract manufacturing in electronics and pharmaceuticals, growing ISO certification uptake, and government-led industrial quality programs in China and India. Europe holds a substantial revenue position anchored by automotive supply chains in Germany, pharmaceutical manufacturers in the UK and Switzerland, and the Medical Device Regulation (MDR) compliance wave still absorbing investment across the region. Latin America and the Middle East and Africa remain early-stage markets with adoption concentrated in multinational subsidiaries and export-oriented manufacturers subject to customer-mandated quality standards.
United States
The U.S. QMS market is valued at USD 4.1 Billion in 2026 and is forecast to reach USD 10.0 Billion by 2035, growing at a CAGR of 11.03%. That trajectory reflects the density of FDA-regulated manufacturers, the volume of ISO-certified facilities, and a procurement environment where enterprise software budgets for quality and compliance are non-discretionary. U.S. buyers set the global benchmark for per-seat QMS spending and drive the highest volume of multi-module platform deployments among any single country market.
ℹ
To learn more about this report –
Download Your Free Sample Report Here
Regulatory catalysts specific to the U.S. are compressing purchasing timelines. FDA's alignment of 21 CFR Part 820 with ISO 13485, effective February 2026, and the revised Computer Software Assurance guidance issued the same month forced medical device manufacturers to audit and, in many cases, replace existing QMS implementations. Government procurement is also opening: vendors with FedRAMP authorization are accessing a federal buyer pool that was previously closed to non-authorized platforms regardless of their functional depth.
Key Regions and Countries
North America
Europe
- Germany
- France
- The UK
- Spain
- Italy
- Rest of Europe
Asia Pacific
- China
- Japan
- South Korea
- India
- Australia
- Rest of APAC
Latin America
- Brazil
- Mexico
- Rest of Latin America
Middle East & Africa
- GCC
- South Africa
- Rest of MEA
Market Dynamics
Driver: Operational Productivity Gaps Justify eQMS Capital Spending
Manufacturers using EASE's layered process audit platform conducted an average of more than 8,700 audits per year and closed approximately 1,470 findings per site annually, based on an analysis of 2.3 million audits across 2,200-plus manufacturing sites in 2025, as reported by Quality Digest. That volume of quality activity cannot be administered manually without significant labor cost and error risk. The business case for eQMS investment becomes self-evident once quality managers quantify how many staff-hours manual tracking consumes.
Pre-audit preparation commonly takes two to four weeks of dedicated quality staff time per inspection under manual QMS processes, according to CloudTheApp. Electronic platforms compress that window to a matter of days. Buyers who once viewed QMS software as a compliance cost now position it as an operational efficiency investment, a framing that gives vendors access to capital budgets rather than compliance budgets and shortens purchase cycles.
Restraint: Weak Audit Execution Undermines Platform ROI Claims
Audit data exposes a significant credibility problem for QMS vendors selling on compliance outcomes. Only 28% of organizations meet the benchmark of closing more than 60% of audit findings on time, as published by EASE in its 2025 benchmark report. Buyers who deploy QMS platforms but cannot change underlying audit behaviors do not achieve the compliance improvements vendors promise, creating a reputational drag on category sales.
The structural cause is clear. EASE's 2025 benchmark data shows that 84% of frontline Layer 1 audits produced zero findings, an indicator of weak engagement rather than genuinely defect-free operations. QMS software cannot fix cultural resistance to rigorous auditing. Vendors must partner with buyers on change management, not just software deployment, or risk high churn from customers who fail to realize the marketed benefits.
Opportunity: Leadership-Driven Audit Adoption and SMB Market Expansion
Plants where leadership participates consistently in audits are 20% more likely to complete those audits on time than sites without that engagement, as confirmed by EASE's 2025 benchmark data. QMS vendors that build executive dashboards, leadership audit participation tracking, and real-time visibility tools into their platforms are addressing the behavioral driver of audit success, not just the administrative one. That positions them favorably with quality directors who need to demonstrate return on investment upward to the C-suite.
ETQ launched ETQ Reliance Go in December 2025, a self-service SaaS eQMS designed specifically for small and mid-sized manufacturers. The release signals that Tier 1 QMS vendors now view SMB acquisition as a growth priority, not a distraction. Vendors that package pre-configured regulatory templates, fast onboarding, and SMB-compatible pricing will capture the large volume of first-time buyers who cannot afford or justify enterprise-grade implementations.
Market Trends
AI Embedding Transforms QMS from Record-Keeping to Decision Support
eQMS deployments that integrate AI-assisted document control and CAPA tracking show a 60% reduction in audit preparation time, according to data published by eLEAP Software. Cority launched Cortex AI in December 2025, extending AI capabilities across EHS and sustainability management for its enterprise customer base. Vendors embedding AI into core quality workflows are redefining what buyers expect from a platform, and QMS providers that still deliver static checklists without intelligent automation will face accelerating margin pressure from buyers who can compare AI-native alternatives directly in procurement evaluations.
How AI and Generative AI Are Transforming the Quality Management Software Market
AI is moving QMS platforms from passive record systems to active compliance infrastructure. The World Quality Report 2025, published by OpenText, Capgemini, and Sogeti, found that 89% of organizations are now piloting or deploying GenAI-augmented quality workflows, with 37% already in production. Only 15% have achieved enterprise-scale deployment, however, which means the bulk of AI-driven QMS revenue is still ahead rather than already captured. Vendors that reach production-scale AI deployment before competitors will lock in multi-year contracts at the moment buyers commit their compliance architecture to a single platform.
The operational impact is measurable across specific workflows. Computer vision systems on AI-native QMS platforms inspect products at 200-plus parts per minute with accuracy above 99%, closing a detection gap that manual visual checks cannot close; studies cited by Quality Forward note that up to 30% of defects slip through manual visual inspection due to fatigue. Our research shows smart-quality methods can reduce total cost of quality by up to 50% for manufacturers deploying AI across defect detection, CAPA root-cause analysis, and supplier performance monitoring. Generative AI is extending those gains into document-intensive compliance work: platforms now use large language models to pre-review SOPs for regulatory drift, auto-generate evidence packages, and surface non-conformance patterns across multi-site datasets that no human quality team could process manually at comparable speed.
Market Competition Overview
The Quality Management Software market is fragmented at the vendor count level but increasingly concentrated by revenue. A small tier of enterprise QMS platforms, those with global compliance coverage, validated deployment options, and API-based integration ecosystems, capture the majority of large-enterprise contract value. The 2024 ISO Survey (published 2025) recorded 1,474,118 valid ISO 9001:2015 certificates worldwide across more than 2.3 million sites, with 31,215 ISO 13485 certificates in force, as published by the International Organization for Standardization. Each certificate represents at least one active QMS buyer, defining a demand pool that incumbent vendors are defending with multi-module suites designed to raise switching costs.
Competitive displacement is happening at the mid-market level, where newer cloud-native vendors are winning customers away from legacy on-premise platforms. In August 2024, MetricStream was named the only GRC platform leader in the Chartis Research RiskTech AI 50 ranking, a positioning that separates it from pure-play QMS vendors and makes it a natural consolidation candidate. Vendors with validated environments and life sciences specialization maintain pricing power in pharmaceutical and medical device accounts regardless of broader market commoditization.
Company Profiles
MasterControl has built its competitive advantage on the depth of its life sciences compliance coverage, integrating quality, manufacturing, and regulatory functions within a single validated platform. In March 2025, MasterControl acquired Qualer, a cloud-native CMMS and calibration management company, adding asset management to its suite and addressing a gap that previously pushed life sciences buyers toward separate point solutions. By September 2025, MasterControl surpassed $200 million in annual recurring revenue, crediting AI-powered quality and manufacturing products for the milestone. The company's AI roadmap, including the Regulatory Chat tool and SOP Analyzer, indicates it is repositioning from a compliance documentation system to an active decision-support layer for regulated manufacturers. Based on 553 verified reviews collected by G2 as of September 2025, Qualio's QMS platform received a customer satisfaction score of 100 with an 88% recommend rate, while QT9 QMS achieved a 97% recommend rate across 103 reviews, the highest among nine platforms G2 compared.
In May 2026, ETQ became part of Octave, an independent public company formed after separating from Hexagon alongside several other divisions including Asset Lifecycle Intelligence and Geospatial. That structural change gives ETQ more autonomy in capital allocation and go-to-market decisions. Veeva Systems maintains a different strategic positioning: its Vault ecosystem locks life sciences customers into a connected suite of regulatory, clinical, and quality applications that treat QMS not as a standalone product but as one layer in a broader R&D compliance architecture. In June 2025, Veeva showed Veeva LIMS and Batch Release becoming available to European customers, with Validation Management reducing validation effort by up to 50% for early adopters, extending its addressable market beyond its North American base.
Key Players
- Hexagon (ETQ)
- Veeva Systems
- Siemens
- Honeywell
- PTC
- SAP
- Oracle
- QAD
- iso Tracker Solutions
- Effivity Technologies
- Microsoft Corporation
- Arena Solutions, Inc.
- Ideagen Plc.
- MasterControl, Inc.
- MetricStream, Inc.
- Pilgrim Quality Solution
- Plex Systems, Inc.
- Sparta Systems Inc.
- QT9 QMS
- Aras Innovator
- Intellect
- AssurX
- Propel
- Caliber Technologies
- EASE.io
- Qualityze
- Scilife
- Intelex Technologies
- Momentum Systems
- AlisQI
- TraceGains
- ComplianceQuest
- Cority (Canada)
- SoftExpert
- Greenlight Guru
- Fabasoft
- AmpleLogic
- Ennov
- Qualio
- ZenQMS
- Omnex
Regulatory Landscape
FDA issued its final "Computer Software Assurance for Production and Quality System Software" guidance on September 24, 2025, then superseded it with a revised final version on February 3, 2026, producing two major regulatory updates to software-validation expectations for quality systems in under five months. FDA's amended 21 CFR Part 820, which aligns the U.S. Quality System Regulation with ISO 13485, took effect February 2, 2026, changing the compliance baseline that QMS software in medical devices must meet. QMS vendors serving medical device manufacturers faced a product update and revalidation cycle of unusual speed, creating short-term cost pressure but long-term demand for platforms with built-in regulatory change management.
FDA oversees approximately 200,000 marketed medical devices and oversaw the voluntary recall of 3,934 of those devices between fiscal years 2020 and 2024, according to the Government Accountability Office. FDA's own recall tracking confirms 111 medical device recalls and early alerts in 2025, and an FDA official reported that Class I (most serious) recalls rose 232% between 2020 and 2025, as cited by RAPS. A recall rate of that severity compels boards and quality directors to treat QMS investment as a risk-mitigation imperative rather than a regulatory formality.
Investment and White Space Analysis
Life sciences QMS represents the highest-value white space available to platform vendors in the near term. A modeled projection for a mid-sized life sciences company with 20 quality staff, 200 controlled documents, and 150 CAPAs per year shows $400,000 to $800,000 in three-year cost avoidance against a $150,000 to $300,000 eQMS investment, as reported by CloudTheApp. Returns of that magnitude are compelling to CFOs in an industry segment already accustomed to large-scale validated system investments.
The SMB segment across manufacturing and food and beverage verticals is the largest volume opportunity. Government and defense buyers represent a structurally gated but high-contract-value opportunity: vendors achieving FedRAMP authorization unlock procurement pipelines that are effectively closed to non-authorized platforms, regardless of functional capability. Asia Pacific mid-market manufacturers, particularly in India and Southeast Asia, present high-growth potential with currently low QMS penetration relative to their certification ambitions.
Recent Developments
- October 2024 — Ideagen joined the FedRAMP Marketplace to support U.S. federal agency procurement.
- June 2025 — Ideagen acquired ConvergePoint, its second acquisition of 2025 and twelfth since 2023, strengthening its compliance and policy-management capabilities.
- August 2025 — Ideagen acquired Reactec, a wearable-tech and cloud-analytics safety company, expanding its EHS portfolio.
- October 2025 — Ideagen acquired SafetyStratus, adding specialized chemical management to its EHSQ suite.
- January 2025 — Cority acquired Meddbase, a cloud-native occupational health and enterprise medical practice management software provider.
- February 2026 — Cority partnered with Carahsoft to bring its FedRAMP-authorized EHS platform to U.S. government agencies.
- March 2024 — ETQ expanded real-time document collaboration and broader data collection in ETQ Reliance NXG.
- February 2026 — ETQ announced Form Field Advisor and Complaint & Feedback Advisor as new native AI capabilities within its Reliance AI strategy.
- March 2024 — Qualio introduced a new Document Management approach with OneDrive integration.
- October 2025 — Qualio launched Compliance Intelligence, an AI-powered addition to its Life Sciences GRC and quality platform.
- Through 2025 — MetricStream rolled out an AI-first GRC strategy across risk, compliance, audit, and quality-adjacent product lines.
- April 2026 — MetricStream released a platform update including a Model Gateway and LLM Configuration feature, letting organizations connect internal or third-party large language models through a centralized AI gateway.
- April 2025 — Veeva introduced free SiteVault CTMS with connected eConsent and eISF, extending its Vault ecosystem to the site level.
Report Scope
| Report Characteristics |
| Market Value (2026) |
USD 13.90 Billion |
| Forecast Revenue (2035) |
USD 39.20 Billion |
| CAGR (2026 to 2035) |
11.8% |
| Base Year for Estimation |
2025 |
| Historic Period |
2020 to 2024 |
| Forecast Period |
2026 to 2035 |
| Report Coverage |
Revenue Forecast, Market Dynamics, Competitive Landscape, Recent Developments |
| Segments Covered |
By Component, By Deployment, By Enterprise Size, By Solution, By End Use |
| Regional Analysis |
North America, Europe, Asia Pacific, Latin America, Middle East & Africa |
| Competitive Landscape |
Hexagon (ETQ), Veeva Systems, Siemens, Honeywell, PTC, SAP, Oracle, QAD, iso Tracker Solutions, Effivity Technologies, Microsoft Corporation, Arena Solutions Inc., Ideagen Plc., MasterControl Inc., MetricStream Inc., Pilgrim Quality Solution, Plex Systems Inc., Sparta Systems Inc., QT9 QMS, Aras Innovator, Intellect, AssurX, Propel, Caliber Technologies, EASE.io, Qualityze, Scilife, Intelex Technologies, Momentum Systems, AlisQI, TraceGains, ComplianceQuest, Cority, SoftExpert, Greenlight Guru, Fabasoft, AmpleLogic, Ennov, Qualio, ZenQMS, Omnex |
Frequently Asked Questions
What is the size of the Quality Management Software Market?
▾ Quality Management Software Market size is valued at around USD 13.90 billion in 2026 and is forecast to reach $39.20 billion by 2035.
What is the growth rate of the Quality Management Software Market during?
▾ Quality Management Software Market is expected to grow at a CAGR of 11.8% during the forecast period 2026 to 2035.
Which region holds the largest share of the global Quality Management Software Market?
▾ Currently, North America is leading the Global Quality Management Software Market with a 42.3% share in 2026.
What factors are driving the growth of the Quality Management Software Market?
▾ The growth of the Quality Management Software Market is driven by increasing regulatory compliance needs, digital transformation, automation of quality processes, cloud adoption, and demand for AI powered quality solutions.
What are the major challenges in the Quality Management Software Market?
▾ Major challenges hindering the Quality Management Software Market include high implementation costs, integration complexities, data security concerns, and difficulties in shifting from traditional quality management methods.
Which segment holds the largest share of the Quality Management Software Market?
▾ The Software segment holds the largest share of the Quality Management Software Market, accounting for 65.3% share in 2026.
Who are the leading companies in the Quality Management Software Market?
▾ Hexagon (ETQ), Veeva Systems, Siemens, SAP, Oracle, MasterControl, MetricStream, Ideagen, and other key players are leading companies in the Quality Management Software Market.
How is AI influencing the Quality Management Software (QMS) Market?
▾ AI is transforming the QMS market through predictive analytics, automated compliance monitoring, intelligent document control, defect detection, and faster quality decision-making.
What are the future opportunities and trends in the Quality Management Software Market?
▾ Future opportunities in the Quality Management Software Market include AI-enabled QMS platforms, cloud-based solutions, SME adoption, real-time quality analytics, ERP integration, and increasing demand across regulated industries.