Market Overview
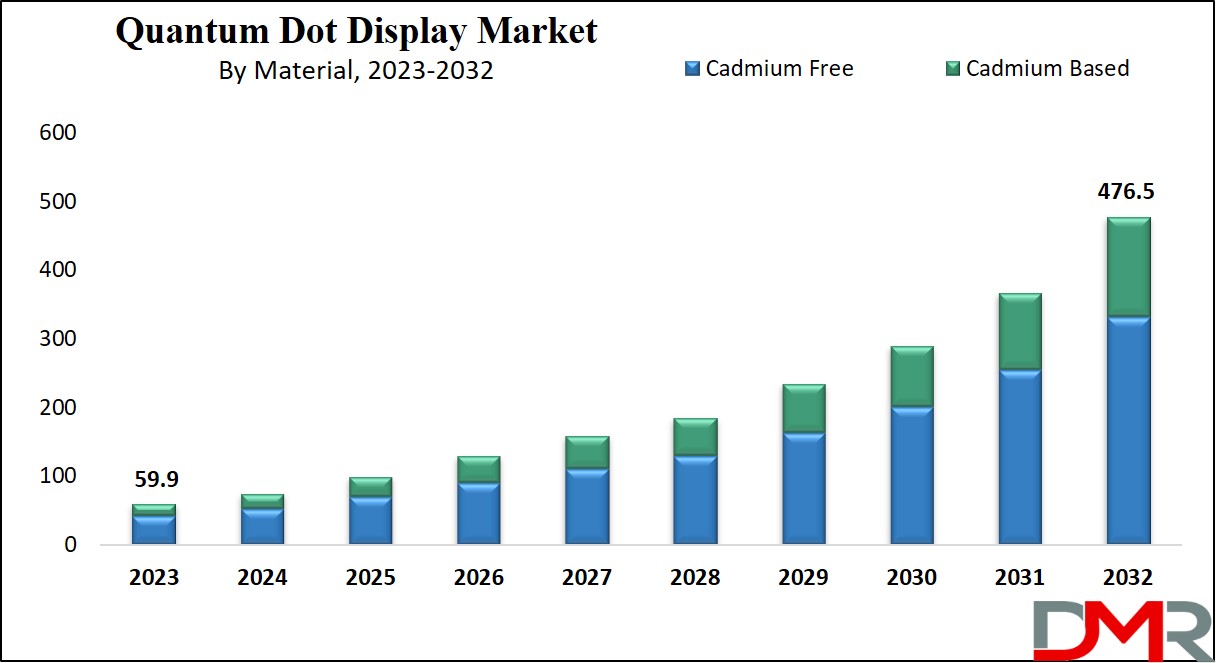
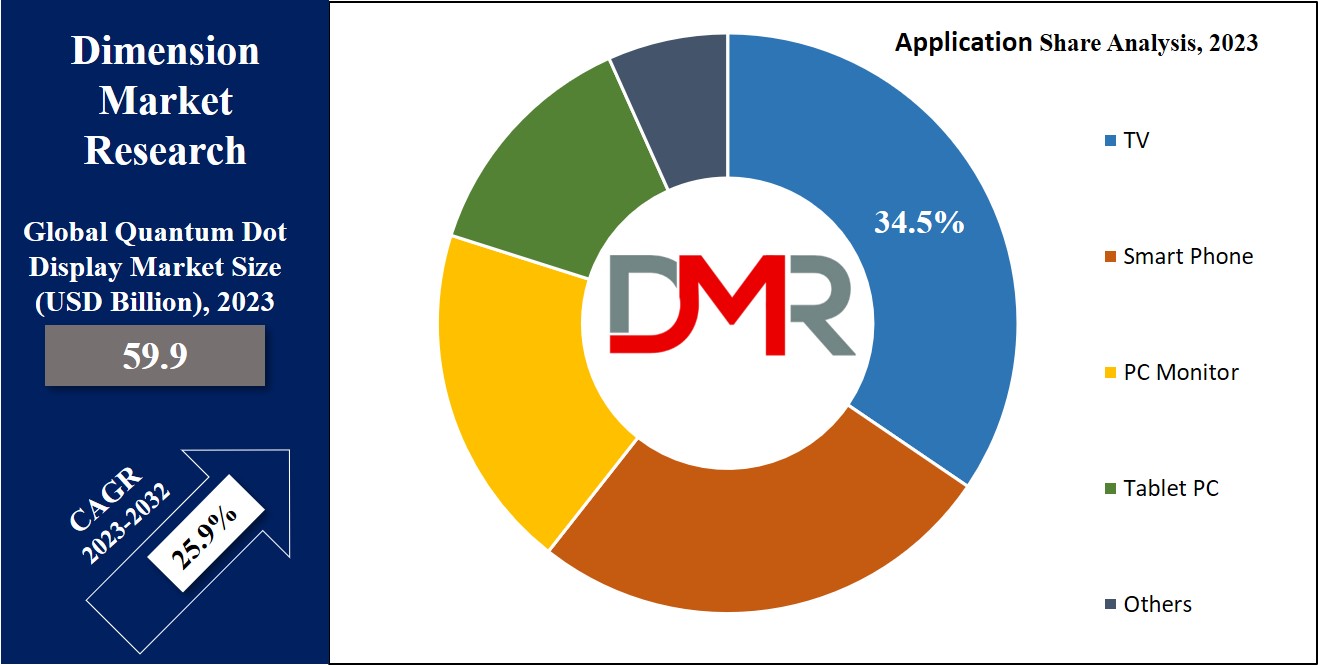
The Global Quantum Dot Display Market is expected to reach a value of USD 59.9 billion in 2023, and it is further anticipated to reach a market value of USD 476.5 billion by 2032 at a CAGR of 25.9%. The market has seen significant growth over the past few years and is predicted to grow significantly during the forecasted period as well.
Display quantum dots are broadly used in different devices, including smartphones, PCs, tablets, & TVs, as they offer benefits like increased energy efficiency and enhanced brightness, & are in high demand for bigger, high-resolution displays &
microdisplays. Furthermore, quantum dots find significant applications in LED lighting, contributing to their broad adoption in the market.
Key Takeaways
- Market Growth: The global quantum dot display market is projected to rise from USD 59.9 billion in 2023 to USD 476.5 billion by 2032, reflecting a CAGR of 25.9%.
- Material Shift: Cadmium-free quantum dots dominated in 2023 due to cost savings and eco-friendliness, and are expected to lead through the forecast period.
- Key Segment: Televisions represent a major application, with quantum dots enhancing color and picture quality, driving increased adoption in premium TV models.
- Regional Leader: North America holds the largest revenue share at 41.2% in 2023, with the United States leading due to high QLED adoption and advanced technology providers.
- Diverse Applications: Quantum dot displays are widely used in consumer electronics, automotive displays, medical imaging, and digital signage, offering superior visuals and energy efficiency.
- Growth Drivers: Expanding LED technology adoption, larger high-resolution screens, and ongoing technological advances are fueling market opportunities and innovation.
- Competitive Activity: Industry players pursue growth by expanding operations, launching new products, and forming partnerships, as seen in recent funding rounds and technology collaborations.
Use Cases
- Consumer Electronics: Quantum dot technology enhances the color accuracy and brightness of televisions, monitors, and smartphones, providing superior display quality with lower power consumption.
- Television & Home Entertainment: Quantum dots improve the visual experience in OLED and LED TVs by delivering more vivid colors, deeper blacks, and higher contrast ratios, making them ideal for high-end home entertainment systems.
- Automotive Displays: Quantum dot displays are used in automotive dashboards and infotainment systems, offering high brightness, sharp visuals, and energy efficiency, improving driver and passenger experiences.
- Medical Imaging: Quantum dots are used in medical imaging devices like endoscopes and diagnostic tools, providing high-resolution imaging with precise color differentiation for better diagnosis and treatment planning.
- Advertising and Digital Signage: Quantum dot displays are employed in large-format digital signage and outdoor advertising, offering bright, clear visuals with vibrant colors that stand out in diverse lighting conditions.
Market Dynamic
The growing use of LED technology across the globe is anticipated to expand, encouraging opportunities for the display quantum dots market and driving its future expansion. Furthermore, the broad adoption of quantum dots in LED lighting & the rising demand for larger, high-resolution displays are anticipated to create substantial growth avenues in this market.
Additionally, ongoing technological advancements in different sectors, including consumer electronics, healthcare, automotive, IT, & telecommunications, are poised to deliver various growth opportunities within the display quantum dots market.
The display quantum dots market may face challenges in the future due to two main factors: the scarcity of rare-earth materials and the negative effects of declining prices for traditional OLED and LED/LCDs on quantum dot displays. These factors are expected to present obstacles to the market's growth in the forecasted period.
Research Scope and Analysis
By Material
In terms of material analysis, there are two different segments, cadmium-based & cadmium-free quantum dots. Among these, cadmium-free quantum dots lead the market in 2023 and are anticipated to hold their position throughout the forecasted period, as they offer several advantages like cost-effectiveness, high precision, reduced toxicity risks, enhanced efficiency, improved safety, eco-friendliness, lower energy consumption, & lowest maintenance costs.
Cadmium-free quantum dots provide a secure & environmentally friendly solution for both manufacturers & consumers, providing the color benefits of this technology without the associated toxicity concerns or stringent regulatory limitations.
By Application
Televisions are a prominent segment in the Global Quantum Dot Display Market in 2023. Quantum dot technology has revolutionized TV displays by improving color vibrancy & overall picture quality. With consumers looking for more immersive & vibrant viewing experiences, the need for quantum dot TVs has been steadily increasing.
The high adoption of Quantum Dot LED (QLED) displays in premium television models is a major driving factor. These displays offer an extensive color range & enhanced energy efficiency. Additionally, major TV manufacturers have invested in quantum dot technology, which further drives the growth of the market
The Global Quantum Dot Display Market Report is segmented based on the following:
By Material
- Cadmium Based
- Cadmium Free
By Application
- Smartphone
- TV
- PC Monitor
- Tablet PC
- Others
Regional Analysis
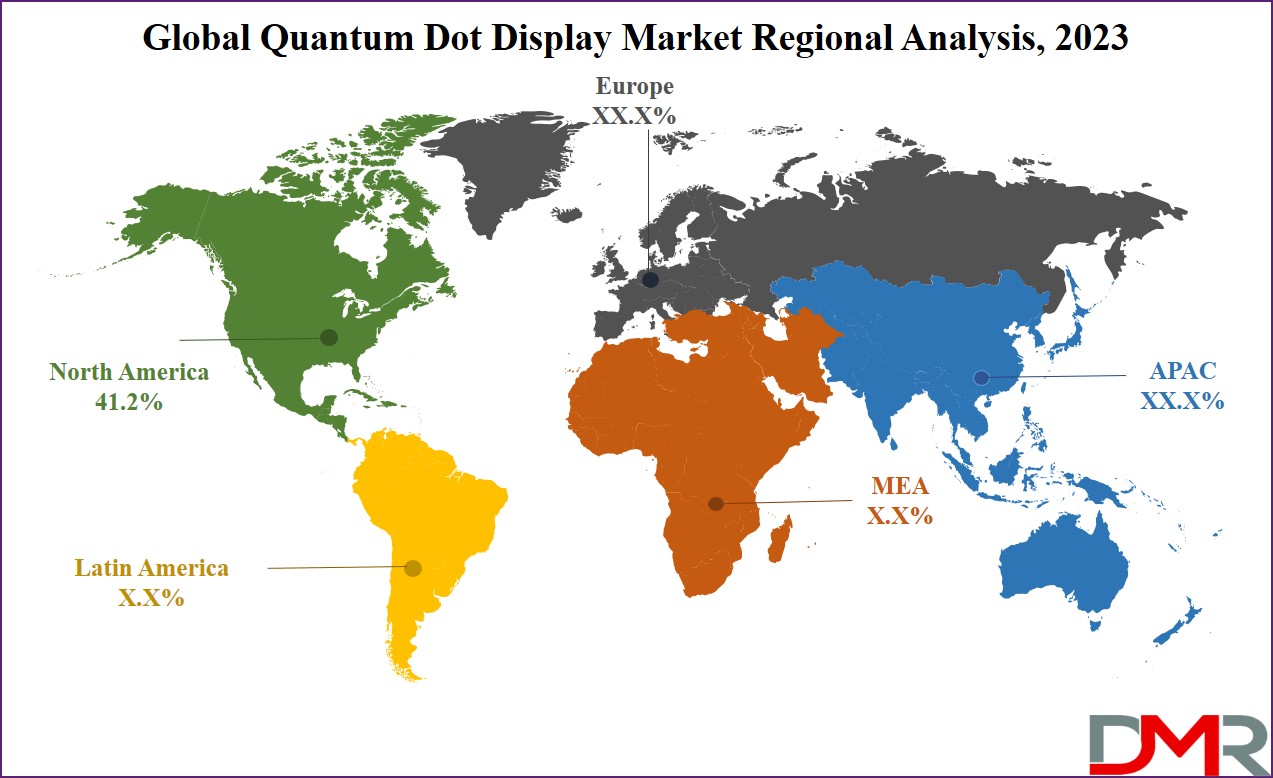
North America leads
the global quantum dot display market with 41.2% of the total market revenue in 2023, and this trend is expected to continue throughout the forecast period. The region's market growth is driven by the growing demand for QLED displays & the rapid adoption of quantum dot technology. The United States, in particular, holds the largest market share in North America, mainly owing to the extensive use of QLED displays & the presence of various technology providers.
Additionally, the market benefits from substantial investments in research & development, due to ongoing technological developments & increased funding in the electronics sector within the region.
Further, Europe is anticipated to significant growth in the quantum dot display market in the coming years, which is attributed to the presence of major industry players & the widespread adoption of quantum dot LED, display, & LCD technology in a variety of consumer electronics, including PC monitors, smartphones, tablets, a& d televisions, all contributing to the development of quantum dot display industry in Europe.
By Region
North America
Europe
- Germany
- The U.K.
- France
- Italy
- Russia
- Spain
- Benelux
- Nordic
- Rest of Europe
Asia-Pacific
- China
- Japan
- South Korea
- India
- ANZ
- ASEAN
- Rest of Asia-Pacific
Latin America
- Brazil
- Mexico
- Argentina
- Colombia
- Rest of Latin America
Middle East & Africa
- Saudi Arabia
- UAE
- South Africa
- Israel
- Egypt
- Rest of MEA
Competitive Landscape
The quantum dots display market experiences a significant level of fragmentation, where numerous companies operate. Key players in this industry have included different strategies to enhance their presence. These strategies include expanding their operations, introducing new products, forming alliances, securing partnerships, & making acquisitions. By doing so, these companies focus on increasing their reach & strengthening their positions in the competitive quantum dots market, encouraging growth & innovation in the industry
For instance, in February 2022, Nnaosys & Smartkem announced a collaboration on developing a next-generation, affordable solution for printed microLED & quantum dot materials to advance display technology. This partnership focuses on merging Smartkem's high-end organic semiconductor formulations for solution-printed displays with Nanosys's expertise in microLED & quantum dot nano-LED technologies, to create energy-efficient, durable, & lightweight displays.
Some of the prominent players in the Global Quantum Dot Display Market are:
- Sony Corp
- LG Display
- 3M Company
- Samsung
- QD Vision
- Microvision Inc
- Quantum Material Corp
- Sharp Corp
- TCL Corp
- Nanosys Inc
- Other Key Players
Recent Development
- In April 2025, UbiQD secured $20 million in Series B funding to expand its quantum dot technology, with a focus on scaling production and broadening its applications across various industries, including healthcare, energy, and display technologies.
- In April 2024, NanoPattern closed a $1.5 million seed round to enhance its capabilities in quantum dot ink production, aiming to address the growing demand for high-performance materials in various display and photovoltaic applications.
- In December 2024, QustomDot secured €5 million in funding to accelerate the development of its quantum dot solutions, with a specific focus on advancing micro LED display technologies for enhanced visual performance.
Report Details
| Report Characteristics |
| Market Size (2023) |
USD 59.9 Bn |
| Forecast Value (2032) |
USD 476.5 Bn |
| CAGR (2023–2032) |
25.9% |
| Historical Data |
2017 – 2022 |
| Forecast Data |
2023 – 2032 |
| Base Year |
2022 |
| Estimate Year |
2023 |
| Report Coverage |
Market Revenue Estimation, Market Dynamics, Competitive Landscape, Growth Factors and etc. |
| Segments Covered |
By Material (Cadmium Based and Cadmium Free), By Application (Smartphone, TV, PC Monitor, Tablet PC, and Others) |
| Regional Coverage |
North America – The US and Canada; Europe – Germany, The UK, France, Russia, Spain, Italy, Benelux, Nordic, & Rest of Europe; Asia-Pacific – China, Japan, South Korea, India, ANZ, ASEAN, Rest of APAC; Latin America – Brazil, Mexico, Argentina, Colombia, Rest of Latin America; Middle East & Africa – Saudi Arabia, UAE, South Africa, Turkey, Egypt, Israel, & Rest of MEA |
| Prominent Players |
Sony Corp, LG Display, 3M Company, Samsung, QD Vision, Microvision Inc, Quantum Material Corp, Sharp Corp, TCL Corp, Nanosys Inc, and Other Key Players |
| Purchase Options |
We have three licenses to opt for: Single User License (Limited to 1 user), Multi-User License (Up to 5 Users), and Corporate Use License (Unlimited User) along with free report customization equivalent to 0 analyst working days, 3 analysts working days, and 5 analysts working days respectively. |
Frequently Asked Questions
The Global Quantum Dot Display Market size is estimated to have a value of USD 59.9 billion in 2023 and
is expected to reach USD 476.5 billion by the end of 2032.
North America dominates the Global Quantum Dot Display Market with a share of 41.2% in 2023.
Some of the key players in the Global Quantum Dot Display Market are Sony Corp, 3M Company, LG
Display, and many others.
The market is growing at a CAGR of 25.9 percent over the forecasted period.