Market Overview
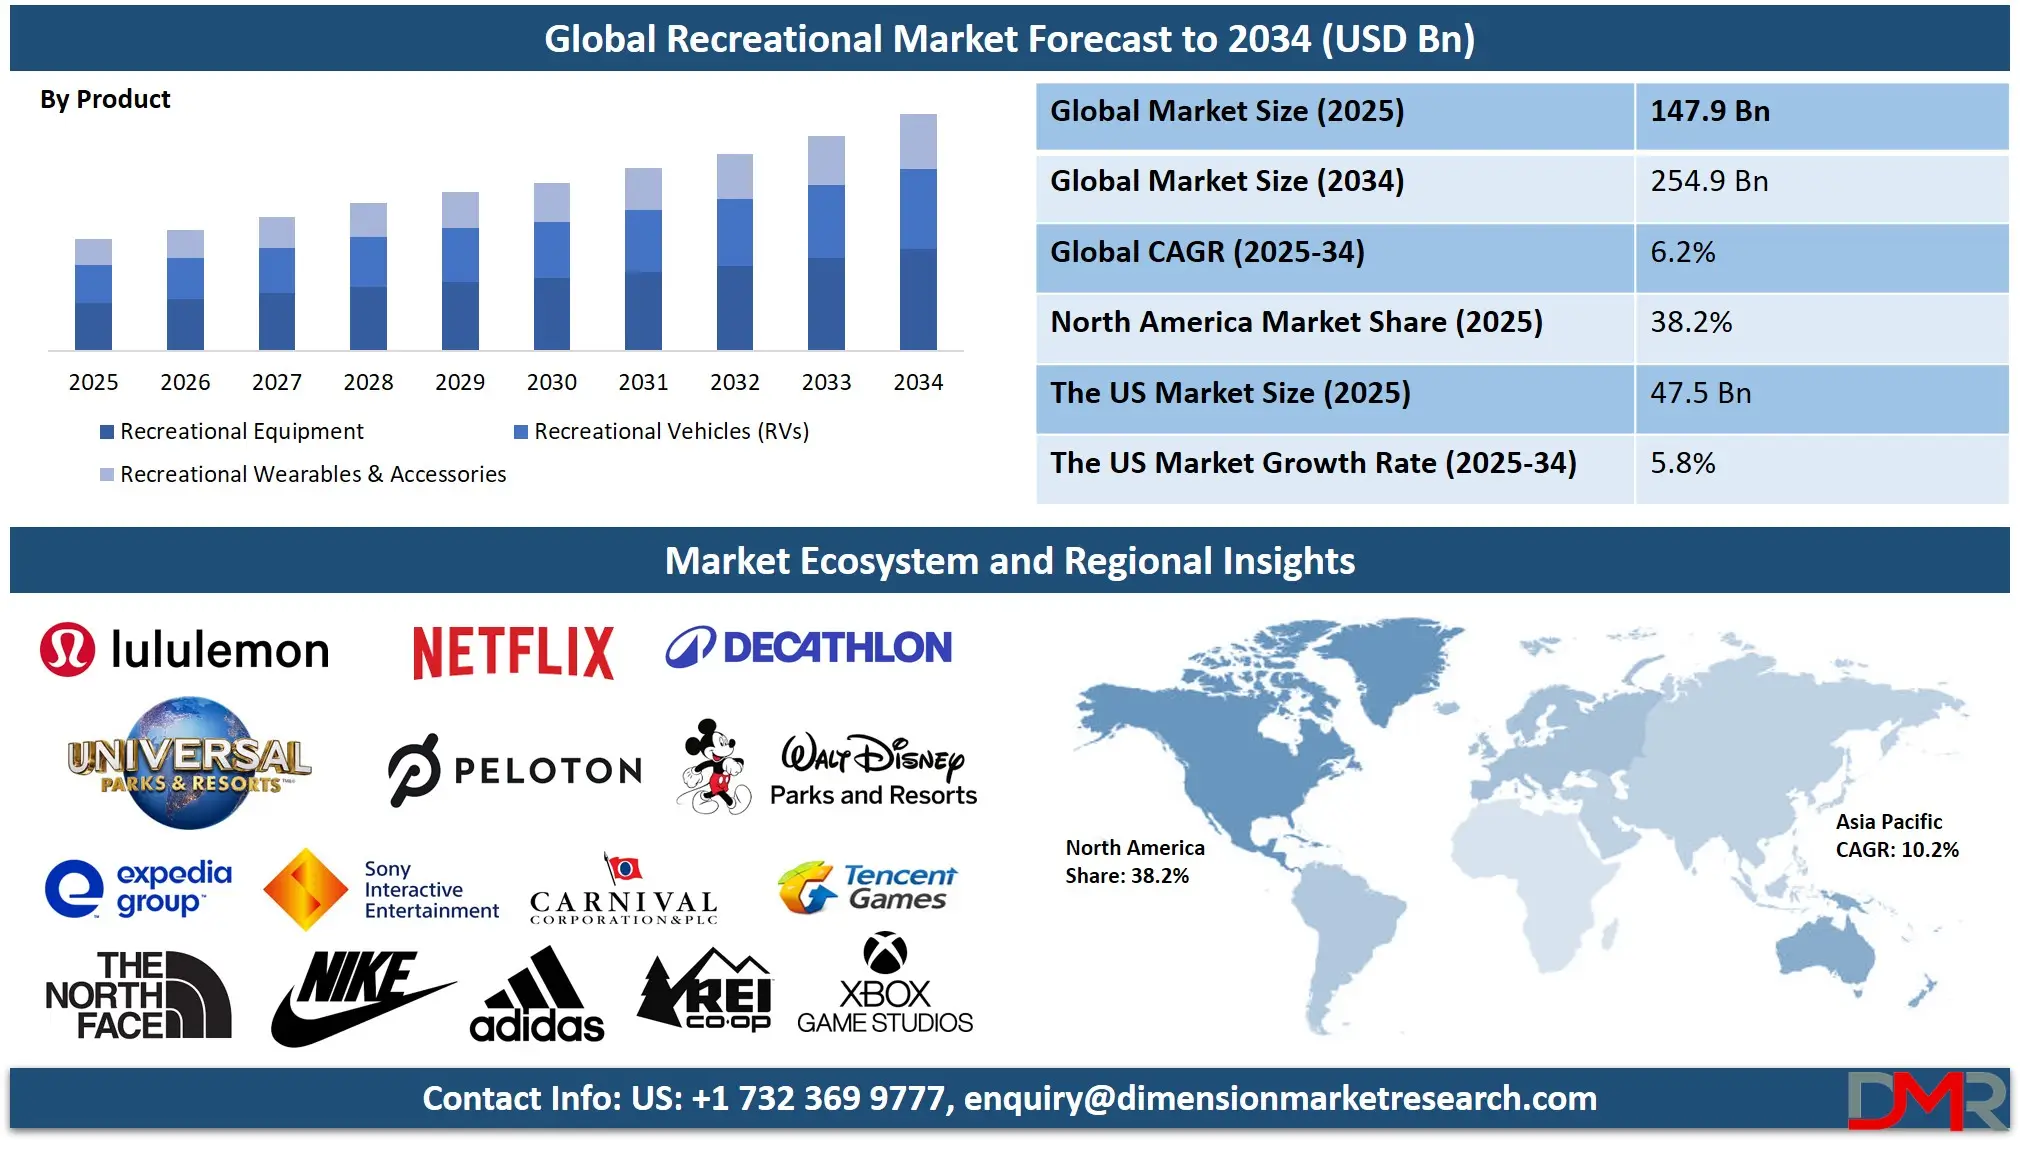
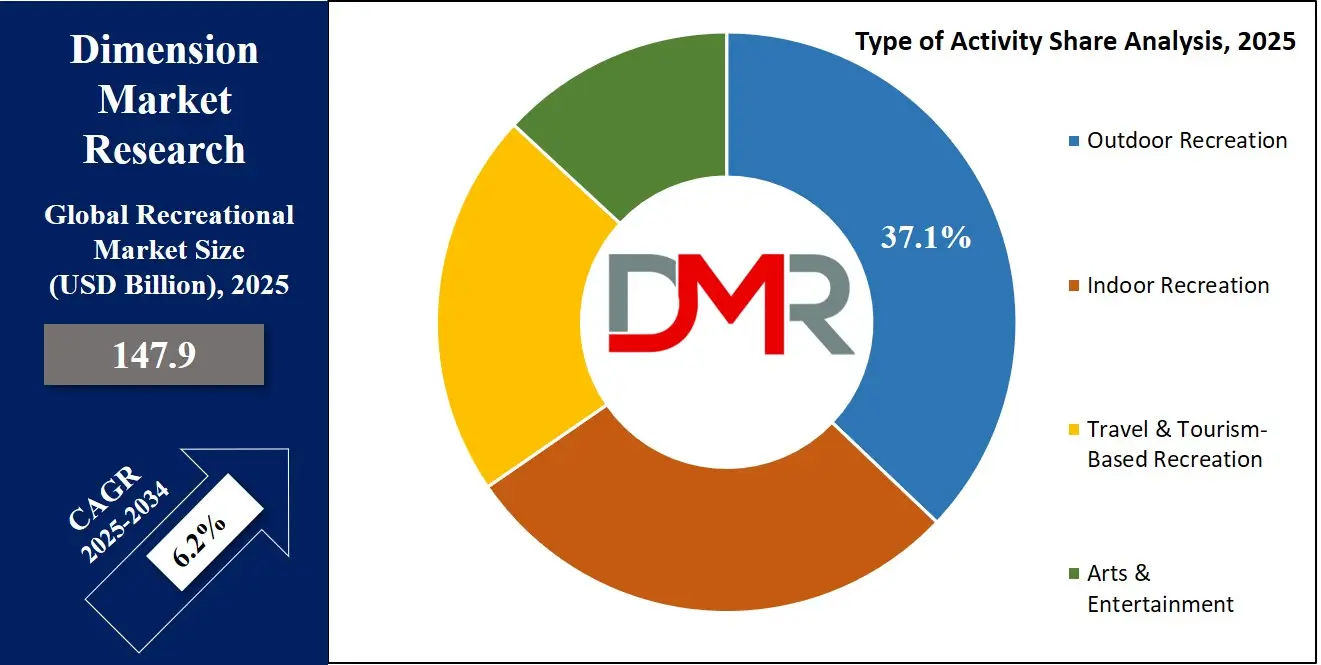
The Global Recreational Market is projected to reach USD 147.9 billion in 2025 and grow at a compound annual growth rate of 6.2% from there until 2034 to reach a value of USD 254.9 billion.
The global recreational market is experiencing sustained growth, driven by rising consumer demand for wellness, adventure, and experience-based activities. The market reflects effects of the increasing disposable income, urbanization, and awareness of mental and physical health benefits associated with recreational engagement. The boom in eco-tourism, digital gaming, and outdoor fitness trends such as hiking and kayaking signals a consumer shift toward active and immersive recreational experiences.
ℹ
To learn more about this report –
Download Your Free Sample Report Here
Technological innovations are fueling growth through VR-based indoor gaming, smart wearables for fitness, and mobile platforms that enhance accessibility and personalization in recreation. The expansion of
recreational vehicle (RV) tourism and increased participation in sustainable travel are prominent trends, especially among Millennials and Gen Z, who value experience over material ownership. Moreover, the expansion of wellness tourism and community-based adventure travel continues to attract interest across regions.
However, restraints include seasonal dependency in certain outdoor recreation sectors, accessibility gaps in developing economies, and environmental concerns stemming from over-tourism and recreational pollution. Regulatory restrictions and land-use conflicts in national parks and heritage zones can also limit new recreational infrastructure projects.
Opportunities lie in developing inclusive recreation programs, adaptive equipment for people with disabilities, and expanding virtual recreation platforms. Moreover, integrating AI and data analytics into customer behavior mapping can further personalize offerings, boosting user retention and revenue. Investment in local community-based recreational programs and infrastructure revitalization projects opens scalable growth potential for governments and private players alike.
The market is characterized by diversity across segments, ranging from traditional sports and arts-based leisure to emerging categories such as e-sports, fitness apps, and virtual tourism. The evolution of consumer behavior from passive to participative and interactive recreation underscores a long-term global shift that favors experiential consumption and sustainable practices in the recreational ecosystem.

ℹ
To learn more about this report –
Download Your Free Sample Report Here
The US Recreational Market
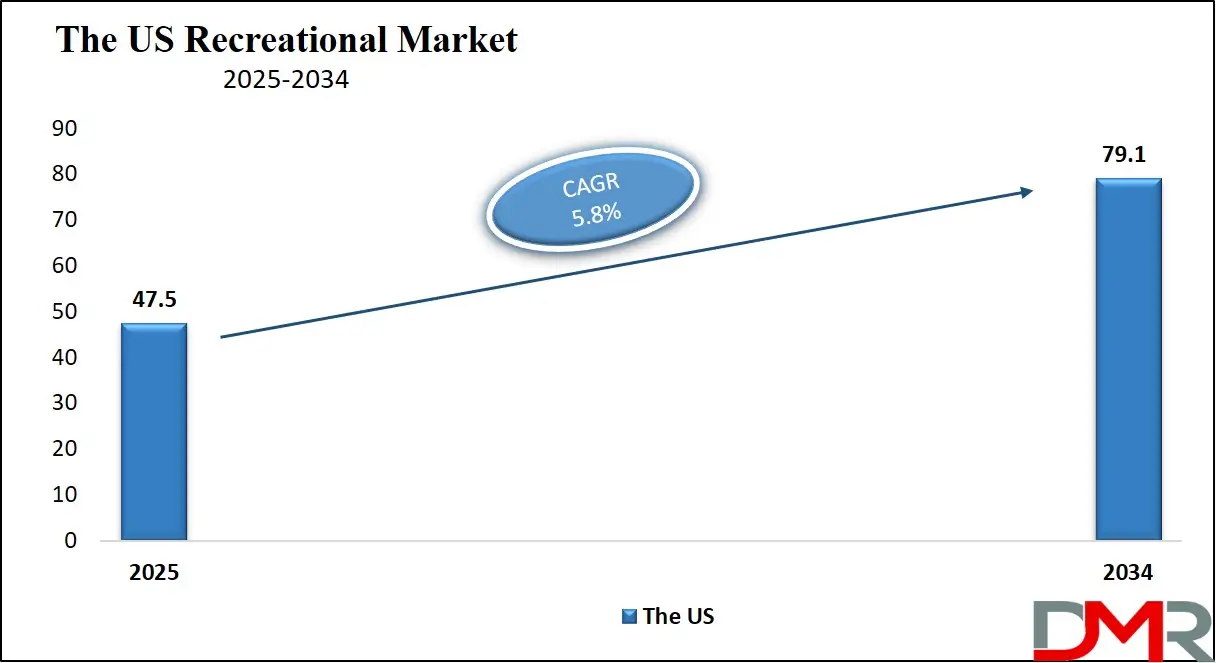
The US Recreational Market is projected to reach USD 47.5 billion in 2025 at a compound annual growth rate of 5.8% over its forecast period.
The U.S. recreational market is one of the most mature and dynamic globally, benefiting from high consumer spending, expansive public lands, and a cultural emphasis on outdoor and leisure activities. According to the U.S. Bureau of Economic Analysis (BEA), the outdoor recreation economy accounted for over 1.9% of GDP and supported more than 4.5 million jobs as of recent reporting. The National Park Service (NPS) recorded over 325 million recreational visits in 2023, underscoring a robust culture of public engagement with natural resources.
The U.S. Census Bureau notes that nearly 80% of Americans live in urban areas, prompting cities to invest in parks, greenways, and indoor recreational centers. Federal agencies such as the U.S. Forest Service and state-level bodies manage expansive recreational spaces, ensuring access to forests, lakes, and wildlife preserves. In addition, programs from the Department of Health and Human Services (HHS) promote physical activity through grants to local recreation programs.
The demographic advantage lies in a highly diversified population with strong participation across all age groups. Initiatives like the “Every Kid Outdoors” program by the U.S. Department of the Interior demonstrate the government’s commitment to youth engagement in recreation. Meanwhile, the older population is increasingly turning to wellness tourism, walking trails, and fitness programs, supported by Medicare-related wellness incentives.
Moreover, the digital entertainment segment led by Xbox (Microsoft) and PlayStation (Sony) has seen rapid growth, particularly among Gen Z and Millennials. This evolution toward hybrid indoor-outdoor recreational engagement reflects a U.S. market that is not only sizable but also constantly evolving with changing lifestyles and technological adoption.
ℹ
To learn more about this report –
Download Your Free Sample Report Here
The Europe Recreational Market
The Europe Recreational Market is estimated to be valued at USD 22.1 billion in 2025 and is further anticipated to reach USD 37.4 billion by 2034 at a CAGR of 6.0%.
Europe’s recreational market is built on a strong foundation of cultural heritage, environmental diversity, and robust public infrastructure supporting both indoor and outdoor recreation. According to Eurostat, over 60% of Europeans engage in physical activities or cultural participation at least once per month. Public recreational infrastructure, including over 90,000 public libraries and 130,000 sports clubs across the EU, supports an active population that values wellness, education, and artistic experiences.
The European Commission’s HealthyLifestyle4All initiative and the European Week of Sport are promoting physical activity as a public health priority. Public funding for creative arts, fitness centers, and urban recreation zones ensures access to diverse experiences, from alpine skiing in the Alps to kayaking in the Baltic Sea and museum visits in Italy and France. Countries such as Germany and the Netherlands have extensive cycling infrastructure, which not only supports sustainable recreation but also contributes to public health and environmental goals.
Demographically, Europe has an aging population that is increasingly investing in wellness-focused recreational activities. Retirement programs and healthcare systems in countries like Sweden and France encourage engagement in walking clubs, aqua therapy, and guided cultural tours. Simultaneously, younger generations are leading in digital recreation trends, such as virtual gaming, escape rooms, and sports tech integration.
Tourism is deeply intertwined with recreation in Europe, supported by efficient cross-border transport and cultural heritage sites. Regional diversity from Mediterranean beach leisure to Scandinavian winter sports makes Europe a unique and resilient recreational market poised for both stability and digital expansion.
The Japan Recreational Market
The Japan Recreational Market is projected to be valued at USD 8.8 billion in 2025. It is further expected to witness subsequent growth in the upcoming period, holding USD 15.7 billion in 2034 at a CAGR of 6.6%.
Japan’s recreational market is a blend of traditional practices and modern digital innovations, driven by demographic shifts and deep-rooted cultural appreciation for leisure. According to Japan’s Ministry of Land, Infrastructure, Transport and Tourism (MLIT), domestic leisure travel remained strong with over 500 million domestic trips in 2023. Parks, gardens, hot springs (onsen), and nature-based destinations are integral to Japanese recreational behavior.
Japan's Ministry of Health, Labour and Welfare promotes physical fitness and mental health through public recreational programs tailored to its aging society. Local governments provide subsidized access to public gyms, community centers, and wellness classes for seniors, with initiatives such as Health Japan 21 supporting healthy lifestyles. The Japan Sports Agency also funds youth athletic development and community engagement through school-based recreational activities.
Urban recreation is highly developed in Japan’s major cities, with Tokyo and Osaka hosting a high density of arcades, theme parks (such as Universal Studios Japan), karaoke lounges, and escape rooms. Meanwhile, rural Japan offers nature-rich experiences like hiking, forest bathing (shinrin-yoku), and agricultural tourism, which are gaining popularity among eco-conscious travelers and younger residents seeking alternatives to urban stress.
Digitally, Japan is a leader in e-sports, VR entertainment, and gaming leisure through major players like Sony and Nintendo. Recreational behavior in Japan reflects a balance between mindfulness (e.g., tea ceremonies, calligraphy) and modern play (e.g., gaming cafes, fitness apps), making the market adaptable and resilient.
With a shrinking yet health-conscious population and technological innovation at the core, Japan’s recreational sector holds strong potential for immersive, inclusive, and wellness-based recreational formats.
Global Recreational Market: Key Takeaways
- Global Market Size Insights: The Global Recreational Market size is estimated to have a value of USD 147.9 billion in 2025 and is expected to reach USD 254.9 billion by the end of 2034.
- The Global Market Growth Rate: The market is growing at a CAGR of 6.2 percent over the forecasted period of 2025.
- The US Market Size Insights: The US Recreational Market is projected to be valued at USD 47.5 billion in 2025. It is expected to witness subsequent growth in the upcoming period as it holds USD 79.1 billion in 2034 at a CAGR of 5.8%.
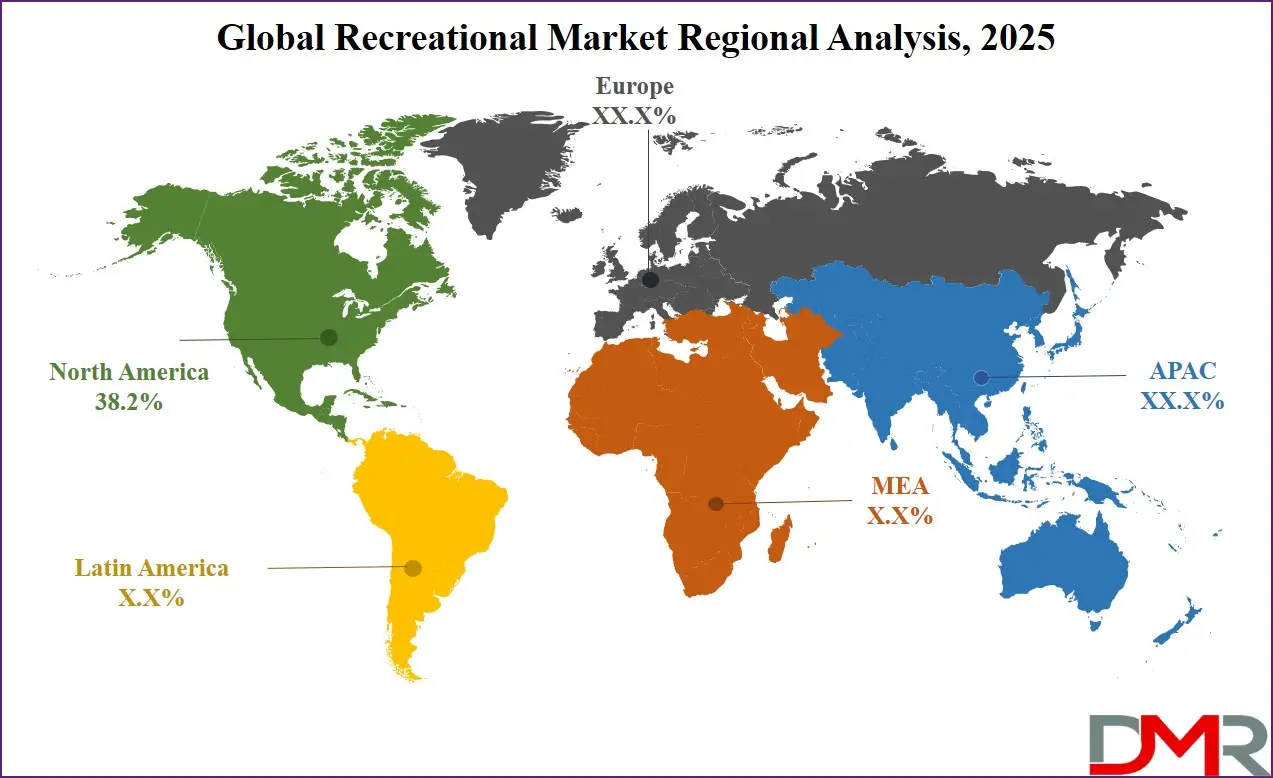
- Regional Insights: North America is expected to have the largest market share in the Global Recreational Market with a share of about 38.2% in 2025.
- Key Players: Some of the major key players in the Global Recreational Market are The North Face, Patagonia, REI Co-op, Black Diamond Equipment, Disney Parks & Experiences, Universal Parks & Resorts, Carnival Corporation, and many others.
Global Recreational Market: Use Cases
- Urban Wellness Parks: Cities like Singapore and New York are transforming unused urban spaces into wellness parks with meditation zones, walking paths, and open gyms to promote public health and social interaction through recreational infrastructure.
- RV Tourism Growth: North America sees rising demand for RV rentals as travelers seek off-grid and flexible recreation. Platforms offering peer-to-peer RV sharing contribute to sustainable travel and micro-tourism.
- Immersive Digital Gaming: VR arcades and multiplayer platforms are redefining indoor recreation by offering hyper-immersive gaming experiences. Brands like Oculus and Sony capitalize on demand from tech-savvy Millennials and Gen Z.
- Adventure-Based Team Building: Corporate teams globally now engage in adventure sports like rock climbing, whitewater rafting, and zip-lining as part of employee wellness and team bonding initiatives.
- Eco-Recreational Tourism: Regions like Costa Rica and Norway promote eco-recreation, offering low-impact tourism such as guided rainforest hikes and glacier walks that combine sustainability with nature-based learning experiences.
Global Recreational Market: Stats & Facts
U.S. Bureau of Economic Analysis (BEA)
- Outdoor Recreation Value: The outdoor recreation economy in the U.S. contributed $1.1 trillion to the GDP in 2022, reflecting the rising importance of activities like camping, boating, hiking, and hunting as key contributors to national economic output.
- Employment Impact: The sector supported over 5 million jobs across sectors such as travel services, equipment manufacturing, and hospitality.
- RV Travel Contributions: Recreational vehicle activities, including road trips and camper rentals, added over $35 billion to the U.S. economy, showing a post-pandemic shift toward mobile and self-contained travel.
- Boating & Fishing Value: Boating and fishing activities combined contributed more than $28 billion, revealing the popularity and economic weight of water-based leisure in the U.S.
U.S. National Park Service (NPS)
- Visitor Volume: National parks across the U.S. received 325.5 million visits in 2023, indicating a return to pre-pandemic levels of recreational tourism and outdoor engagement.
- Top Park Attraction: The Great Smoky Mountains National Park remained the most visited, attracting 13.3 million visitors, thanks to its accessibility and biodiversity.
- Spending Near Parks: In 2022, national park visitors spent $23.9 billion in nearby communities, supporting local economies and highlighting the linkage between conservation and commerce.
Eurostat (European Commission Statistics)
- Activity Participation: As of 2023, 60% of Europeans aged 16 and above participated in recreational or physical activities (e.g., walking, sports, fitness) at least once per month, reflecting a culture of wellness and active living.
- Household Spending on Leisure: Cultural and recreational services, including cinema, concerts, and museums, accounted for 8.3% of household expenditure, showing strong consumer preference for experiences.
- Spending on Sports Services: 17.6% of EU households allocated spending toward recreational and sporting services such as gym memberships, training, and youth sports programs.
Japan Ministry of Land, Infrastructure, Transport and Tourism (MLIT)
- Domestic Travel Volume: Japanese citizens made 503.7 million domestic leisure trips in 2023, showing strong interest in nature retreats, cultural sites, and hot spring tourism.
- Household Participation: About 42.6% of households in Japan participated in recreational travel annually, underlining a steady demand for local tourism experiences.
- Spending on Domestic Recreation: Total spending on domestic recreational tourism reached ¥13.7 trillion, a substantial figure that emphasizes the economic role of leisure in Japan’s services sector.
U.S. Census Bureau
- Urbanization & Recreation Access: 80.7% of Americans now live in urban areas, increasing demand for urban recreation infrastructure like parks, trails, and community centers.
- General Participation: In 2022, 68% of adults in the U.S. reported participating in at least one form of recreational physical activity per month, such as walking, biking, or fitness classes.
U.S. Department of the Interior
- Funded Projects: Through the Land and Water Conservation Fund, over 1,000 outdoor recreation projects were financed in 2023, enabling park development, trail maintenance, and sports facility upgrades across states.
- Youth Access Programs: Over 2 million children accessed national parks and public lands through free educational and recreational programs, helping foster early interest in outdoor activity.
Canada’s Parks Canada Agency
- Park Visitation: In 2022, 15.6 million visits were recorded across Canadian national parks and historic sites, indicating a strong recovery in nature-based recreation post-COVID.
- Recreation Type Popularity: Hiking, birdwatching, and photography made up 65% of park usage, underscoring the popularity of non-commercial, eco-friendly recreation in Canada.
Australian Bureau of Statistics (ABS)
- Overall Participation: 59.5% of Australians aged 15 and above engaged in at least one sport or recreational physical activity in 2022, reflecting the country’s strong outdoor lifestyle.
- Top Activity: Walking for recreation was the most practiced, with a 44% participation rate, likely due to ease of access, low cost, and health benefits.
UK Office for National Statistics (ONS)
- Spending on Recreation: Households in the UK spent an average of £18.60 per week on recreational and cultural goods and services, including entertainment, sports, and games, reflecting a consistent consumer demand.
- Demographic Participation: The 25–44 age group attended the highest number of leisure events and activities, suggesting strong mid-age consumer engagement in sports centers, concerts, and public recreational programs.
World Health Organization (WHO)
- Activity Guidelines: WHO advises adults worldwide to engage in at least 150 minutes of moderate-intensity recreational activity per week to prevent chronic diseases and enhance mental health.
- Inactivity Risk: 27.5% of adults globally are classified as physically inactive, highlighting a public health challenge and an opportunity for growth in inclusive recreational services.
U.S. Fish and Wildlife Service (FWS)
- Wildlife Recreation Participation: More than 50 million Americans engaged in wildlife-related recreation such as hunting, fishing, and bird-watching in 2022.
- Economic Contribution: These activities generated over $144 billion in total spending, revealing the scale of demand for nature-based leisure in the U.S.
New Zealand Ministry of Business, Innovation and Employment (MBIE)
- Economic Value: Domestic tourism, including recreational trips, added NZD 25.3 billion to the economy in 2023, with continued growth across adventure tourism and wellness retreats.
- Recreation-Driven Travel: Around 39% of all domestic travel in New Zealand was for recreational or leisure purposes, emphasizing the cultural and economic importance of nature, beaches, and rural tourism.
U.S. Department of Agriculture: Forest Service
- Land Use for Recreation: The U.S. Forest Service oversees 193 million acres of land used for recreational activities, including hiking, camping, and snowmobiling.
- Job Creation: Forest-based recreation supports over 140,000 U.S. jobs, spanning tourism, lodging, outdoor gear, and conservation services.
South African Department of Sports, Arts and Culture
- Participation Rate: In 2022, 35% of South Africans participated in some form of sports or recreational activity each month, including music, fitness, and community sports.
- Government Investment: The government allocated ZAR 1.3 billion to improve recreational infrastructure, such as public sports fields, libraries, and youth centers.
Korea Ministry of Culture, Sports and Tourism
- Recreation Participation: In 2023, 69.2% of Korean adults reported engaging in cultural or recreational activities at least quarterly, such as gaming cafés, festivals, or local hikes.
- Nature-Based Activities: National parks and heritage-based recreation accounted for 24.8% of overall domestic leisure engagement, reinforcing a blend of modern and traditional recreation.
Global Recreational Market: Market Dynamic
Driving Factors in the Global Recreational Market
Increasing Urbanization and Demand for Structured Leisure
The rapid pace of urbanization is a key driver accelerating the growth of the global recreational market. As more people migrate to cities, the demand for structured, accessible, and time-efficient recreational activities has surged. In urban areas where natural spaces may be limited, there is growing investment in recreational infrastructure such as rooftop parks, community centers, and fitness studios.
Governments and municipalities are recognizing the role of recreation in public health, productivity, and community engagement, and thus are allocating budgets to develop walking trails, skateparks, cycle lanes, and open gyms. Urban dwellers often seek quick, revitalizing leisure options after work hours or on weekends, which fuels demand for indoor gaming lounges, group fitness classes, cultural festivals, and short adventure getaways.
Moreover, city living often results in higher stress levels, prompting a need for relaxation-based recreational solutions like wellness retreats, meditation centers, or immersive art exhibits. Urban density also fosters business models like recreation-as-a-service, where companies offer modular, time-bound experiences ranging from yoga pods to VR rooms. These developments ensure that the recreational market continues expanding even in highly populated regions by integrating leisure seamlessly into fast-paced lifestyles.
Rising Disposable Incomes and Middle-Class Expansion in Developing Economies
Emerging economies across Asia-Pacific, Latin America, and parts of Africa are witnessing a rapid increase in disposable income levels, particularly among the middle class. This financial upliftment is directly linked to a surge in spending on non-essential goods and services, particularly in the recreation sector. Families and individuals are increasingly allocating budgets for travel, fitness, outdoor gear, amusement parks, and digital entertainment subscriptions.
The aspirational nature of the growing middle class is fueling demand for branded sportswear, high-tech recreational equipment, and curated travel experiences. Governments in these regions are also investing in infrastructure such as national parks, sports facilities, and cultural centers to promote domestic tourism and encourage healthy lifestyles.
Moreover, the proliferation of smartphones and affordable internet has democratized access to recreational content and services, enabling even smaller towns to participate in virtual fitness classes, online gaming, and digital travel booking. As consumer priorities shift toward holistic well-being and social identity, recreation is becoming a symbol of lifestyle elevation. This is leading to the rapid localization of global recreational brands and services, creating new revenue opportunities across untapped and underserved markets, and sustaining long-term growth potential for the sector globally.
Restraints in the Global Recreational Market
Seasonal and Climate Dependency in Outdoor Recreation
A key limitation in the global recreational market is the inherent seasonality associated with outdoor activities. Tourism and leisure services tied to natural conditions like skiing, hiking, surfing, or wildlife viewing often experience fluctuating revenues due to changing weather patterns, school vacation calendars, and regional climate constraints. For instance, winter sports face shorter seasons due to warmer temperatures and reduced snowfall in traditional alpine destinations.
Similarly, monsoon-affected regions may see cancellations in hiking, camping, or adventure tours. This cyclicality creates financial instability for service providers, especially small businesses that depend heavily on peak seasons. In addition, changing climate patterns are making weather conditions more unpredictable, leading to logistical challenges, increased insurance costs, and safety concerns for participants.
This deters long-term investment in infrastructure and limits employment sustainability in seasonal recreation zones. Businesses are attempting to mitigate this by diversifying their offerings, for example, ski resorts offering summer hiking or wellness retreats, but the seasonal nature of outdoor recreation remains a fundamental restraint. Unless supported by strong contingency planning, revenue buffering, and adaptive models, the industry remains vulnerable to climate variability and seasonal imbalance.
Lack of Access and Affordability in Low-Income Regions
Despite global growth, the recreational market faces access barriers in underdeveloped or economically strained regions where infrastructure is inadequate and affordability is a major concern. Recreational services such as gyms, theme parks, or organized sports require substantial investment, both public and private, which many low-income areas lack. Moreover, when individuals struggle to meet basic needs, discretionary spending on recreation becomes nonviable.
Even community-level recreational activities like music, dance, or sports clubs are often underfunded or poorly maintained. Lack of transportation, limited digital access, and poor safety in public spaces further inhibit participation. In rural areas, gender disparity, cultural taboos, and educational gaps compound the issue, especially for women and children.
Although NGOs and local governments try to promote low-cost or volunteer-led recreation, scaling these models sustainably remains a challenge. The commercial recreational industry, in turn, finds limited incentive to enter these markets without financial support or clear ROI. This results in unequal recreational access, creating socio-economic divisions in mental and physical well-being. Addressing these limitations requires public-private partnerships, policy reforms, and community-driven planning to expand access and make recreation a universal right rather than a luxury.
Opportunities in the Global Recreational Market
Expansion of Inclusive and Adaptive Recreational Services
There is significant growth potential in developing recreational services that are inclusive of all abilities, age groups, and socio-economic backgrounds. Inclusive recreation focuses on accessibility both in terms of physical design and program structure and is gaining prominence due to increasing awareness of social equity, disability rights, and aging populations. Governments and NGOs are emphasizing inclusive community spaces, such as wheelchair-accessible hiking trails, adaptive sports programs for children with disabilities, and senior-friendly wellness centers.
Additionally, product manufacturers are innovating adaptive gear and sports equipment that enables participation without compromising safety or experience. This opens new avenues in recreational design, training services, and mobile outreach programs.
Educational institutions and corporations are also integrating inclusive recreation as part of employee wellness and student engagement initiatives. For example, inclusive playgrounds, sensory-friendly events, and multi-generational activity hubs are becoming common in urban settings. As regulatory support and funding for inclusive design grow, companies that prioritize accessibility are likely to see stronger brand loyalty and broader customer bases. This shift offers long-term revenue streams while fulfilling a critical societal need, making it both a moral and financial opportunity for the global recreational market.
Integration of Sustainable and Eco-Recreational Practices
The growing awareness around climate change and environmental sustainability is unlocking new opportunities in eco-recreation. Consumers are becoming more conscious of their environmental footprint, prompting demand for low-impact, nature-based recreational options such as forest bathing, bird watching, trail hiking, and carbon-neutral travel. Governments and private operators are responding by integrating green practices into recreational infrastructure building, eco-lodges, using solar-powered facilities, and promoting plastic-free zones in parks and campsites.
There is also a surge in regenerative tourism, where recreational experiences involve environmental restoration activities like tree planting or beach clean-ups. These practices appeal to environmentally conscious tourists and locals alike, especially in biodiversity-rich regions. Startups and community enterprises are emerging with business models built on conservation-based recreation, targeting niche markets like wildlife photography, glamping, and permaculture-based retreats.
Additionally, digital tools such as carbon footprint calculators and sustainability ratings for destinations are being incorporated into travel and recreational planning platforms. This not only adds transparency but also encourages responsible behavior. As environmental policies and consumer preferences converge, eco-recreation stands as a resilient and scalable opportunity that aligns long-term profitability with planetary well-being.
Trends in the Global Recreational Market
Rise of Experience-Driven and Wellness-Oriented Recreation
Consumers worldwide are increasingly prioritizing experience over ownership, driving demand for immersive, wellness-oriented recreational activities. This trend is particularly evident among Millennials and Gen Z, who are more inclined to invest in activities like hiking, yoga retreats, virtual gaming, and eco-tourism rather than material goods. Urban populations are also gravitating toward recreational experiences that offer physical and emotional well-being, such as nature-based getaways, fitness boot camps, and spa tourism. These experience-centric trends align with the global health and mental wellness movement, further accelerated by post-pandemic lifestyle changes.
Additionally, the concept of “self-care through recreation” is expanding across socioeconomic groups, prompting governments and private entities to invest in urban green spaces, community recreation centers, and digital fitness platforms. As more consumers seek balance and mental clarity, recreation is being reframed not just as leisure, but as a fundamental part of preventive healthcare and holistic living. This shift is fostering innovation in the recreational equipment market, mobile wellness apps, and subscription-based travel services, which are being designed to address physical, emotional, and spiritual needs simultaneously.
Digital Integration in Recreational Experiences
Technological integration is rapidly transforming the global recreational landscape. From virtual reality (VR) escape rooms and e-sports arenas to AI-powered fitness platforms and mobile booking apps, digital technology is redefining how consumers engage with leisure. The growing penetration of high-speed internet and smartphones has made it easier to access real-time recreational experiences, plan trips, track physical activity, and share those experiences socially. Digital transformation also allows for the personalization of recreational activities.
Users can now choose workouts based on biometric feedback, join multiplayer games from remote locations, or attend virtual tours of museums or amusement parks. The gaming industry, particularly with innovations in augmented and virtual reality, has become a dominant form of indoor recreation, capturing youth and adult markets alike.
Additionally, wearable technology such as fitness bands, GPS devices, and smart sports gear enhances engagement by offering health tracking and performance metrics. This fusion of recreation and technology not only boosts participation across demographics but also enables new revenue models like freemium apps, gamified fitness subscriptions, and interactive digital challenges. Governments and tourism boards are also leveraging digital platforms to promote national parks, events, and festivals, thereby making recreation more inclusive, accessible, and dynamic across regions and age groups.
Global Recreational Market: Research Scope and Analysis
By Type of Activity Analysis
Outdoor recreation is projected to be the dominant segment in the recreational market, accounting for the highest revenue share due to increasing global interest in health, nature, and adventure-based lifestyles. Post-pandemic, there has been a significant shift toward open-air activities like hiking, camping, mountain biking, kayaking, and birdwatching, as individuals seek physical well-being and mental rejuvenation. Outdoor activities offer a blend of fitness and exploration, which strongly appeals to millennials and Gen Z, particularly in North America, Europe, and the Asia-Pacific region.
The affordability and accessibility of many outdoor recreational options further contribute to this dominance. For instance, hiking and cycling require minimal gear investment and are widely supported by public infrastructure like trails, parks, and campsites. Governments worldwide have invested in improving these facilities, boosting both participation rates and market demand. Moreover, the rise of social media and outdoor lifestyle influencers has popularized travel and adventure among young consumers.
Sustainability and eco-tourism trends also play a crucial role in propelling the outdoor segment. Consumers now seek low-impact, nature-based experiences that align with conservation efforts. This has encouraged growth in activities like glamping (luxury camping), eco-tours, and forest bathing. In developed nations, the increasing popularity of national parks and outdoor events, such as music festivals and endurance sports, further accelerates growth.
Additionally, the outdoor recreation industry benefits from diverse revenue streams equipment sales, rentals, guided services, and tourism partnerships. As urban populations seek escape in nature and as remote work allows more flexible travel, outdoor recreation continues to lead the recreational market landscape.
ℹ
To learn more about this report –
Download Your Free Sample Report Here
By Product Analysis
Among the product categories in the recreational market, recreational equipment is poised to hold the dominant position due to its diverse applications, consistent demand, and wide affordability range. This segment includes camping gear, sports equipment, fishing and hunting tools, exercise and fitness gear, water activity gear (e.g., paddleboards, kayaks), and portable recreational devices. Its mass appeal across different age groups and lifestyles makes it the most widely consumed product type in the market.
Recreational equipment benefits from high purchase frequency and lower entry costs compared to RVs or luxury items. Consumers increasingly invest in gear that supports their leisure time, health goals, or outdoor interests. The rise of home fitness and do-it-yourself adventures also fuels this segment, particularly among millennials and Gen Z, who favor experiential spending over luxury or static entertainment.
Technological advancements are pushing innovation in this segment. For example, GPS-enabled fishing tools, compact and weather-resistant tents, and multifunctional fitness devices are enhancing user experience and encouraging market expansion. The equipment segment also aligns well with both outdoor and indoor recreation, giving it a versatile edge over RVs or wearables that may serve more niche purposes.
Retail trends such as e-commerce, D2C (direct-to-consumer) brands, and rental models have further improved accessibility and distribution of recreational equipment. Seasonal sales spikes, holiday promotions, and influencer marketing also make recreational gear a highly visible and actively promoted category. As sustainability and minimalism become lifestyle choices, lightweight, durable, and reusable gear is gaining popularity.
Overall, the recreational equipment segment remains dominant due to its utility, wide demographic appeal, and essential role in enabling various types of recreational activities.
By Business Models Analysis
The pay-per-use business model is anticipated to dominate the recreational market due to its cost-efficiency, convenience, and alignment with changing consumer preferences favoring access over ownership. This model is especially popular in urban and tourist-heavy regions, where individuals prefer renting rather than owning expensive or infrequently used recreational products. Whether it’s renting bicycles, kayaks, sports gear, or gaming consoles, pay-per-use offers consumers the flexibility to enjoy high-quality recreational experiences without the burden of storage, maintenance, or full-time ownership costs.
Technological integration has played a pivotal role in boosting this model. The rise of mobile apps, integrated payment systems, and GPS tracking makes it easy to locate, access, and pay for recreational equipment on an hourly or daily basis. Companies like Lime (bike and scooter rentals), GoPro (camera rentals), and ClassPass (fitness classes) have capitalized on this model to build scalable, user-centric businesses.
Additionally, the sharing economy mindset, especially among millennials and Gen Z, supports this model’s popularity. Consumers are increasingly environmentally conscious and financially cautious, leading them to seek experiences without long-term commitments. Pay-per-use also enables trial usage, reducing the entry barrier for new or unfamiliar recreational activities.
Moreover, businesses benefit from recurring revenue, inventory optimization, and customer loyalty driven by low-cost access and satisfaction. This model is particularly successful in sectors like adventure sports, urban recreation, and gaming, where ownership may not be economically practical.
In summary, the pay-per-use model’s flexibility, cost savings, and digital compatibility make it the leading choice among recreational business models, appealing to both service providers and modern, experience-focused consumers.
By Purpose Analysis
Within the recreational market, entertainment and leisure are projected to be the most dominant purpose segments due to their broad scope, high consumer engagement, and consistent year-round demand. This segment encompasses everything from amusement parks, VR gaming, and movie theaters to social outings, live events, and hobby-based activities like photography, gardening, and indoor games. Unlike fitness or adventure-focused activities that may have niche or seasonal appeal, entertainment and leisure cater to all ages, demographics, and income groups.
A major factor behind this segment’s dominance is its integration into daily life and culture. People seek recreation not just for fitness or skill-building, but to relax, socialize, and disconnect from work and routine. This drives demand for casual, repeatable, and family-friendly entertainment experiences. Moreover, the growth of streaming services, immersive tech (AR/VR), escape rooms, and eSports has transformed how people consume leisure activities, expanding opportunities beyond traditional formats.
Urbanization and rising disposable income in developing countries further fuel demand for accessible entertainment venues such as malls, multiplexes, and recreational hubs. In developed nations, premium experiences like luxury cinemas, interactive exhibitions, or private gaming lounges add value to the segment’s profitability.
Additionally, entertainment and leisure have cross-market linkages with travel, retail, and food services. Vacation packages, resort experiences, and cruise lines often bundle leisure activities to attract families and group travelers, reinforcing the segment's commercial importance.
Ultimately, entertainment and leisure dominate the recreational market due to their adaptability, inclusiveness, and central role in emotional well-being, making them indispensable across geographies and cultures.
By Consumer Group Analysis
The family consumer group is expected to be the dominant segment in the recreational market due to its significant contribution to overall spending, frequency of activity, and demand for diversified experiences. Families often plan vacations, weekend outings, and seasonal recreational activities that cater to multiple age groups. As a result, service providers and product companies heavily target this group with tailored offerings ranging from amusement park packages and camping gear bundles to family fitness programs and entertainment subscriptions.
Family-based recreation offers a collective experience, which fosters bonding, emotional wellness, and shared memory-making, critical motivators in today’s experience-driven economy. This group also drives demand across all categories: outdoor adventure, indoor play zones, water parks, travel and tourism, and at-home entertainment. Recreational service providers invest in child-friendly amenities, multi-generational attractions, and bundled deals that appeal to parents seeking value for money.
Further, the presence of children significantly influences purchasing behavior. Parents are more likely to invest in quality gear, educational toys, safety accessories, and memberships that ensure long-term engagement. For example, family-oriented fitness centers, zoos, museums, and cultural events are designed with multi-user appeal and accessibility in mind.
Global travel and tourism patterns also indicate that family travel has rebounded strongly post-pandemic, driving demand for destination resorts, group camping sites, and family-friendly transport options like RVs. Technology plays a role as well, with apps and streaming services offering customizable content or activity plans for all family members.
In conclusion, the family segment dominates due to its scale, emotional relevance, high lifetime customer value, and its influence on recreational infrastructure and innovation. It remains the primary target group for most recreational product and service providers.
By Distribution Channel Analysis
Online retail is anticipated to dominate the recreational market's distribution channels due to its convenience, wider product access, and digital-first consumer behavior. With e-commerce platforms offering everything from fitness equipment and camping gear to VR consoles and travel experiences, online retail has emerged as the go-to channel for both physical products and recreational service bookings. The growth of global giants like Amazon, Decathlon, and niche online marketplaces has accelerated consumer adoption, especially post-pandemic, when in-store shopping declined.
Key drivers include accessibility, competitive pricing, user reviews, and doorstep delivery. Online channels allow users to explore detailed product specifications, watch tutorials, compare prices, and take advantage of seasonal offers, all from the comfort of their homes. Additionally, many recreational brands have adopted direct-to-consumer (D2C) models, offering exclusive online discounts, subscriptions, and loyalty programs that incentivize digital purchases.
In regions with strong internet and smartphone penetration, such as North America, Europe, and parts of Asia-Pacific, online recreational sales have outpaced traditional retail. Specialized e-commerce platforms dedicated to sports, adventure gear, or indoor games also add value by offering curated collections and expert recommendations. Integration with digital payment platforms and buy-now-pay-later (BNPL) services further eases consumer spending.
Augmented reality (AR) tools, virtual fitting rooms, and 3D product visualizations have also enhanced customer confidence in online purchases. The growing influence of social media marketing and influencer endorsements on platforms like Instagram, YouTube, and TikTok drives product discovery and impulse buying.
In short, the dominance of online retail stems from its alignment with modern consumer expectations of speed, selection, personalization, and price transparency, making it the most powerful and rapidly growing channel in the recreational market.
By End-Use Industry Analysis
Tourism and hospitality are poised to be the dominant end-use industries in the recreational market due to their intrinsic connection with leisure activities, experiential travel, and group recreation. This segment encompasses hotels, resorts, travel operators, cruise lines, and tour agencies, all of which integrate recreational components into their services, such as spa treatments, outdoor excursions, cultural tours, water sports, and wellness retreats. As travel resumes worldwide, the demand for recreation-enriched tourism is rising rapidly.
Recreational experiences are often the primary motivators for travel. Consumers plan vacations around activities like skiing, scuba diving, heritage exploration, or theme park visits. Consequently, tourism businesses strategically incorporate recreational amenities to attract guests, lengthen stays, and increase spending per visitor. All-inclusive resorts, for example, offer yoga sessions, guided hikes, and kids’ clubs as value-added services. Similarly, cruises provide entertainment shows, casinos, pools, and onboard games.
The growth of niche travel markets like eco-tourism, adventure tourism, and cultural tourism further enhances this segment’s importance. Tourism boards globally are collaborating with recreation providers to develop destination experiences that appeal to international and domestic travelers alike. Governments often support these initiatives through infrastructure development, public-private partnerships, and regional branding.
Hospitality businesses also benefit from cross-selling opportunities: travel bookings combined with recreational events, meal packages, or merchandise. Technology is another enabler, online booking platforms, virtual tours, and AI-powered personalization help tailor recreational experiences to traveler preferences.
In essence, the tourism and hospitality industry dominates due to its revenue potential, immersive consumer experience, and strategic positioning at the intersection of leisure, lifestyle, and mobility, making it a foundational pillar of the global recreational market.
The Global Recreational Market Report is segmented on the basis of the following:
By Type of Activity
- Outdoor Recreation
- Camping
- Hiking & Trekking
- Hunting & Fishing
- Adventure Sports
- Water Sports
- Biking & Off-roading
- Indoor Recreation
- Board Games
- Virtual Reality (VR) Experiences
- Indoor Rock Climbing
- Fitness Centers & Yoga Studios
- Bowling & Arcade Centers
- Travel & Tourism-Based Recreation
- Theme Parks & Amusement Parks
- Cruise Vacations
- Cultural & Heritage Tourism
- Eco-Tourism & Wildlife Safaris
- Arts & Entertainment
- Concerts & Music Festivals
- Theater & Performing Arts
- Museums & Galleries
- Cinema & Streaming Entertainment
By Product
- Recreational Equipment
- Bicycles & Scooters
- Boating & Watercraft Equipment
- Camping Gear
- Fishing and Hunting Gear
- Sports Equipment
- Recreational Vehicles (RVs)
- Motorhomes
- Towable RVs
- All-Terrain Vehicles (ATVs)
- Snowmobiles & Jet Skis
- Recreational Wearables & Accessories
- Outdoor Apparel
- Footwear
- Smart Devices for Fitness & Tracking
By Business Models
- Subscription-Based
- Pay-Per-Use
- Freemium Models
- Peer-to-Peer Rentals
By Purpose
- Fitness & Wellness
- Entertainment & Leisure
- Social Interaction
- Adventure & Exploration
- Skill Development
By Consumer Group
- Individual
- Family
- Corporate/Group
- Educational Institutions
- Sports Clubs & Adventure Groups
By Distribution Channel
- Online Retail
- Specialty Stores
- Hypermarkets/Supermarkets
- Sports & Outdoor Equipment Stores
- Rental Services & Subscriptions
By End-Use Industry
- Tourism & Hospitality
- Sports & Fitness Industry
- Government Parks & Recreation Departments
- Educational Institutions
- Defense & Training Facilities
Impact of Artificial Intelligence in the Global Recreational Market
- Personalized Experience Design: AI enables recreational platforms, apps, and tourism companies to deliver personalized activity recommendations, travel plans, and product suggestions based on individual preferences, behavior, and history. This enhances user satisfaction, increases engagement, and drives higher conversion rates for service providers.
- Smart Equipment and Wearables: AI is integrated into fitness trackers, smart bikes, camping gear, and sports equipment to monitor performance, optimize usage, and ensure safety. Real-time data analysis helps users improve health and recreational outcomes while providing feedback on posture, movement, and activity efficiency.
- Predictive Maintenance and Safety in Recreational Vehicles: AI-powered sensors in RVs, boats, and off-road vehicles help monitor engine health, predict maintenance needs, and alert users to safety issues, minimizing breakdowns and ensuring a smooth recreational experience, especially during remote travel.
- Virtual and Augmented Reality Integration: AI-driven VR/AR tools enhance indoor recreation through immersive gaming, virtual travel experiences, and simulated sports environments. These technologies are especially impactful for urban users with limited access to outdoor spaces or global travel.
- Intelligent Booking, Pricing & Customer Service: AI chatbots, dynamic pricing algorithms, and virtual assistants simplify travel and recreational bookings, improving convenience, optimizing cost, and offering real-time customer support. This streamlines user interactions across hospitality, tours, rentals, and event platforms.
Global Recreational Market: Regional Analysis
Region with the Largest Revenue Share
North America is expected to hold the dominant share in the global recreational market with 38.2% of total market share in 2025, due to a combination of economic prosperity, cultural integration of recreation, and robust infrastructure. The United States and Canada lead in consumer expenditure on leisure and recreation, driven by high disposable incomes, strong work-life balance initiatives, and an ingrained culture of outdoor and wellness activities. From national parks and RV road trips to boating, skiing, and sporting events, recreational engagement is a core part of the North American lifestyle.
The region boasts extensive natural resources and well-developed infrastructure supporting all forms of recreation whether public parks, trails, lakes, or indoor sports complexes. Government and municipal bodies also invest heavily in recreational programs, public fitness initiatives, and community leisure centers, further enhancing access across all age groups. The presence of renowned recreational brands, equipment manufacturers, and service providers like Polaris, Winnebago, Brunswick Corporation, and Peloton further strengthens the market.
Technology adoption also plays a vital role. North America is a leader in integrating digital tools into recreation from fitness tracking wearables and VR gaming to digital rentals and subscription-based fitness platforms. Additionally, the rise of eco-conscious and wellness-driven consumers has expanded market scope into sustainable tourism, glamping, and nature-based retreats.
ℹ
To learn more about this report –
Download Your Free Sample Report Here
Region with the Highest CAGR
The Asia Pacific (APAC) region is experiencing the highest CAGR in the global recreational market due to rapid economic growth, expanding middle class, rising disposable income, and increasing urbanization. Countries such as China, India, Japan, South Korea, and Southeast Asian nations are witnessing a cultural shift toward leisure, fitness, and travel as consumers prioritize lifestyle enhancement alongside economic progress.
Government initiatives across APAC are driving infrastructure development for parks, sports facilities, tourism destinations, and eco-friendly recreation hubs. For example, India’s “Dekho Apna Desh” tourism initiative and China’s national fitness campaign are expanding access to both indoor and outdoor recreation. Meanwhile, countries like Japan and South Korea lead in technology-driven entertainment such as eSports, VR gaming, and tech-enabled fitness centers.
The region also benefits from a young, digitally savvy population that is embracing mobile apps for recreational planning, booking, and product purchases. This tech-friendly demographic is fueling demand for recreational subscriptions, online fitness classes, and digital travel experiences.
The rising trend of domestic and short-distance travel accelerated by the pandemic recovery has also contributed to the growth of local tourism and family-based leisure. The Asia Pacific’s diverse geography offers immense potential for outdoor adventures, water sports, and cultural tourism, creating opportunities for recreation across all socio-economic segments.
By Region
North America
Europe
- Germany
- The U.K.
- France
- Italy
- Russia
- Spain
- Benelux
- Nordic
- Rest of Europe
Asia-Pacific
- China
- Japan
- South Korea
- India
- ANZ
- ASEAN
- Rest of Asia-Pacific
Latin America
- Brazil
- Mexico
- Argentina
- Colombia
- Rest of Latin America
Middle East & Africa
- Saudi Arabia
- UAE
- South Africa
- Israel
- Egypt
- Rest of MEA
Global Recreational Market: Competitive Landscape
The global recreational market is highly competitive and fragmented, comprising multinational corporations, regional manufacturers, tech startups, and service providers spanning equipment, vehicles, digital platforms, and tourism services. Key players dominate through innovation, brand reputation, and diversified portfolios, but face growing competition from emerging brands in Asia-Pacific and Europe.
Prominent companies include Brunswick Corporation, Polaris Inc., Yamaha Motor Co., Ltd., Thor Industries, Peloton Interactive, and Johnson Outdoors, which lead in recreational boats, off-road vehicles, RVs, and fitness equipment. These firms leverage strong dealer networks, after-sales services, and product innovation to retain customer loyalty. Many are investing in eco-friendly solutions, such as electric recreational vehicles and sustainable camping gear, to align with shifting consumer values.
Technology-focused players like ClassPass, Zwift, and Strava are gaining market share through subscription-based fitness platforms and gamified recreation, especially among urban and millennial users. Meanwhile, companies like Airbnb and GetMyBoat have extended peer-to-peer rental models into the recreational space, creating new competitive dimensions.
Strategic partnerships, acquisitions, and vertical integration are prevalent. For instance, RV manufacturers collaborate with smart tech firms to enhance connected camping experiences. Simultaneously, many companies are expanding into emerging markets particularly in Asia Pacific via e-commerce and localized marketing campaigns.
The competitive landscape is also shaped by seasonal demand, innovation cycles, and digital disruption. Sustainability, personalization, and hybrid experiences are expected to be the next frontier for gaining market advantage in this evolving sector.
Some of the prominent players in the Global Recreational Market are:
- The North Face
- Patagonia
- REI Co-op
- Black Diamond Equipment
- Disney Parks & Experiences
- Universal Parks & Resorts
- Carnival Corporation
- Expedia Group
- Nike
- Adidas
- Peloton
- Decathlon
- Sony Interactive Entertainment
- Microsoft Gaming (Xbox)
- Tencent Games
- Netflix
- Dave & Buster’s
- Topgolf
- Escape Room Entertainment
- Lululemon
- Other Key Players
Recent Developments in the Global Recreational Market
July 2024
- Peloton x Lululemon Collaboration: Extended partnership to launch co-branded fitness apparel, integrating Lululemon’s design with Peloton’s digital workouts, enhancing athleisure appeal for home and gym users.
- Netflix at E3 2024: Showcased interactive gaming expansions, including Stranger Things and Squid Game titles, signaling deeper moves into cloud gaming and immersive entertainment.
June 2024
- LEGO & Epic Games $1B Metaverse Deal: Joint investment to develop kid-safe virtual worlds, merging LEGO’s creativity with Fortnite’s platform for family-friendly digital play.
- Disney x Fortnite $1.5B Partnership: Largest-ever Disney gaming integration, bringing Marvel, Star Wars, and Pixar into Fortnite’s metaverse, including interactive storytelling and virtual theme parks.
- Summer CES 2024 (Chicago): Highlighted AR/VR fitness tech, AI-powered recreation devices, and next-gen gaming peripherals, emphasizing hybrid physical-digital experiences.
May 2024
- Mercedes-Benz x Roblox Virtual Rides: Launched immersive Roblox experiences, allowing users to test-drive digital Mercedes models, blending automotive marketing with gaming engagement.
- Nintendo Acquires Next-Level Games: Strengthened first-party Switch exclusives by fully absorbing the studio behind Luigi’s Mansion 3, ensuring long-term development control.
April 2024
- Sony-Honda Afeela EV Gaming: Revealed in-car PlayStation compatibility for Afeela EVs, turning vehicles into mobile gaming hubs with cloud streaming and VR integration.
- IAAPA Expo Europe (Paris): Spotlighted AI-driven theme park innovations, including robotic entertainers and dynamic ride personalization, shaping future attractions.
March 2024
- Meta Quest 3 Fitness Bundle with Nike: Bundled VR headset with Nike training apps, targeting home fitness users with motion-tracked workouts and gamified challenges.
- Hasbro Buys D&D Beyond: Fully integrated the digital D&D platform into Wizards of the Coast, streamlining tools for players and expanding monetization.
February 2024
- Netflix Acquires Boss Fight Entertainment: Expanded mobile gaming catalog by purchasing the studio behind Dungeon Boss, aiming for more mid-core game offerings.
- SXSW Gaming Expo 2024: Featured indie game debuts, VR esports demos, and panels on AI’s role in game design, drawing 50,000+ attendees.
January 2024
- Amazon Luna x Ubisoft Deal: Added Assassin’s Creed and Far Cry to Luna’s cloud service, bolstering its library against Xbox Cloud Gaming.
- CES 2024 (Las Vegas): Unveiled AI-powered fitness mirrors, haptic gaming suits, and Samsung’s AR glasses, setting trends for recreational tech.
Report Details
| Report Characteristics |
| Market Size (2025) |
USD 147.9 Bn |
| Forecast Value (2034) |
USD 254.9 Bn |
| CAGR (2025–2034) |
6.2% |
| Historical Data |
2019 – 2024 |
| The US Market Size (2025) |
USD 47.5 Bn |
| Forecast Data |
2025 – 2033 |
| Base Year |
2024 |
| Estimate Year |
2025 |
| Report Coverage |
Market Revenue Estimation, Market Dynamics, Competitive Landscape, Growth Factors, etc. |
| Segments Covered |
By Type of Activity (Outdoor Recreation, Indoor Recreation, Travel & Tourism-Based Recreation, Arts & Entertainment), By Product (Recreational Equipment, Recreational Vehicles (RVs), Recreational Wearables & Accessories), By Business Models (Subscription-Based, Pay-Per-Use, Freemium Models, Peer-to-Peer Rentals), By Purpose (Fitness & Wellness, Entertainment & Leisure, Social Interaction, Adventure & Exploration, Skill Development), By Consumer Group (Individual, Family, Corporate/Group, Educational Institutions, Sports Clubs & Adventure Groups), By Distribution Channel (Online Retail, Specialty Stores, Hypermarkets/Supermarkets, Sports & Outdoor Equipment Stores, Rental Services & Subscriptions), By End-Use Industry (Tourism & Hospitality, Sports & Fitness Industry, Government Parks & Recreation Departments, Educational Institutions, Defense & Training Facilities)
|
| Regional Coverage |
North America – US, Canada; Europe – Germany, UK, France, Russia, Spain, Italy, Benelux, Nordic, Rest of Europe; Asia-Pacific – China, Japan, South Korea, India, ANZ, ASEAN, Rest of APAC; Latin America – Brazil, Mexico, Argentina, Colombia, Rest of Latin America; Middle East & Africa – Saudi Arabia, UAE, South Africa, Turkey, Egypt, Israel, Rest of MEA |
| Prominent Players |
The North Face, Patagonia, REI Co-op, Black Diamond Equipment, Disney Parks & Experiences, Universal Parks & Resorts, Carnival Corporation, Expedia Group, Nike, Adidas, Peloton, Decathlon, Sony Interactive Entertainment, Microsoft Gaming (Xbox), Tencent Games, Netflix, Dave & Buster’s, Topgolf, Escape Room Entertainment, and Lululemon, and Other Key Players
|
| Purchase Options |
We have three licenses to opt for: Single User License (Limited to 1 user), Multi-User License (Up to 5 Users), and Corporate Use License (Unlimited User) along with free report customization equivalent to 0 analyst working days, 3 analysts working days, and 5 analysts working days respectively. |
Frequently Asked Questions
How big is the Global Recreational Market?
▾ The Global Recreational Market size is estimated to have a value of USD 147.9 billion in 2025 and is expected to reach USD 254.9 billion by the end of 2034.
What is the growth rate in the Global Recreational Market in 2025?
▾ The market is growing at a CAGR of 6.2 percent over the forecasted period of 2025.
What is the size of the US Recreational Market?
▾ The US Recreational Market is projected to be valued at USD 47.5 billion in 2025. It is expected to witness subsequent growth in the upcoming period as it holds USD 79.1 billion in 2034 at a CAGR of 5.8%.
Which region accounted for the largest Global Recreational Market?
▾ North America is expected to have the largest market share in the Global Recreational Market with a share of about 38.2% in 2025.
Who are the key players in the Global Recreational Market?
▾ Some of the major key players in the Global Recreational Market are The North Face, Patagonia, REI Co-op, Black Diamond Equipment, Disney Parks & Experiences, Universal Parks & Resorts, Carnival Corporation, and many others.