Market Overview
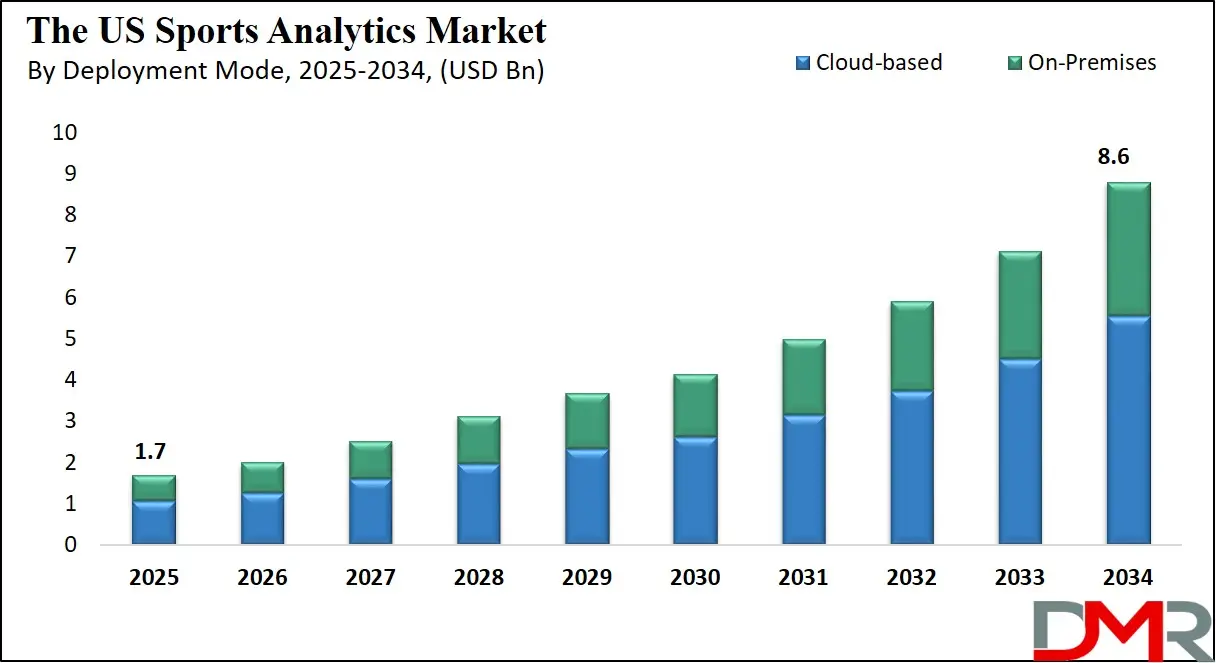
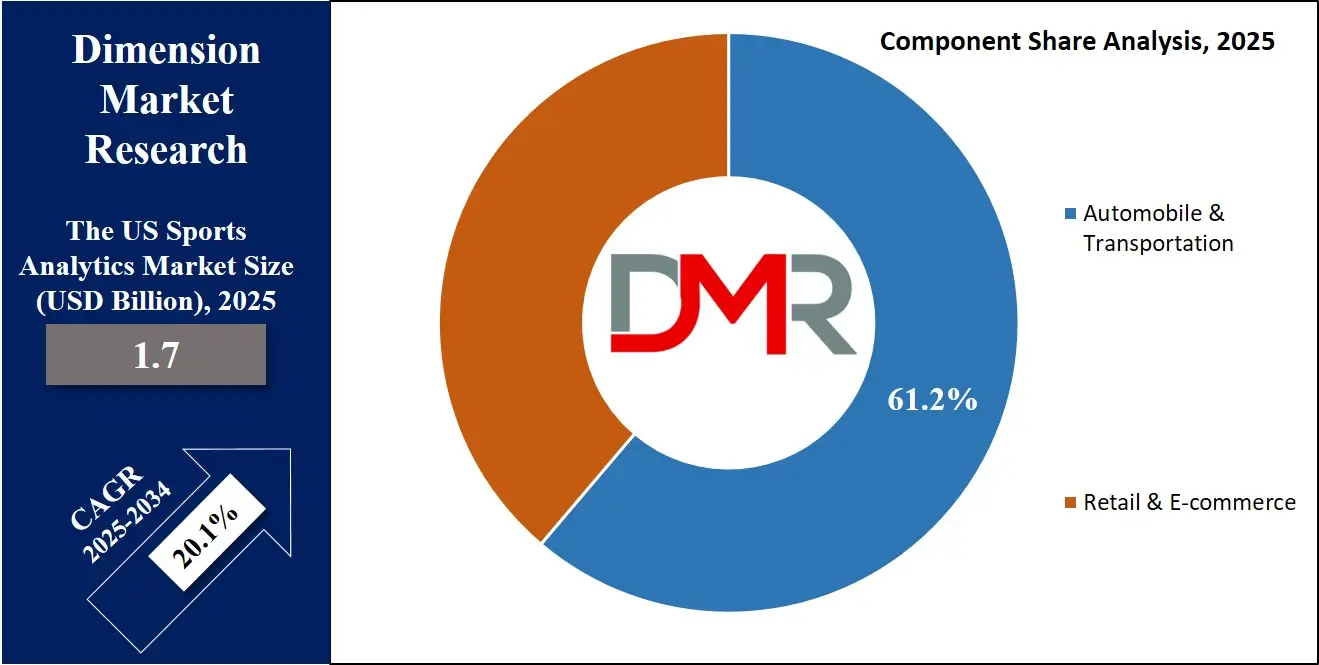
The US Sports Analytics Market is predicted to be valued at USD 1.7 billion in 2025 and is expected to grow to USD 8.6 billion by 2034, registering a compound annual growth rate (CAGR) of 20.1% from 2025 to 2034.
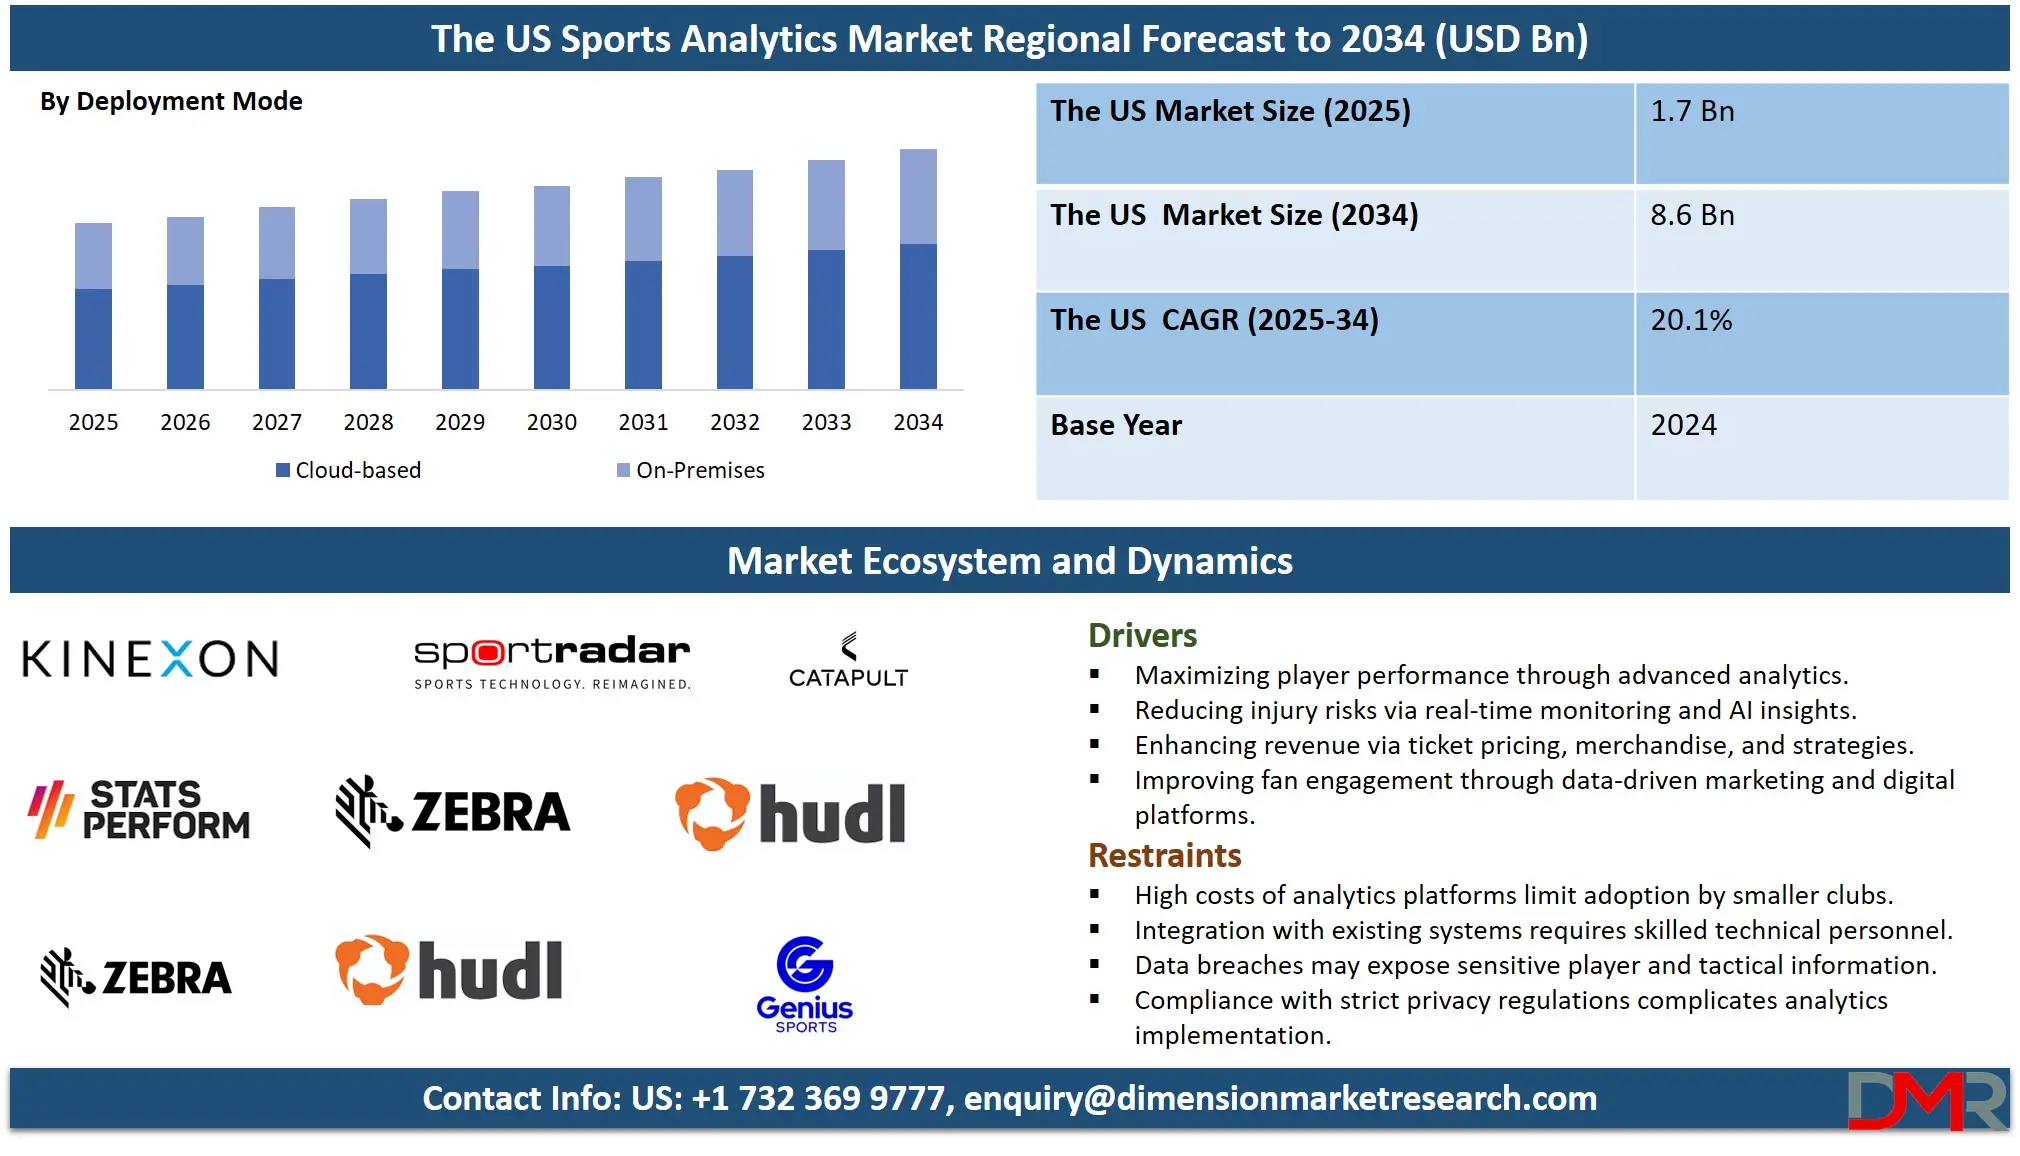
The US sports analytics market encompasses data-driven solutions and technologies designed to optimize athletic performance, enhance fan engagement, and improve strategic decision-making. It integrates big data analytics, wearable technology, and advanced software tools to deliver actionable insights for teams, coaches, and organizations.
The scope covers player performance monitoring, injury prevention, recruitment optimization, and tactical analysis across professional, collegiate, and recreational sports. Key components include predictive modeling, video analytics, real-time tracking, and sports data management platforms. Primary applications span game strategy development, fan experience personalization, ticketing optimization, and commercial performance enhancement, enabling stakeholders to maximize competitiveness, profitability, and long-term sports industry growth.
The US sports analytics market is evolving as organizations increasingly leverage data intelligence to gain competitive advantages. From professional leagues to collegiate programs, teams are adopting advanced analytics for performance improvement, injury risk assessment, and tactical planning.
Technological integration, including artificial intelligence, machine learning, and real-time data capture, is transforming sports management. Wearable devices and tracking sensors collect in-depth player metrics, enabling personalized training regimens and strategic adjustments during live matches for optimal outcomes.
Beyond on-field performance, analytics support fan engagement strategies. Sports organizations employ sentiment analysis, digital content personalization, and dynamic ticket pricing models to boost loyalty, maximize attendance, and enhance overall spectator experiences.
The commercial applications extend to sponsorship optimization, broadcast enhancement, and talent scouting. Data visualization tools, predictive modeling, and scenario simulations allow decision-makers to align athletic performance with business growth objectives, positioning analytics as a core driver of success in the US sports ecosystem.
US Sports Analytics Market: Key Takeaways
- Market Overview: The US Sports Analytics Market is projected to reach USD 1.7 billion in 2025 and expand to USD 8.6 billion by 2034, reflecting a compound annual growth rate (CAGR) of 20.1% during the forecast period.
- Component Analysis: The solutions segment is anticipated to lead the market, comprising 61.2% of the total share in 2025.
- Type Analysis: On-field analytics is expected to hold the largest portion, representing 58.7% of the market value in 2025.
- Deployment Mode Analysis: Cloud-based solutions are forecast to dominate, accounting for 66.5% of the market share in 2025.
- Sports Type Overview: Team sports are projected to be the leading category, capturing 72.8% of the share in 2025.
- Application Insight: team, and performance analysis is set to remain at the forefront, making up 54.1% of the market share in 2025.
- End User Analysis: Sports teams are predicted to maintain the largest share, representing 49.8% of the total market value in 2025.
US Sports Analytics Market: Use Cases
- Player Performance Optimization: In US professional basketball, sports analytics systems capture real-time biometric and movement data during games and training. Coaches use AI-powered insights to adjust player workload, enhance stamina, and refine tactics, ultimately improving efficiency, reducing injury risks, and maintaining peak competitive performance across the season.
- Fan Engagement Enhancement: NFL teams use advanced analytics to personalize digital content, in-stadium experiences, and marketing campaigns. By analyzing fan behavior, purchase patterns, and social media interactions, organizations create targeted offers and immersive experiences that deepen loyalty, boost merchandise sales, and increase overall revenue from both local and global audiences.
- Recruitment and Scouting Efficiency: Major League Baseball franchises leverage predictive analytics to evaluate player potential based on performance trends, biomechanics, and situational statistics. This data-driven approach improves scouting accuracy, reduces recruitment risks, and ensures optimal roster building for sustained team competitiveness in a highly data-driven sporting environment.
- Tactical Decision-Making in Matches: In US soccer leagues, analytics platforms deliver real-time tactical insights on opponent formations, player fatigue, and scoring opportunities. Coaches make data-backed substitutions and formation adjustments mid-game, increasing the likelihood of favorable outcomes while enhancing the team’s adaptability to evolving match conditions.
- Revenue and Sponsorship Optimization: NBA franchises apply advanced sports analytics to measure sponsorship ROI, ticketing performance, and merchandise sales. By correlating fan engagement data with marketing campaigns, teams optimize pricing strategies and partnership deals, maximizing commercial returns without compromising the fan experience.
US Sports Analytics Market: Stats & Facts
- U.S. Department of Labor: Data indicates sports analytics employment in the U.S. rose by 18% from 2018 to 2023, highlighting growing demand for data specialists in professional and collegiate sports.
- National Collegiate Athletic Association (NCAA): Survey data reveals 64% of NCAA Division I teams utilize advanced statistical software to improve player recruitment, training efficiency, and in-game decision-making strategies.
- U.S. Bureau of Labor Statistics: The median annual salary for sports statisticians in the U.S. was USD 92,000 in 2023, reflecting competitive pay for advanced data analytics expertise.
- MIT Sloan Sports Analytics Conference: Attendance grew from 2,200 in 2015 to over 3,500 in 2023, demonstrating increased industry and academic interest in analytics-driven sports strategies.
- Pew Research Center: In 2023, 54% of U.S. sports fans believed analytics improved game fairness, showing public support for data-driven decision-making in competitive sports.
- USA Today: Analysis revealed that 78% of NFL teams used predictive analytics to inform draft choices, showing widespread adoption in talent selection processes.
- Sports Innovation Lab: A 2023 report found 65% of U.S. sports organizations invested in wearable technology for real-time biometric and performance data collection.
- National Science Foundation: Grants for sports analytics research in U.S. universities totaled USD 12 million in 2022, indicating academic prioritization of this growing field.
- ESPN Analytics: During the 2023 MLB season, teams using data-driven shift strategies reduced opponent batting averages by 0.018 points, proving analytics' tangible competitive impact.
- Harvard Sports Analytics Collective: Research showed basketball teams using advanced player tracking improved offensive efficiency by 4.6% on average during the 2022–2023 season.
- International Society of Sports Nutrition: U.S. teams incorporating nutrition analytics reported a 21% reduction in injury rates over two seasons, highlighting data's role in player health.
- U.S. Census Bureau: In 2023, there were over 850 registered sports analytics companies operating in the U.S., reflecting a rapidly expanding industry ecosystem.
- American College of Sports Medicine: Teams implementing workload analytics reduced overtraining cases by 27% compared to those without such monitoring systems.
- National Basketball Association (NBA): Tracking data from 2023 showed players with optimized workload schedules increased shooting accuracy by 3.4% across the season.
- Major League Soccer (MLS): Clubs using GPS-based analytics observed a 12% improvement in sprint recovery times over the 2022–2023 season.
- FIFA U.S. Division: Data-driven scouting approaches increased successful player acquisitions by 18% for U.S.-based teams in 2023.
- U.S. Olympic & Paralympic Committee: Implementing motion-capture analytics reduced injury rehabilitation times by 15% for elite athletes during the 2023 training cycle.
- National Football League (NFL): Teams applying AI-based play prediction improved third-down conversion rates by 5.2% in the 2023 season.
- Collegiate Sports Analytics Association: 71% of U.S. universities with varsity programs used sports analytics in at least one major athletic department in 2023.
US Sports Analytics Market: Market Dynamic
Driving Factors in the US Sports Analytics Market
Growing Demand for Performance Optimization
The increasing emphasis on maximizing player performance and reducing injury risks is a major driver of the sports analytics market. Professional teams, collegiate programs, and even amateur clubs are investing in advanced data analytics platforms to monitor biomechanics, track physical exertion, and improve tactical strategies. By integrating wearable technology, real-time video analysis, and AI-driven insights, organizations can customize training regimens, enhance in-game decision-making, and ensure sustained athlete productivity. The direct link between analytics adoption and competitive advantage is motivating continuous investment. As the sports industry becomes more data-centric, the need for precise, actionable performance insights continues to fuel widespread adoption across various disciplines and competitive levels.
Rising Commercialization and Revenue Optimization Needs
Sports organizations are increasingly using analytics to enhance revenue generation through improved ticket pricing, targeted merchandise sales, and optimized sponsorship valuation. By analyzing fan behavior, market trends, and engagement metrics, clubs and leagues can create more effective marketing strategies and maximize commercial returns. This approach extends beyond traditional sporting events, encompassing eSports, virtual tournaments, and digital fan engagement platforms. Analytics also supports media and broadcasting companies in content personalization, audience targeting, and advertisement placement, increasing overall profitability. The growing competition for consumer attention in the sports entertainment industry makes data-driven revenue optimization an essential business strategy, driving consistent adoption of advanced analytics solutions in both traditional and emerging sports sectors.
Restraints in the US Sports Analytics Market
High Implementation and Integration Costs
Despite its benefits, sports analytics adoption faces barriers due to high implementation costs. Advanced analytics platforms, wearable tracking systems, and real-time processing infrastructure require significant capital investment. Smaller clubs, community teams, and developing leagues often lack the budget to adopt cutting-edge solutions. Moreover, integrating analytics with existing systems demands skilled personnel and technical expertise, adding to operational expenses. Cloud-based solutions offer some cost relief, but data storage, licensing, and training costs remain a hurdle. For many organizations, especially in non-commercial sports, the expense of acquiring, maintaining, and upgrading analytics tools limits widespread adoption, slowing market penetration in resource-constrained segments of the industry.
Data Privacy and Security Concerns
The growing volume of sensitive player data, tactical strategies, and biometric information has heightened concerns about privacy and cybersecurity in the sports analytics sector. Breaches or unauthorized access could expose competitive strategies, leading to reputational and financial damage. With increased data sharing between teams, broadcasters, and third-party vendors, safeguarding proprietary insights is challenging. Regulatory compliance related to data protection further complicates adoption, particularly in regions with stringent privacy laws. These concerns lead some organizations to hesitate before fully embracing analytics, especially cloud-based solutions. Ensuring robust encryption, secure storage, and controlled access protocols is essential, but the risk of cyber threats remains a limiting factor for broader market growth.
Opportunities in the US Sports Analytics Market
Expansion of eSports and Virtual Sports Analytics
The rapid growth of eSports presents a significant opportunity for sports analytics providers. Competitive gaming generates vast amounts of player performance data, audience engagement metrics, and commercial insights that can be analyzed to improve gameplay strategies, audience targeting, and sponsorship valuation. Analytics platforms are being adapted to cater to the unique needs of digital sports, offering tools for in-game decision-making, audience retention, and event monetization. As eSports gains mainstream recognition and attracts investment from traditional sports organizations, the demand for tailored analytics solutions is expected to surge. This convergence of traditional and digital sports ecosystems creates new market segments with high scalability potential.
Integration of AI and Machine Learning in Sports Strategy
The application of AI and machine learning in sports analytics offers opportunities for deeper predictive insights and automation. These technologies enable advanced pattern recognition, real-time tactical adjustments, and individualized training programs. AI-powered platforms can process complex datasets rapidly, offering actionable recommendations to coaches, management, and commercial teams. As computing capabilities improve, AI models can simulate game scenarios, predict injury likelihoods, and identify untapped commercial opportunities. The scalability and adaptability of AI-driven analytics make them suitable for a wide range of sports disciplines, from grassroots to elite levels, creating growth potential across diverse sporting applications and business models.
Trends in the US Sports Analytics Market
Adoption of Wearable and IoT-Enabled Devices
Wearable technology is becoming a core element of sports analytics, enabling real-time monitoring of player health, biomechanics, and workload. Devices such as GPS trackers, heart rate monitors, and motion sensors feed data into analytics platforms, offering detailed insights for performance optimization. The integration of IoT capabilities allows seamless data transmission between athletes, coaches, and analysts, improving responsiveness and strategic adjustments during games and training. This trend is expanding beyond professional leagues, with adoption increasing among collegiate teams, academies, and even recreational athletes. As wearable technology evolves, its role in delivering accurate, actionable insights is solidifying within the sports analytics ecosystem
Shift toward Fan-Centric Digital Engagement
Sports analytics is increasingly being applied to enhance the fan experience through personalized digital content, immersive stadium features, and targeted marketing campaigns. By leveraging audience data, teams can deliver tailored offers, dynamic ticket pricing, and interactive media experiences. Virtual and augmented reality technologies are being integrated with analytics platforms to create engaging, immersive fan interactions both in-stadium and online. This shift reflects the growing need for sports organizations to compete with other entertainment options by offering unique, data-driven experiences. As fan engagement becomes a critical revenue driver, analytics will play a central role in shaping sports entertainment strategies.
US Sports Analytics Market: Research Scope and Analysis
By Component Analysis
Solutions segment is projected to dominate the US sports analytics market, accounting for 61.2% of the total share in 2025. This leadership is attributed to the widespread adoption of AI-powered platforms, real-time video analytics, and predictive modeling tools by professional leagues, collegiate teams, and broadcasters. These solutions enable performance optimization, tactical strategy enhancement, and fan engagement through automated insights. With scalability, integration capabilities, and data-driven decision-making at the forefront, organizations increasingly prefer robust software solutions over services, ensuring this segment maintains its top position.
The Services segment is anticipated to be the fastest-growing in the US sports analytics market by 2025. Growth is driven by the rising demand for specialized consulting, implementation support, and ongoing data interpretation for teams and media organizations. Services offer tailored injury prevention strategies, recruitment analytics, and fan engagement programs. The expansion of cloud-based service models, coupled with increased adoption among smaller teams, universities, and eSports entities, is accelerating this trend. The shift toward outsourcing complex analytics functions positions services as a key growth driver across the US sports ecosystem.
By Type Analysis
The On-Field Analytics segment is expected to hold the largest share of the US sports analytics market in 2025, representing 58.7% of total value. This dominance stems from the emphasis on player performance monitoring, personalized coaching, and injury risk assessment in professional and collegiate sports. On-field analytics deliver real-time data from wearables, sensors, and video feeds, enabling coaching staff to make tactical decisions during matches and training. The growing focus on maximizing athletic output while minimizing injury rates ensures continued investment in this segment.
The Off-Field Analytics segment is projected to record the fastest growth in the US sports analytics market by 2025. Its rise is fueled by the increasing importance of fan engagement, dynamic ticket pricing, sponsorship optimization, and media revenue management. Sports organizations are leveraging data to improve fan experiences, personalize marketing, and optimize merchandise sales. The digital transformation of sports entertainment, combined with heightened competition for audience attention, is driving rapid adoption of off-field analytics across leagues, media companies, and event organizers.
By Deployment Mode Analysis
The Cloud-based deployment mode is forecast to dominate the US sports analytics market by 2025, securing 66.5% of the total share. Cloud solutions offer scalability, real-time data access, and seamless integration across devices, making them ideal for distributed teams and multi-location sports organizations. The ability to store, process, and analyze vast amounts of performance and fan engagement data remotely provides a competitive advantage, accelerating preference for cloud-based analytics platforms over on-premises systems.
The On-Premises deployment mode is anticipated to witness the fastest growth in the US sports analytics market by 2025. While its share is smaller, growth is driven by heightened concerns over data privacy, proprietary strategy protection, and cybersecurity in elite sports organizations. Teams handling sensitive performance metrics and tactical playbooks prefer in-house infrastructure to maintain full control over their analytics environment. This is especially relevant in leagues with high financial stakes and intense competition.
By Sports Type Analysis
Team Sports are expected to dominate the US sports analytics market by 2025, capturing 72.8% of the total share. This is largely due to the deep integration of data analytics in football, basketball, baseball, hockey, and other team-based disciplines. Analytics help in lineup optimization, injury prevention, scouting, and fan engagement. The commercial value of team sports in the US drives consistent investment in advanced technologies to maintain performance and audience interest.
The eSports segment is projected to be the fastest-growing in the US sports analytics market by 2025. Growth is powered by the booming popularity of competitive gaming, especially in multiplayer online battle arenas, first-person shooters, and sports simulation titles. eSports teams and platforms use analytics for player performance tracking, audience behavior insights, and sponsorship valuation. The younger demographic, digital-first nature, and increasing tournament prize pools accelerate the adoption of analytics solutions in this space.
By Application Analysis
The Team & Performance Analysis application is set to lead the US sports analytics market in 2025, accounting for 54.1% of the total share. It supports tactical decision-making, player monitoring, and training optimization across professional and collegiate sports. Real-time metrics from wearables, match footage, and biomechanical data empower coaches to refine strategies and improve athlete efficiency. The high correlation between analytics-driven insights and competitive success ensures sustained investment in this application.
The Fan Engagement & Digital Experience application is anticipated to grow the fastest in the US sports analytics market by 2025. Sports organizations increasingly rely on analytics to personalize content, enhance stadium experiences, and tailor marketing campaigns. With rising competition for audience attention, leveraging data to deepen fan loyalty and boost merchandise and ticket sales is becoming a strategic priority across leagues and franchises.
By End User Analysis
Sports Teams are expected to hold the largest share of the US sports analytics market by 2025, representing 49.8% of the total value. These include professional franchises, collegiate programs, and amateur clubs that use analytics to enhance performance, improve recruitment, and reduce injury risks. Teams prioritize analytics investments to gain a competitive edge and maximize both sporting and commercial outcomes.
Sports Betting Companies are projected to be the fastest-growing end-user group in the US sports analytics market by 2025. The legalization of sports betting in multiple states, coupled with rising consumer participation, is driving demand for predictive models, player statistics, and real-time game data. Analytics enables betting platforms to set accurate odds, manage risk, and attract bettors with data-rich experiences.
The US Sports Analytics Market Report is segmented on the basis of the following:
By Component
- Video Analytics
- Big Data Analytics
- Real-time Analytics
- Smart Wearable Technology
- Others
By Type
- Athlete Performance Monitoring
- Personalized Coaching
- Health & Injury Risk Assessment
- Sports Integrity & Anti-Doping Analysis
- Fan Engagement & Experience Optimization
- Ticketing & Dynamic Pricing
- Sponsorship & Advertising Optimization
- Sports Event & Revenue Management
- Betting & Gambling Analytics
- Merchandise & Sales Analysis
By Deployment Mode
By Sports Type
- Football (Soccer)
- Cricket
- Basketball
- Baseball
- Hockey
- Rugby
- Other Team Sports
- Tennis
- Boxing
- Athletics
- Racing Other Individual Sports
- Multiplayer Online Battle Arena (MOBA)
- First-Person Shooter (FPS)
- Sports Simulation Games
- Others
By Application
- Team & Performance Analysis
- Player Valuation & Recruitment
- Fitness, Health, and Injury Prevention
- Video Breakdown & Tactics
- Fan Engagement & Digital Experience
- Data Interpretation & Visualization
- Broadcast Management & Media Optimization
- Betting Analysis
- Revenue & Merchandise Analytics
- Other Applications
By End User
- Sports Teams
- Sports Leagues & Associations
- Individual Players & Coaches
- Media & Broadcasting Organizations
- Sports Betting Companies
- Event Organizers & Sponsors
- Others
Impact of Artificial Intelligence in the US Sports Analytics Market
- Enhancing Real-Time Decision-Making: Artificial Intelligence enables instant data processing during live events, offering coaches actionable insights for tactical adjustments. By analyzing video feeds, player metrics, and opponent strategies in real time, AI empowers sports teams to make faster, more informed decisions that influence match outcomes.
- Personalizing Fan Experiences: AI-driven sports analytics tools personalize fan engagement through targeted content, predictive merchandise offers, and tailored in-stadium experiences. By learning individual preferences, these systems increase fan loyalty and spending, making personalized engagement a critical driver of commercial growth in US sports entertainment.
- Optimizing Player Health and Performance: Machine learning algorithms monitor biometric, biomechanical, and workload data to detect injury risks before they escalate. AI-driven predictive modeling allows training staff to adjust routines proactively, ensuring player longevity, improved performance levels, and reduced downtime during competitive seasons.
- Driving Commercial and Operational Efficiency: AI streamlines sports business operations by automating sponsorship valuation, ticket pricing, and revenue forecasting. By merging fan behavior analytics with operational metrics, organizations maximize profitability while maintaining competitive advantage, positioning AI as a transformative force in the US sports analytics ecosystem.
Competitive Landscape
The US sports analytics market is characterized by intense competition, with technology providers, data analytics firms, and sports organizations collaborating to deliver performance-driven solutions. Key players include IBM, SAS Institute, Catapult Sports, Hudl, Zebra Technologies, and Sportradar, each leveraging advanced analytics platforms, AI-driven tools, and machine learning capabilities to gain market prominence.
Industry leaders focus on strategic partnerships with professional leagues, collegiate programs, and media broadcasters to expand their footprint. Many are investing heavily in wearable technology, real-time video analysis systems, and cloud-based platforms that integrate seamlessly with existing sports infrastructure. These innovations enhance athlete performance tracking, fan engagement strategies, and revenue optimization models.
Innovation trends include the adoption of predictive analytics for player recruitment, biometric monitoring for injury prevention, and immersive fan experiences using augmented and virtual reality. Companies are also prioritizing cybersecurity and proprietary data protection to address growing concerns around sensitive player and tactical information.
As competition intensifies, differentiation increasingly depends on delivering customizable, scalable, and sport-specific analytics solutions. By combining data science expertise with sport-specific knowledge, market leaders are shaping the next generation of performance management and commercial growth strategies in the US sports ecosystem.
Some of the prominent players in the US Sports Analytics Market are:
- IBM
- SAP SE
- Oracle Corporation
- Catapult Sports
- Sportradar AG
- Stats Perform
- Zebra Technologies
- Hudl
- Genius Sports
- KINEXON
- SMT (SportsMEDIA Technology)
- ShotTracker
- Kitman Labs
- Second Spectrum
- Synergy Sports
- PlaySight Interactive
- Zebra MotionWorks
- TruMedia Networks
- ChyronHego
- Dartfish
- Other Key Players
Recent Developments
- In February 2025, Stats Perform unveiled an enhanced AI-driven sports data platform, integrating predictive analytics to boost real-time performance tracking and decision-making for professional US sports teams.
- In January 2025, Catapult Sports introduced a next-generation wearable tracking device in the US, offering advanced biometric data and motion analysis to optimize athlete training and reduce injury risk.
- In October 2024, IBM expanded its partnership with the US Open Tennis Championships, enhancing AI-powered match analytics, player insights, and immersive fan engagement tools for the tournament’s official digital platforms.
- In August 2024, Hudl rolled out a cloud-based analytics suite in the US, enabling coaches to access in-depth game footage, advanced metrics, and interactive reports for strategic sports performance improvement.
- In May 2024, SAP collaborated with the NBA to deploy advanced data visualization tools, providing franchises with AI-powered player performance dashboards for game preparation and tactical decision-making.
Report Details
| Report Characteristics |
| Market Size (2025) |
USD 1.7 Bn |
| Forecast Value (2034) |
USD 8.6 Bn |
| CAGR (2025–2034) |
20.1% |
| Historical Data |
2019 – 2023 |
| Forecast Data |
2026 – 2034 |
| Base Year |
2024 |
| Estimate Year |
2025 |
| Report Coverage |
Market Revenue Estimation, Market Dynamics, Competitive Landscape, Growth Factors, etc. |
| Segments Covered |
By Component (Solutions, Services), By Type (On-Field Analytics, Off-Field Analytics), By Deployment Mode (Cloud-based, On-Premises), By Sports Type (Team Sports, Individual Sports, eSports), By Application (Team & Performance Analysis, Player Valuation & Recruitment, Fitness, Health, and Injury Prevention, Video Breakdown & Tactics, Fan Engagement & Digital Experience, Data Interpretation & Visualization, Broadcast Management & Media Optimization, Betting Analysis, Revenue & Merchandise Analytics, Other Applications), By End User (Sports Teams, Sports Leagues & Associations, Individual Players & Coaches, Media & Broadcasting Organizations, Sports Betting Companies, Event Organizers & Sponsors, Others) |
| Regional Coverage |
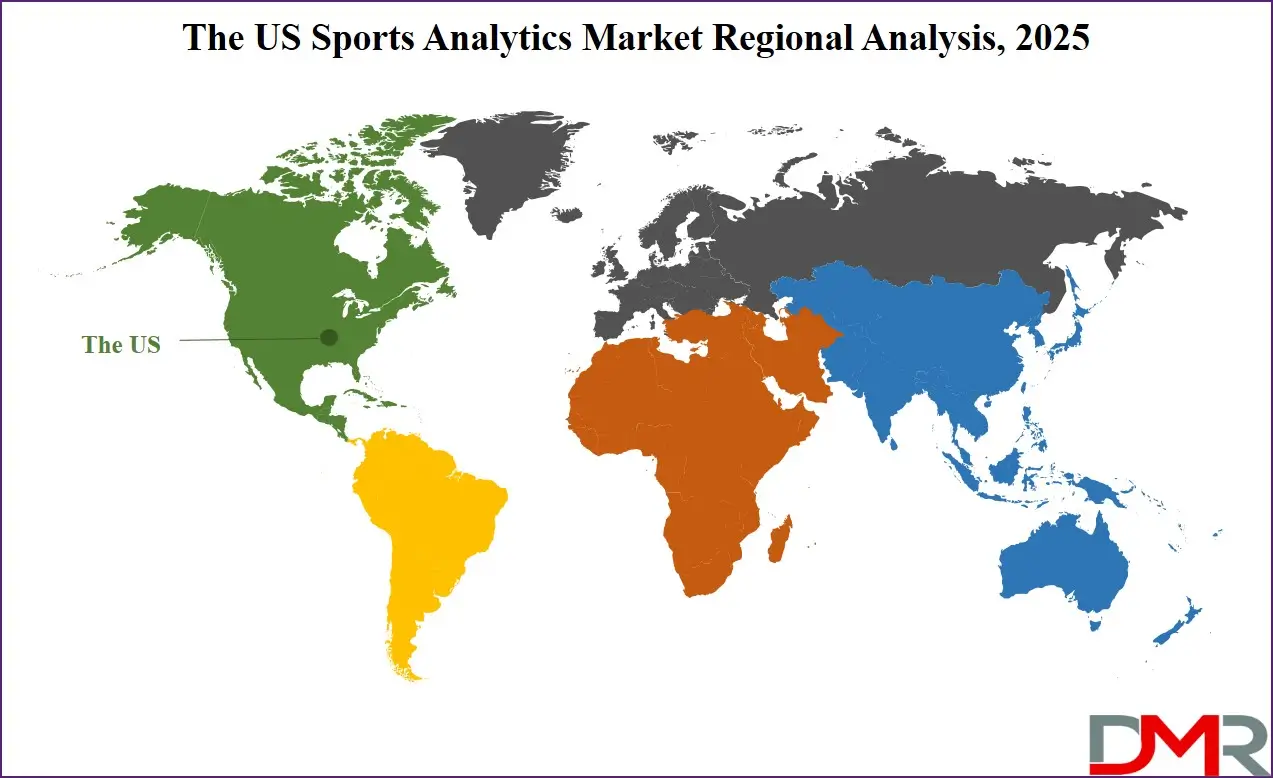
The US |
| Prominent Players |
IBM, SAP SE, Oracle Corporation, Catapult Sports, Sportradar AG, Stats Perform, Zebra Technologies, Hudl, Genius Sports, KINEXON, SMT (SportsMEDIA Technology), ShotTracker, Kitman Labs, Second Spectrum, Synergy Sports, PlaySight Interactive, Zebra MotionWorks, TruMedia Networks, ChyronHego, Dartfish, and Other Key Players |
| Purchase Options |
We have three licenses to opt for: Single User License (Limited to 1 user), Multi-User License (Up to 5 Users), and Corporate Use License (Unlimited User) along with free report customization equivalent to 0 analyst working days, 3 analysts working days, and 5 analysts working days respectively. |
Frequently Asked Questions
The US Sports Analytics Market size is estimated to have a value of USD 1.7 billion in 2025 and is expected to reach USD 8.6 billion by the end of 2034.
Some of the major key players in the US Sports Analytics Market are IBM, SAP SE, Oracle Corporation, and many others.
The market is growing at a CAGR of 20.1% over the forecasted period.