US Transmission Line Monitoring Market Snapshot
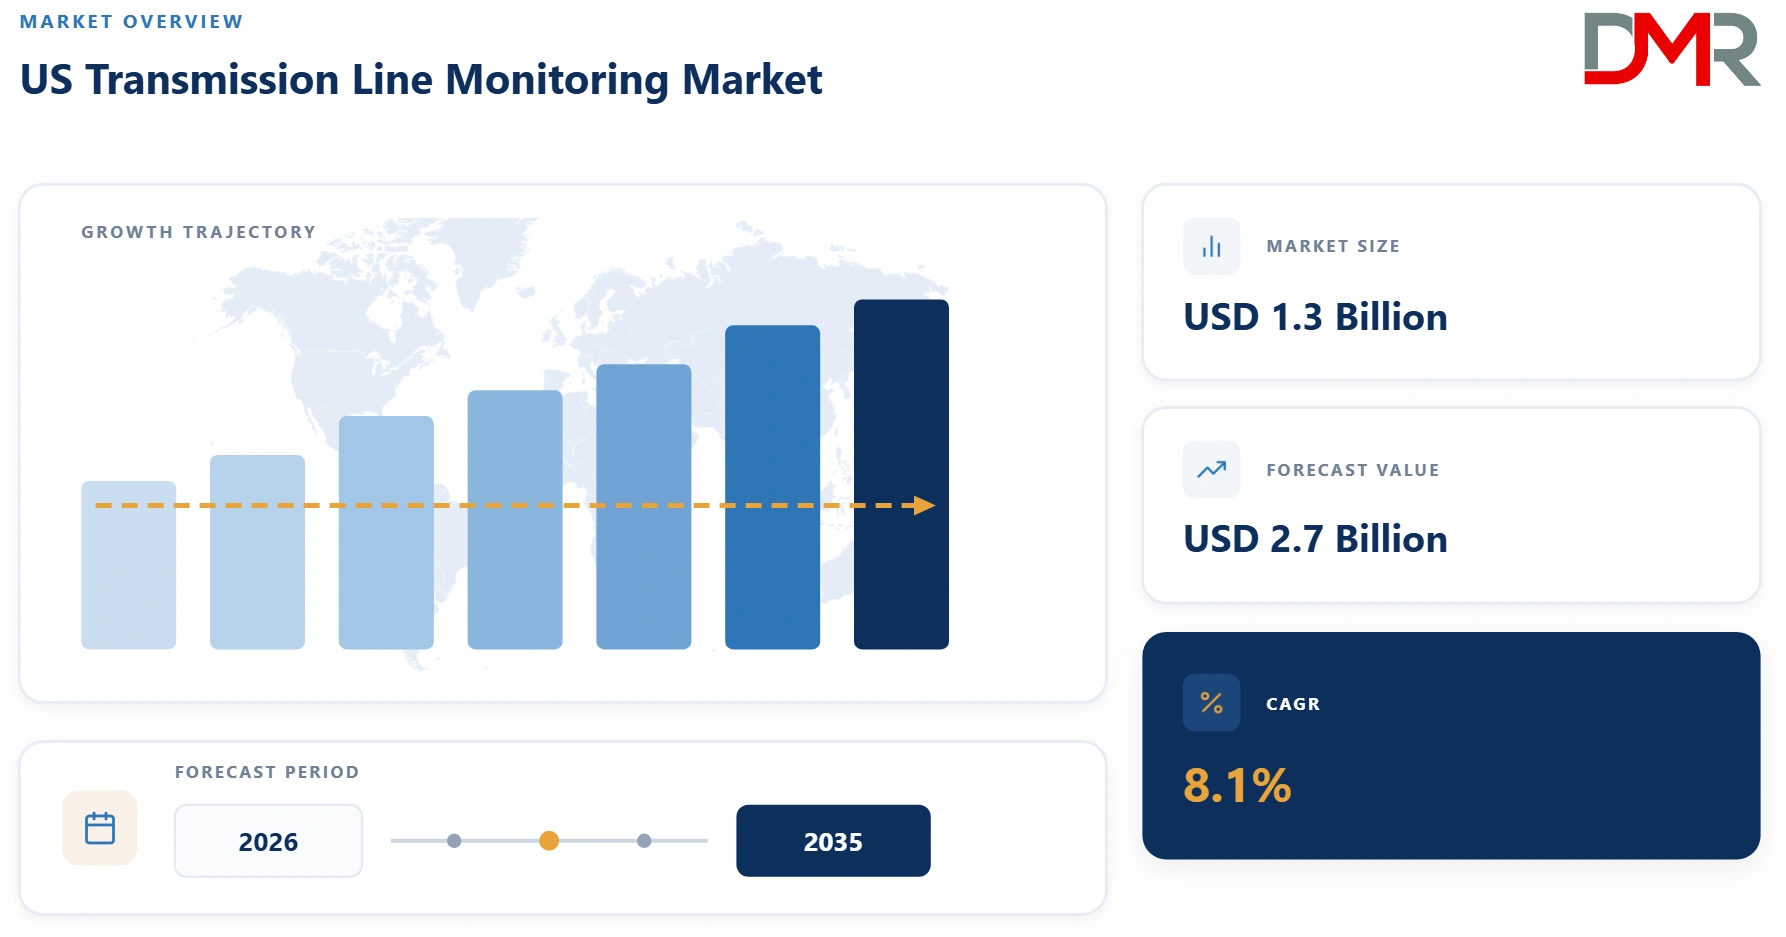
- Market Size in 2026: USD 1.3 billion
- Market Size in 2035: USD 2.7 billion
- CAGR, 2026–2035: 8.1%
- Leading Component Segment, 2026: Hardware, 68.0%
- Leading Monitoring Type, 2026: Condition Monitoring, 44.5%
- Leading Technology, 2026: Sensor-Based Monitoring, 40.5%
- Fastest-Growing Segment: Fiber Optic Monitoring, 12.8% CAGR
What is the US Transmission Line Monitoring and its Market Size?
The U.S. transmission line monitoring market is estimated at USD 1.3 billion in 2026 and is projected to reach approximately USD 2.7 billion by 2035, representing an estimated 8.1% CAGR.
ℹ
To learn more about this report –
Download Your Free Sample Report Here
The US Transmission Line Monitoring market encompasses technologies, equipment, software and professional services used to continuously or periodically assess the electrical, thermal, mechanical and environmental condition of high-voltage transmission lines. Solutions include conductor-temperature and sag sensors, vibration monitors, weather stations, fiber-optic sensing, LiDAR, thermal imaging, UAV/drone inspection, fault-location systems, dynamic line-rating platforms and analytics software. The core value proposition is to give utilities greater visibility into transmission assets so they can increase usable capacity, identify emerging failures, improve maintenance scheduling, reduce outages and safely integrate additional electricity without relying exclusively on expensive new transmission construction. DLR, for example, calculates line capacity using real-time environmental and conductor conditions rather than conservative static assumptions.
Use Cases
- Dynamic line rating: Continuously calculates available transmission capacity using conductor, weather and environmental conditions.
- Condition monitoring: Detects conductor heating, sag, vibration, icing and mechanical degradation before failures occur.
- Fault detection and localization: Identifies abnormal electrical conditions and helps operators locate faults more rapidly.
- Vegetation and right-of-way monitoring: Uses drones, LiDAR and imagery to identify clearance violations and wildfire hazards.
- Predictive maintenance: Combines sensor data and analytics to prioritize maintenance based on asset health and failure probability.
- Grid planning: Provides operational data that supports congestion management, reconductoring decisions and transmission investment planning.
Key Takeaways
- Market Size: U.S. transmission line monitoring is estimated at USD 1.3 billion in 2026, reaching USD 2.7 billion by 2035.
- Growth Rate: The market is forecast to expand at approximately 8.1% CAGR.
- Primary Drivers: Grid modernization, aging infrastructure, electrification, renewable integration, data-center demand and extreme-weather resilience.
- Dominant Segment: Hardware remains the largest component, while condition monitoring is the leading monitoring application.
- Fastest Growth: Fiber-optic monitoring is expected to grow fastest as utilities leverage existing communications infrastructure for distributed sensing.
- Strategic Shift: U.S. utilities are moving from inspection-centric models toward real-time visibility, predictive analytics and grid-enhancing technologies.
- DLR Opportunity: DLR is becoming strategically important because it can increase utilization of existing lines without the lead times associated with major reconductoring or new transmission projects.
How AI, IoT and Advanced Sensing are Transforming the US Transmission Line Monitoring Market?
AI, IoT and advanced sensing are converting transmission corridors from periodically inspected assets into continuously observable infrastructure. IoT sensors measure conductor temperature, sag, current, vibration, weather and other parameters, while LiDAR, thermal cameras, UAVs and fiber-optic systems capture structural and environmental information. Analytics platforms then combine these datasets with weather forecasts, GIS information and historical asset behavior. Siemens Energy, for example, describes its line-digitalization approach as combining real-time monitoring, DLR, ambient-adjusted ratings, diagnostics and predictive analytics.
The resulting benefits include earlier fault detection, better maintenance prioritization, increased line utilization and reduced inspection costs. AI-assisted image analysis can automate identification of vegetation, damaged components and thermal anomalies, while DLR software can calculate additional safe capacity. Competitive differentiation is therefore moving away from individual sensors toward integrated hardware-software ecosystems, cybersecurity, EMS/SCADA integration, predictive analytics and actionable operational intelligence.
Key Drivers in the US Transmission Line Monitoring Market
Aging Transmission Infrastructure and Grid Reliability
The aging U.S. transmission network is creating sustained demand for advanced monitoring solutions. Many transmission assets have been operating for decades, increasing the need for continuous visibility into conductor condition, temperature, sag, vibration, mechanical stress, and other indicators of asset health. Traditional periodic inspection methods can identify visible defects but may not provide sufficient real-time information for proactive maintenance. Transmission monitoring enables utilities to identify abnormal conditions earlier, prioritize maintenance based on asset risk, and reduce the likelihood of unexpected failures. The growing emphasis on grid resilience and reliability is further encouraging utilities to adopt sensors, drones, fiber-optic systems, thermal imaging, and analytics platforms.
Rising Electricity Demand and Transmission Congestion
Rapid growth in electricity consumption is increasing pressure on existing transmission infrastructure. Data centers, artificial intelligence applications, domestic manufacturing, transportation electrification, and new generation projects are creating concentrated demand for additional transmission capacity. At the same time, constructing new transmission lines can involve lengthy permitting, planning, right-of-way, and construction processes. This is increasing interest in monitoring technologies that allow utilities to safely optimize existing infrastructure. Dynamic Line Rating is particularly important because it uses real-time or forecast weather and operating conditions to determine the available capacity of transmission lines.
Restraints in the US Transmission Line Monitoring Market
High Integration and Cybersecurity Requirements
Transmission line monitoring systems must operate within highly complex utility environments that include SCADA, EMS, asset-management platforms, communications networks, protection systems, and control-room applications. Integrating new monitoring technologies into these environments can require extensive engineering, testing, cybersecurity assessments, and interoperability validation. Utilities are particularly cautious when monitoring information may influence operational decisions because inaccurate or unreliable data could affect system reliability. Cybersecurity is another important consideration as more monitoring equipment becomes connected to utility networks and cloud-based analytics platforms.
High Initial Investment and Technology Fragmentation
The market includes numerous technologies designed to address different transmission-line conditions, including conductor sensors, weather stations, fiber-optic monitoring, UAVs, LiDAR, thermal imaging, fault-location systems, and analytics software. Because these technologies do not always perform the same function, utilities may need multiple solutions to establish comprehensive monitoring coverage. Installation, communications infrastructure, integration, maintenance, and software costs can further increase the overall investment required. Smaller utilities may face additional budget and technical-resource constraints. Technology fragmentation can also make it difficult to compare solutions because vendors use different measurement methodologies and performance indicators.
Growth Opportunities in the US Transmission Line Monitoring Market
Dynamic Line Rating and Grid-Enhancing Technologies
Dynamic Line Rating represents one of the strongest growth opportunities in the US Transmission Line Monitoring Market because it connects monitoring directly with transmission capacity optimization. DLR uses real-time or forecast environmental conditions, including wind, ambient temperature, solar heating, and precipitation, to determine how much power a transmission line can safely carry. This approach can help utilities use existing infrastructure more effectively while reducing congestion and supporting additional generation connections. Federal agencies are increasingly emphasizing grid-enhancing technologies as tools for addressing transmission constraints.
AI, Fiber Optics, UAVs and Integrated Monitoring Platforms
Another major opportunity is the integration of multiple monitoring technologies into unified asset-intelligence platforms. Fiber-optic sensing can provide continuous information across transmission corridors, while UAVs and LiDAR can collect high-resolution visual and spatial data. Thermal imaging can identify abnormal heating, while AI-based analytics can automatically analyze imagery and sensor information to identify potential defects or maintenance requirements. Combining these technologies can allow utilities to create more comprehensive digital representations of transmission assets. The opportunity is particularly strong where utilities already possess communications infrastructure that can support additional sensing capabilities.
Trends in the US Transmission Line Monitoring Market
Shift Toward Continuous and Predictive Monitoring
The US Transmission Line Monitoring Market is moving from periodic inspection toward continuous condition monitoring and predictive maintenance. Utilities increasingly want real-time information about conductor temperature, sag, vibration, weather conditions, structural integrity, vegetation, and other risk factors. This shift allows maintenance teams to prioritize assets based on actual operating conditions rather than fixed inspection schedules. AI and analytics are further improving this model by identifying patterns that may indicate future failures. The transition is also encouraging vendors to develop integrated solutions combining sensors, communications, analytics, and maintenance-management capabilities.
Monitoring as a Transmission Capacity Optimization Tool
Transmission monitoring is increasingly being used not only for asset protection but also for maximizing grid capacity. Dynamic and variable line-rating technologies can adjust operating limits according to changing environmental conditions, helping utilities better utilize existing transmission corridors. This trend is becoming particularly important as electricity demand rises and transmission expansion faces planning and permitting constraints. DOE identifies grid-enhancing technologies such as DLR as tools for improving existing grid performance, while FERC has examined approaches for improving the use of dynamic line ratings.
Research Scope and Analysis
The market is segmented by Component, Monitoring Type, Technology, Line Type and End User. The estimates distinguish equipment from software/services and emphasize the growing role of DLR, fiber sensing, aerial inspection, AI analytics and utility-led grid modernization.
ℹ
To learn more about this report –
Download Your Free Sample Report Here
By Component Analysis
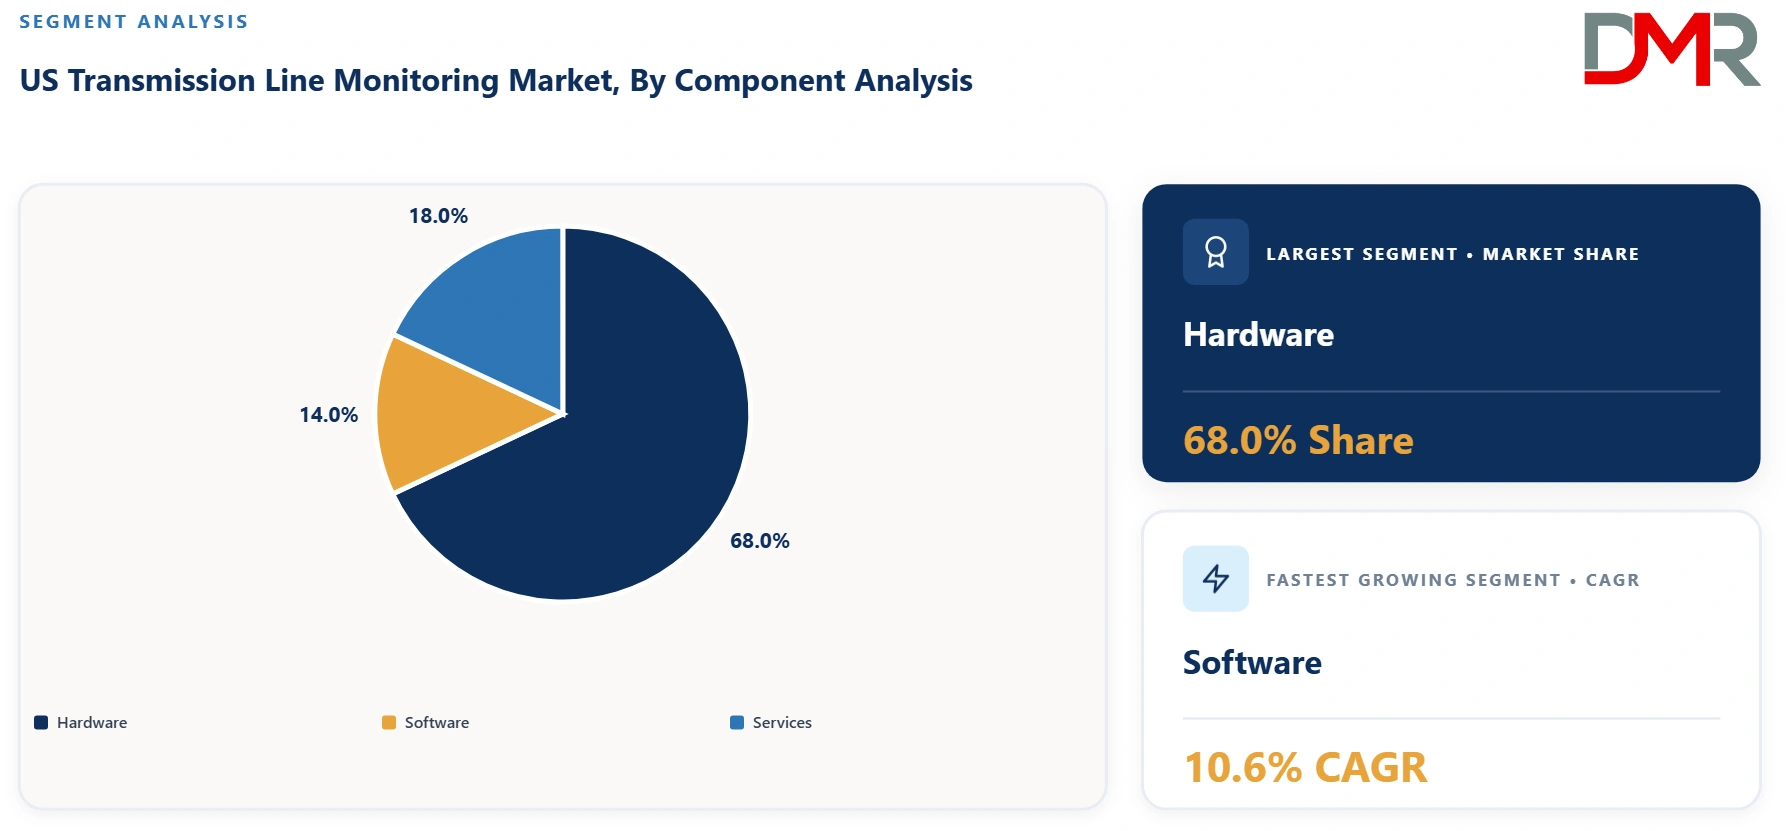
Hardware is estimated to dominate the U.S. transmission line monitoring market in 2026 with approximately 68.0% share, reflecting the continued requirement for sensors, communication equipment, monitoring devices, weather stations and inspection hardware. Hardware remains foundational because software platforms require reliable field measurements before they can generate operational recommendations. Services represent the second-largest category at an estimated 18.0% share, encompassing installation, integration, inspection, maintenance and professional engineering support. Software accounts for approximately 14.0% but is forecast to be the fastest-growing component at roughly 10.6% CAGR, driven by AI analytics, digital twins, predictive maintenance and integration with EMS/SCADA environments. Software growth is supported by utilities seeking recurring, data-driven capabilities rather than isolated hardware purchases. The increasing use of DLR illustrates this transition: monitoring systems increasingly combine physical sensors with automated rating calculations and operational software rather than functioning as standalone measurement devices.
By Monitoring Type Analysis
Condition Monitoring is expected to remain the largest monitoring category, holding approximately 44.5% share in 2026. Its leadership reflects utilities' focus on detecting conductor heating, sag, vibration, icing, mechanical degradation and other conditions that affect reliability. Dynamic Line Rating follows at approximately 34.0%, but it is projected to be the fastest-growing monitoring type at around 12.2% CAGR, supported by congestion, rising demand and federal emphasis on accurate transmission ratings. Fault Detection & Localization accounts for roughly 21.5% and remains essential for reducing outage duration and improving restoration. DLR's growth is particularly significant because it directly connects monitoring with transmission capacity: FERC has identified the ability of weather-informed ratings to provide a more accurate representation of transfer capability.
By Technology Analysis
Sensor-Based Monitoring leads with an estimated 40.5% market share in 2026, supported by conductor-temperature, current, sag, vibration and environmental sensors that provide direct field measurements. Fiber Optic Monitoring is projected to be the fastest-growing technology at approximately 12.8% CAGR, as utilities seek wide-area monitoring using existing optical infrastructure and distributed sensing. PG&E's trial with Prisma Photonics demonstrates the U.S. market's movement toward leveraging existing utility fiber to monitor transmission corridors without installing conventional equipment directly on power lines. UAV/Drone-Based Monitoring represents the second-largest technology category at about 21.0%, supported by lower inspection costs and AI-assisted imagery. LiDAR and thermal imaging collectively account for the remainder and are increasingly integrated into multi-modal inspection programs.
By Line Type Analysis
Overhead Transmission Lines dominate the U.S. market with approximately 84.0% share in 2026, reflecting the extensive installed base of overhead high-voltage infrastructure and the broad applicability of DLR, LiDAR, UAV, weather and conductor monitoring technologies. Overhead lines are particularly suitable for DLR because conductor temperature, sag, wind and solar heating can be directly observed or modeled. Underground Transmission Lines, representing approximately 16.0%, are forecast to grow faster at around 9.4% CAGR as utilities expand underground infrastructure in urban areas and locations with severe environmental or right-of-way constraints. Monitoring underground assets requires different approaches, including distributed temperature sensing, partial-discharge monitoring, fiber-optic sensing and cable-health analytics. Growth in underground monitoring will therefore be driven more by asset-health requirements than by DLR.
By End User Analysis
Transmission Utilities represent the largest end-user category, with an estimated 52.0% share in 2026, because investor-owned and public transmission utilities own large networks and carry primary responsibility for reliability, maintenance and regulatory compliance. Grid Operators account for approximately 29.0%, with demand focused on real-time line visibility, congestion management, rating calculations and integration with control-room systems. Independent Power Producers hold around 19.0%, primarily where transmission constraints affect generation interconnection, renewable-energy delivery and project economics. Grid operators are expected to record the fastest growth at approximately 9.1% CAGR, reflecting increasing reliance on real-time operational information. DLR adoption demonstrates this shift: successful deployments provide both asset-health data and operational capacity information that can influence dispatch, congestion management and investment planning.
The US Transmission Line Monitoring Market Report is segmented on the basis of the following:
By Component
- Hardware
- Software
- Services
By Monitoring Type
- Condition Monitoring
- Dynamic Line Rating
- Fault Detection & Localization
By Technology
- Sensor-Based Monitoring
- Fiber Optic Monitoring
- UAV/Drone-Based Monitoring
- LiDAR
- Thermal Imaging
By Line Type
- Overhead Transmission Lines
- Underground Transmission Lines
By End User
- Transmission Utilities
- Grid Operators
- Independent Power Producers
Regulatory Landscape
The U.S. regulatory environment is a major market catalyst because transmission monitoring increasingly intersects with line-rating accuracy, reliability and transmission planning. FERC Order No. 881 established ambient-adjusted line-rating requirements, while subsequent FERC proceedings have examined broader DLR implementation incorporating solar and wind conditions. Order No. 1920 also strengthens long-term transmission planning, increasing the value of technologies capable of extracting more capacity from existing infrastructure. The regulatory opportunity is strongest for DLR, advanced rating software and monitoring platforms capable of demonstrating measurement accuracy and operational integration. The primary risk is implementation complexity: utilities must reconcile new technologies with established reliability, cybersecurity, tariff and control-room requirements. Vendors that provide compliance-ready platforms, auditable measurements and integration with existing operational systems should be better positioned than hardware-only providers.
Investment and White Space Analysis
The largest investment white space lies between conventional periodic inspection and fully digital, network-wide monitoring. Many utilities have deployed isolated pilots but have not yet equipped entire transmission portfolios with continuous sensing. DLR offers a particularly attractive investment proposition where congestion is high and reconductoring or new transmission would require substantial capital and time. AES's U.S. experience showed a DLR project achieving substantial capacity improvements while costing a fraction of reconductoring on a studied line. Additional white space exists in fiber-optic monitoring, wildfire risk analytics, AI-assisted drone inspection and integrated asset-health platforms. The key investment risk is fragmented procurement and long utility sales cycles. Vendors can mitigate this through outcome-based pricing, subscription software, rapid-installation systems and pilots tied to measurable capacity, outage or maintenance savings..
Competitive Landscape
The U.S. transmission line monitoring market is moderately fragmented but increasingly consolidating around integrated grid-digitalization platforms. Competition includes large electrical-equipment and automation companies such as General Electric Vernova, Siemens Energy and Hitachi Energy, alongside specialist companies such as LineVision, Heimdall Power and Prisma Photonics. Differentiation increasingly depends on measurement accuracy, DLR algorithms, AI capabilities, sensor installation requirements, cybersecurity, NERC/FERC compatibility, communications infrastructure and integration with utility EMS/SCADA systems. Siemens Energy, for example, now positions line digitalization around integrated monitoring, DLR, diagnostics and predictive analytics.
Some of the prominent players in the US Transmission Line Monitoring Market are:
- LineVision
- Heimdall Power
- Ampacimon
- Lindsey Systems
- Southwire
- Atecnum
- EDM International
- Franklin Electric
- GridSense
- General Electric
- ABB
- Siemens
- Hitachi Energy
- Schneider Electric
- Eaton
- GE Vernova
- Schweitzer Engineering Laboratories
- Hubbell
- S&C Electric Company
- Qualitrol
- Vaisala
- OSI
- Power Factors
- Sentient Science
- WindSim
- Sensornet
- OFS
- Torino Power Solutions
- SmartKable
- USI
- Pike Engineering
- MicroTronics
- LAKI Power
- Gridwell
- AEMC Instruments
- Apogee Instruments
- Campbell Scientific
- Vaisala Energy
- Trimble
- DJI
- Other Key Players
Recent Developments
- December 2025: Prisma Photonics announced a PG&E trial using existing utility fiber to monitor roughly 80 miles of transmission lines, demonstrating growing interest in non-contact, distributed fiber sensing.
- December 2025: PG&E began an 18-month transmission-monitoring demonstration involving Heimdall Power and Prisma Photonics, evaluating DLR, asset-health monitoring and fiber-based monitoring across challenging California corridors.
- October 2025: Heimdall Power and Puget Sound Energy launched a major U.S. DLR project involving 75 Neuron sensors across 100 miles of transmission lines, representing one of the largest U.S. sensor deployments of its kind.
- March 2025: LineVision and Duquesne Light announced expansion of DLR across seven additional transmission lines, building on previous deployments that had demonstrated capacity increases of up to 25%.
- January 2025: LineVision and NV Energy announced deployment of 29 sensors across approximately 90 miles of transmission lines around Reno, using DLR to address congestion and improve transmission capacity under a DOE-supported grid-enhancement project.
Report Details
| Report Characteristics |
| Market Size (2026) |
USD 1.3 Bn |
| Forecast Value (2035) |
USD 2.7 Bn |
| CAGR (2026–2035) |
8.1% |
| Historical Data |
2021 – 2025 |
| Forecast Data |
2026 – 2035 |
| Base Year |
2025 |
| Segments Covered |
By Component, By Monitoring Type, By Technology, By Line Type, By End User |
| Country Coverage |
The US |
Frequently Asked Questions
What is the market size of the US Transmission Line Monitoring Market in 2026?
▾ The US Transmission Line Monitoring Market is estimated at USD 1.3 billion in 2026, covering hardware, software, analytics, integration, and monitoring services.
What will be the size of the US Transmission Line Monitoring Market by 2035?
▾ The US Transmission Line Monitoring Market is projected to reach approximately USD 2.7 billion by 2035, supported by grid modernization and rising electricity demand.
What is the CAGR of the US Transmission Line Monitoring Market from 2026 to 2035?
▾ The US Transmission Line Monitoring Market is expected to expand at approximately 8.1% CAGR from 2026 to 2035.
What are the key drivers of the US Transmission Line Monitoring Market?
▾ Aging transmission infrastructure, increasing electricity demand, renewable integration, grid congestion, extreme weather, wildfire risks, and regulatory requirements are key growth drivers.
Which segment dominates the US Transmission Line Monitoring Market?
▾ Condition Monitoring is the leading monitoring segment, accounting for an estimated 44.5% share of the US Transmission Line Monitoring Market in 2026.
Which is the fastest-growing segment in the US Transmission Line Monitoring Market?
▾ Fiber Optic Monitoring is projected to be the fastest-growing technology segment, with an estimated 12.8% CAGR during the forecast period.
Who are the key players in the US Transmission Line Monitoring Market?
▾ Major participants include GE Vernova, Siemens Energy, Hitachi Energy, LineVision, Heimdall Power, Prisma Photonics, and PLP, alongside specialized monitoring providers.
Why is DLR important to the US Transmission Line Monitoring Market?
▾ Dynamic Line Rating enables utilities to calculate available transmission capacity using real-time environmental and conductor conditions, improving utilization of existing infrastructure.