Market Overview
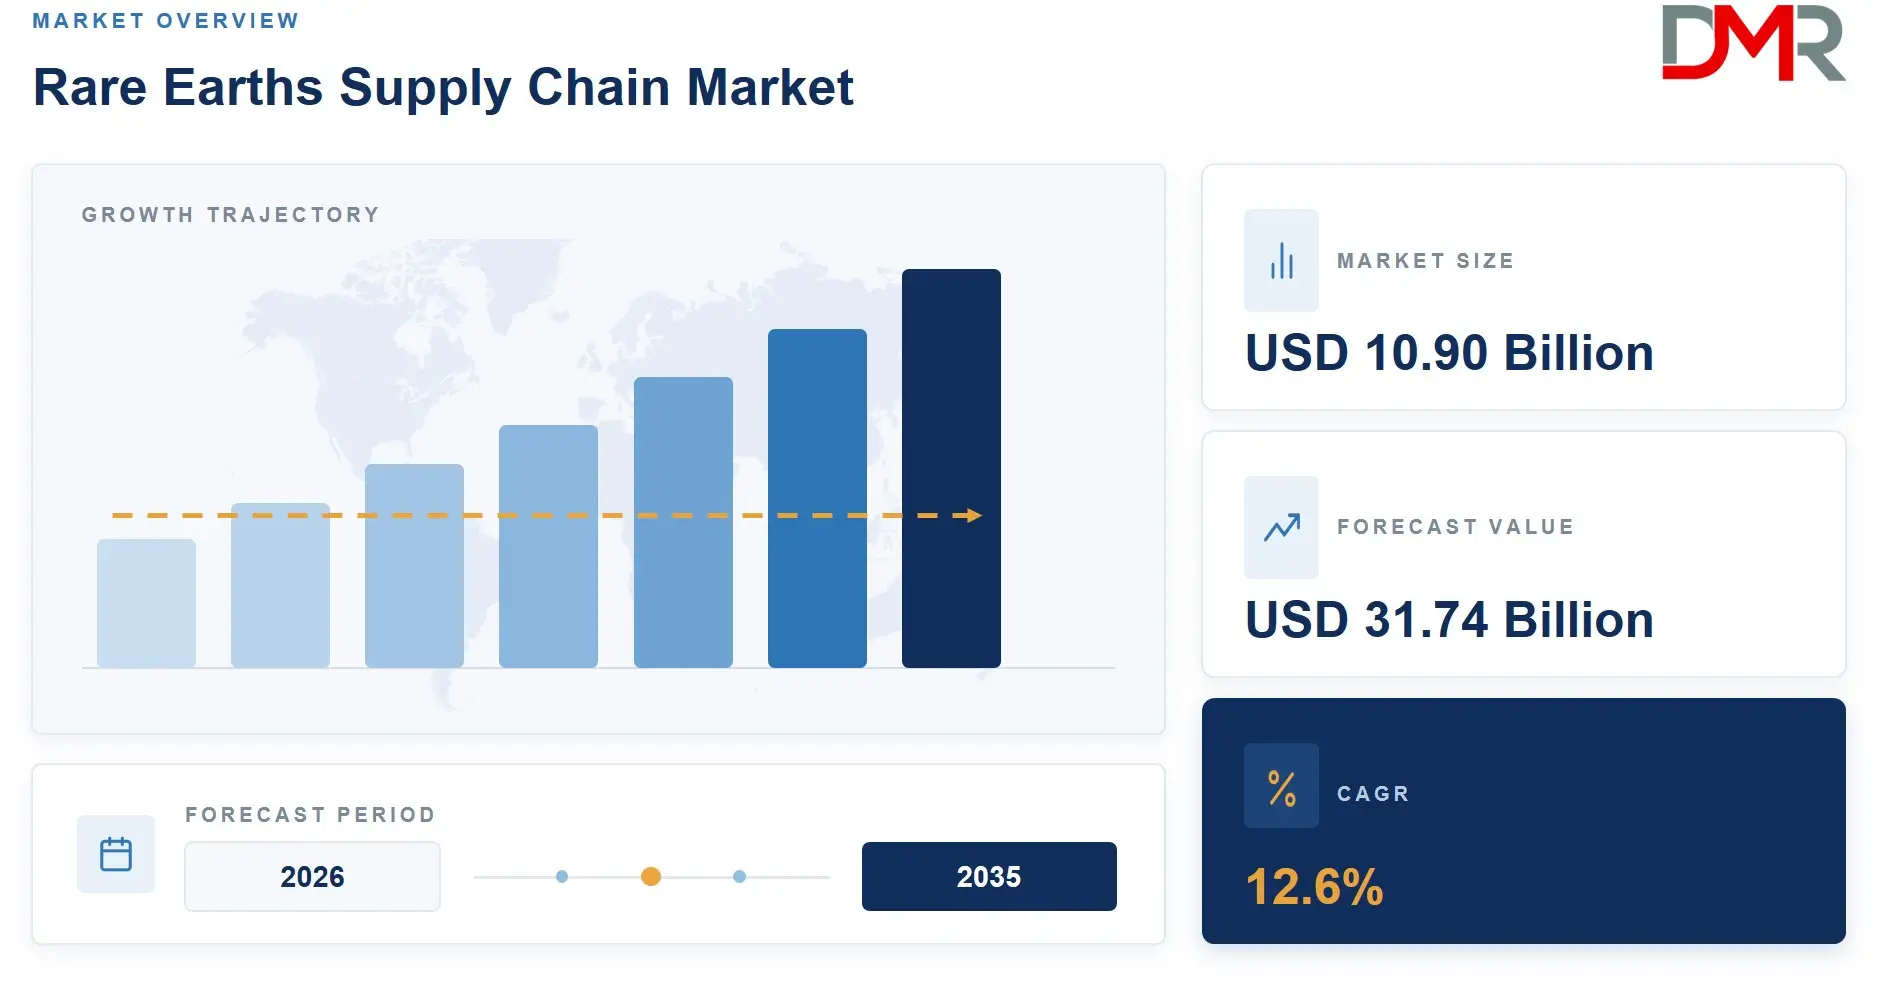
The Global Rare Earths Supply Chain Market size is estimated at USD 10.90 Billion in 2026, and is projected to reach USD 31.74 Billion by 2035, exhibiting a CAGR of 12.6% during the forecast period.
As reported by the USGS Mineral Commodity Summaries 2026, global rare-earth mine production totaled an estimated 390,000 metric tons of rare-earth-oxide equivalent in 2025. Output at that scale confirms that physical supply is no longer the primary constraint. The real bottleneck is separation and processing capacity, which remains overwhelmingly concentrated inside China and cannot be replicated quickly regardless of how much mining investment flows into allied nations.
The forecast reflects a structural break from historical demand patterns driven by EV motors, offshore wind turbines, and defense electronics all scaling simultaneously. The Critical Minerals Supply Chain is now a national security priority across NATO and Indo-Pacific allied governments, which converts political commitments into funded project pipelines that support the 12.6% CAGR through 2035. A downside scenario exists only if EV adoption stalls below consensus forecasts or if China lifts export controls, neither of which current policy trajectories support.
The market covers the full chain from mine output through separation, metals conversion, permanent magnet manufacturing, and recycling. It excludes downstream OEM assembly and finished consumer goods. Rare earths sit inside the broader Rare Earth Elements critical materials ecosystem but occupy the upstream and midstream positions where value capture is highest and geopolitical risk is most acute. AI-driven demand forecasting tools now allow magnet manufacturers to optimize NdPr purchasing against spot and futures price signals, reducing working capital tied up in precautionary stockpiles.
ℹ
To learn more about this report –
Download Your Free Sample Report Here
Key Takeaways
- The market size is USD 10.90 Billion in 2026, and is projected to hit USD 31.74 Billion by 2035 at a CAGR of 12.6%.
- By Value-Chain Stage: Separation & Refining led with a 42.00% share in 2026.
- By Material Family: Light Rare Earths led with a 72.10% share in 2026.
- By Downstream Demand: Electric Vehicles led with a 40.80% share in 2026.
- By Supply Route: Domestic Integrated Supply led with a 81.20% share in 2026.
- By Region: Asia Pacific led with a 87.1% share in 2026.
- Top key players: China Northern Rare Earth Group, China Rare Earth Group, Lynas Rare Earths, MP Materials, Shenghe Resources.
Separation & Refining Analysis
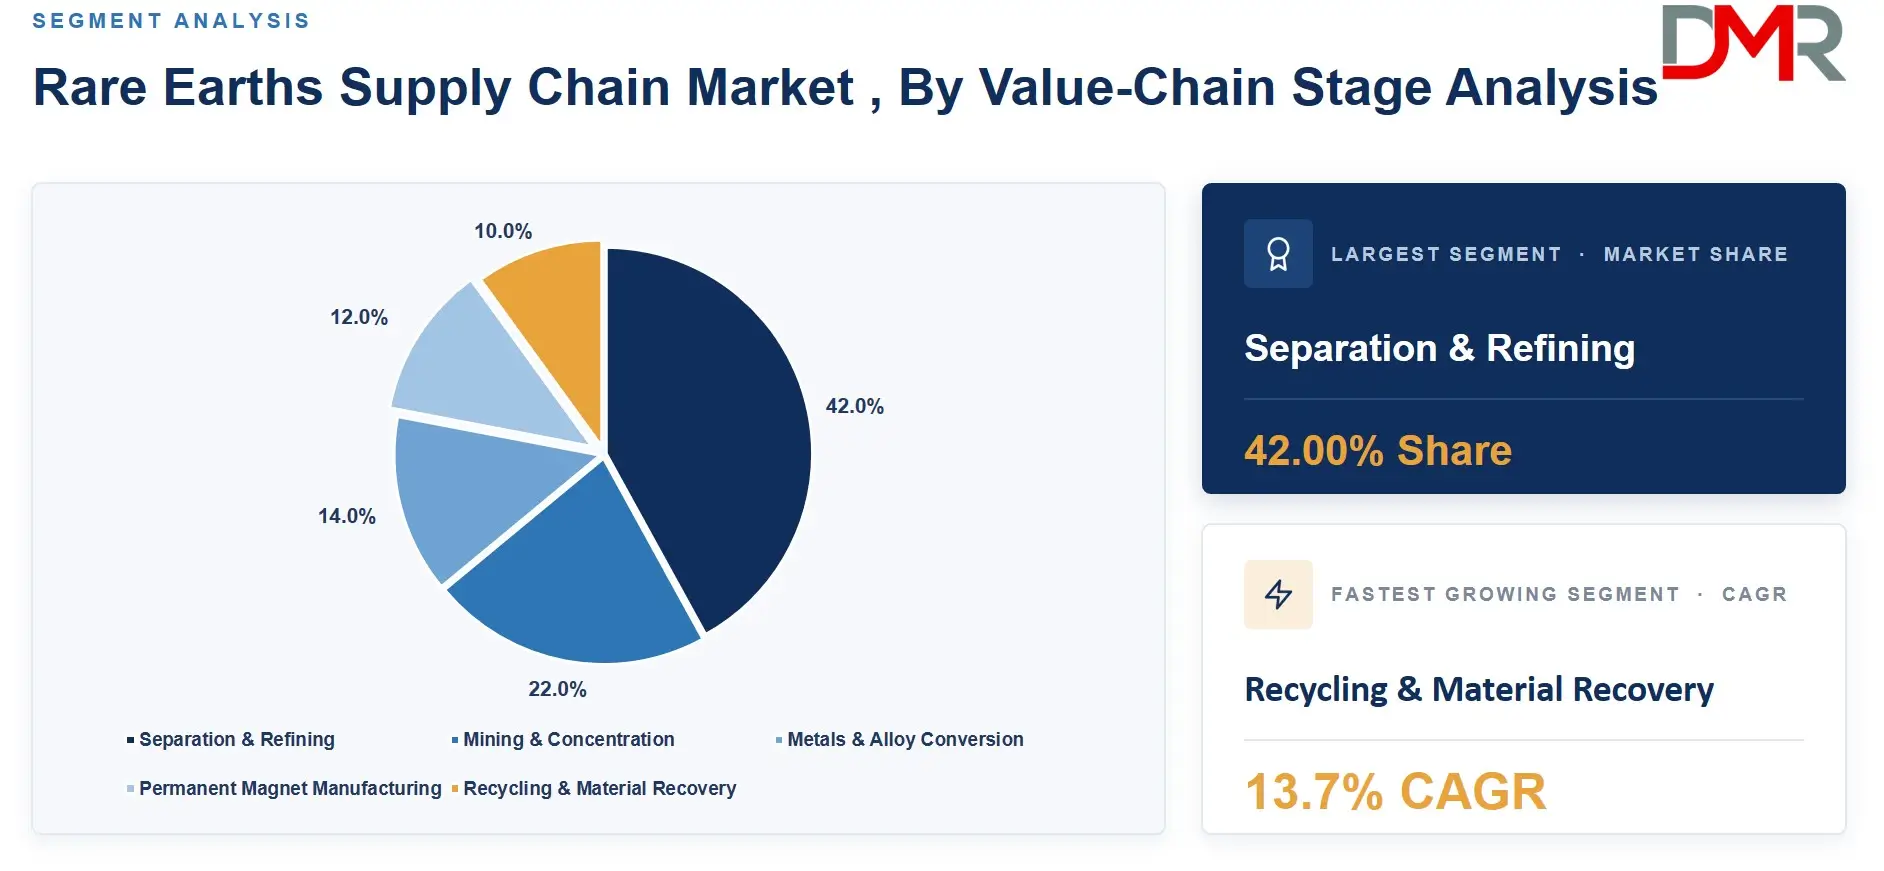
Separation & Refining led the Value-Chain Stage segment with a 42.00% share in 2026.
Separation and refining commands the largest value-chain share because it is where commodity ore converts into specification-grade oxides that OEMs and magnet makers actually buy. Producers who control this stage set pricing, quality standards, and delivery timelines for the entire downstream. China's near-monopoly on separation capacity is precisely why this stage carries the highest margin and the highest geopolitical risk premium simultaneously. Rare Earth Elements processing at scale outside China remains the central unsolved problem for allied defense and clean energy supply chains.
Mining and Concentration generates the ore stream but captures lower margin per unit because concentrate is a commodity that buyers can source from multiple geographies. Metals and Alloy Conversion and Permanent Magnet Manufacturing hold the highest technical barriers but depend entirely on a reliable oxide feedstock from separation. Recycling and Material Recovery is the fastest-growing stage as OEM commitments to closed-loop sourcing translate into funded recovery programs, particularly for NdFeB magnets from spent EV drivetrains and decommissioned wind turbines.
ℹ
To learn more about this report –
Download Your Free Sample Report Here
Light Rare Earths Analysis
With a 72.10% share in 2026, Light Rare Earths outpaced all other Material Family categories.
Light rare earths dominate material demand because neodymium and praseodymium, the primary inputs for NdFeB permanent magnets, sit within this classification. EV traction motors and wind turbine generators consume NdPr at volumes that no substitute technology currently matches at commercial scale. Semiconductor Materials overlap with rare earth demand at the lanthanum and cerium end of the light spectrum, used in polishing slurries and phosphors, but the NdPr magnet pull is the volume driver that defines the segment's dominance.
Heavy Rare Earths is the fastest-growing material family despite its small base, because dysprosium and terbium additions to NdFeB magnets are mandatory in high-temperature applications such as EV motors running above 150°C and offshore wind generator windings. Magnet Rare Earths as a classification sits across both families, reflecting how magnet alloy formulations blend NdPr from the light side with Dy and Tb from the heavy side. Buyers who secure heavy rare earth supply build a structural cost and performance advantage over rivals dependent on spot markets.
Electric Vehicles Analysis
Electric Vehicles accounted for 40.80% of Downstream Demand in 2026, the highest of any category.
EV traction motors are the single largest pull on rare earth demand because each motor requires between 1 and 2 kilograms of NdFeB magnet material. Fleet electrification targets across the EU, China, and the United States commit to vehicle volumes that structurally outpace any Western rare earth separation capacity buildout currently funded or permitted. EV demand is also the fastest-growing downstream category, compounding pressure on the NdPr oxide supply chain every quarter that OEM production ramp continues.
Wind Energy consumes dysprosium and terbium at scale for high-temperature direct-drive turbine generators, making it the second most strategically significant downstream segment. Electronics demand is large in absolute tonnage but grows more slowly as device miniaturization reduces per-unit rare earth content. Aerospace and Defense sits at lower volumes but commands the highest quality premiums and longest qualification cycles, insulating that demand slice from price competition. Industrial Motors and Automation represent a stable recurring demand base, with efficiency mandates in Europe and China gradually increasing rare earth content per unit.
Domestic Integrated Supply Analysis
Domestic Integrated Supply captured 81.20% of the Supply Route segment in 2026, ahead of all rivals.
Domestic integrated supply dominance reflects China's vertically integrated rare earth sector, where state-controlled producers mine, separate, convert, and manufacture magnets within a single national system. That integration gives Chinese producers structural cost and speed advantages that purely commercial cross-border supply chains cannot match. Buyers outside China who rely on cross-border imports face quota risk, export licensing delays, and the pricing leverage that supply concentration creates.
Cross-Border Imports remain a critical supply route for non-Chinese OEMs lacking domestic processing capacity. Recycled Supply is the fastest-growing route as government-backed programs in the U.S., Japan, and Europe fund rare earth recovery from end-of-life products. Strategic Stockpiles and Government Procurement occupy a small share today but are growing as defense ministries in NATO nations shift from reliance on open-market sourcing to state-managed reserve programs designed for supply interruption scenarios.
Key Market Segments
By Value-Chain Stage
- Separation & Refining
- Mining & Concentration
- Metals & Alloy Conversion
- Permanent Magnet Manufacturing
- Recycling & Material Recovery
By Material Family
- Light Rare Earths
- Heavy Rare Earths
- Magnet Rare Earths
By Downstream Demand
- Electric Vehicles
- Wind Energy
- Electronics
- Aerospace & Defense
- Industrial Motors & Automation
- Other Applications
By Supply Route
- Domestic Integrated Supply
- Cross-Border Imports
- Recycled Supply
- Strategic Stockpiles & Government Procurement
Regional Analysis
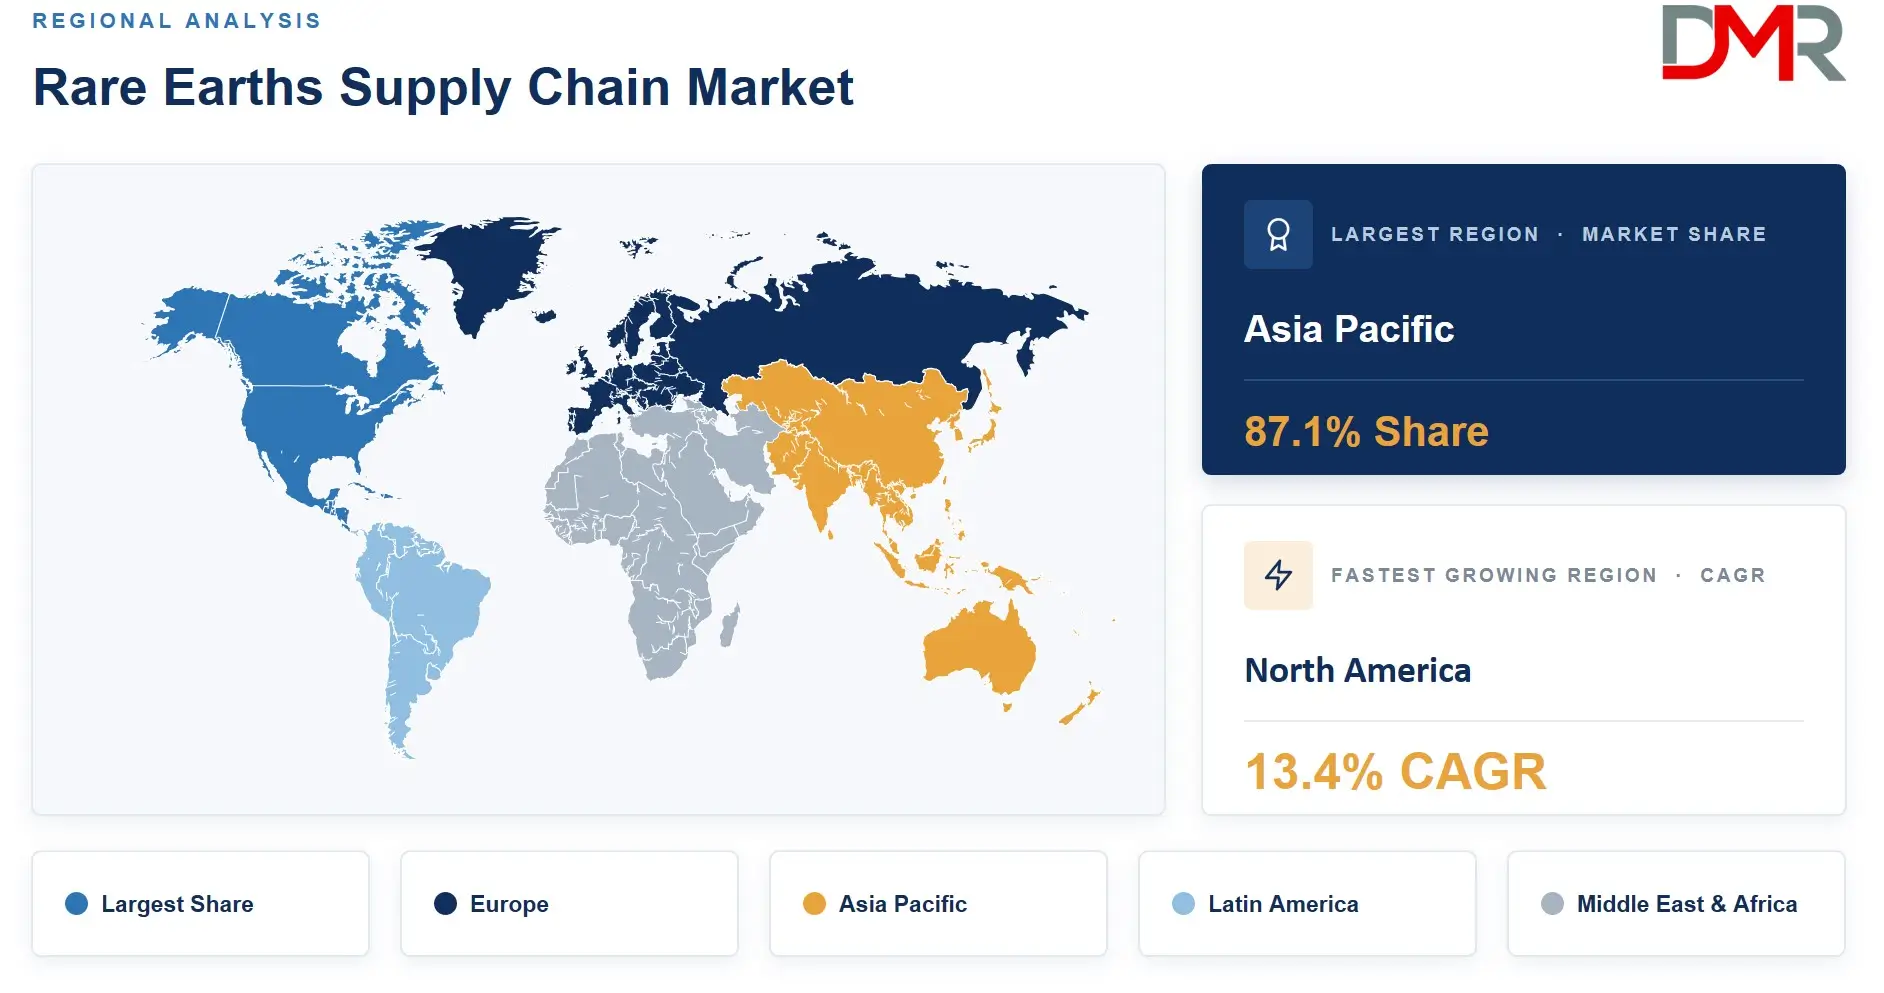
Asia Pacific led the Rare Earths Supply Chain Market with a 87.1% share in 2026, reflecting the region's near-total dominance of global separation, processing, and magnet manufacturing capacity.
Asia Pacific
China's 2025 mine output of 270,000 metric tons REO equivalent, against global production of 390,000 metric tons, means the country controls roughly 69% of global mined supply before its processing monopoly is even accounted for. As reported by the USGS Mineral Commodity Summaries 2026, Australia contributed 29,000 metric tons and Burma 22,000 metric tons in 2025, but both countries export ore or concentrate that largely feeds Chinese separation capacity rather than building independent processing supply chains. Japan, South Korea, and India sit within the Asia Pacific region as midstream buyers, not primary producers, which means the region's 87.1% share reflects Chinese structural control rather than distributed Asian supply.
North America
North America is the fastest-growing region as U.S. government financing and defense policy restructure domestic capacity. As reported by the USGS Mineral Commodity Summaries 2026, U.S. production of rare-earth compounds and metals reached an estimated 8,900 metric tons REO equivalent in 2025, while apparent consumption stood at 27,000 metric tons, with net import reliance at 67%. A workforce base of just 670 mine-and-mill workers in 2025 shows how early the U.S. domestic industry remains relative to its stated ambitions, but funded project pipelines signal that output will scale materially before 2030.
ℹ
To learn more about this report –
Download Your Free Sample Report Here
Europe
European producers hold no significant mining base but are building midstream processing capacity under the EU Critical Raw Materials Act. Estonia hosts a Silmet facility with rare earth separation capability, and France's La Rochelle facility operates as one of the few separation assets outside China. European demand is driven by EV and wind turbine OEMs who face supply chain compliance pressure from the EU Battery Regulation and Carbon Border Adjustment Mechanism, pushing procurement teams toward traceable, non-Chinese sourced materials ahead of regulatory enforcement dates.
Latin America, Middle East & Africa
Brazil holds the world's second-largest rare earth reserves but has not yet built separation capacity at commercial scale. Saudi Arabia's engagement with rare earth refinery development through its sovereign miner signals a long-term intent to insert the Gulf into the midstream supply chain. South Africa holds monazite-bearing mineral sand deposits but rare earth extraction from those streams remains at a pre-commercial stage across the region.
Key Regions and Countries
North America
Europe
- Germany
- France
- The UK
- Spain
- Italy
- Rest of Europe
Asia Pacific
- China
- Japan
- South Korea
- India
- Australia
- Rest of APAC
Latin America
- Brazil
- Mexico
- Rest of Latin America
Middle East & Africa
- GCC
- South Africa
- Rest of MEA
Macroeconomic Impact
Interest rate cycles affect rare earth project financing differently from other commodities because greenfield rare earth mines carry 10-to-15-year permitting timelines in Western jurisdictions. High real interest rates raise the hurdle rate for long-duration capital deployment, which means private project developers in the U.S., Canada, and Australia depend heavily on government loan guarantees and offtake agreements rather than commercial debt markets to progress projects through the development pipeline.
Currency movements create asymmetric cost structures across the supply chain. Australian producers export ore or concentrate priced in USD but carry Australian-dollar operating costs, generating natural margin expansion when the USD strengthens. Chinese producers dominate processing and benefit when the renminbi weakens relative to the currencies of their export customers, compressing the cost competitiveness of Western separation projects attempting to price against Chinese oxide benchmarks.
Market Dynamics
Driver: EV Magnet Demand Outpaces Western Separation Capacity
NdFeB permanent magnets for EV traction motors are the primary volume driver pulling rare earth demand beyond what non-Chinese separation capacity can supply. As confirmed by MP Materials' own production disclosures, NdPr oxide output at Mountain Pass reached 917 metric tons in Q1 2026, up 63% from 563 metric tons in Q1 2025, which shows the pace of ex-China capacity ramp but also the absolute scale gap against OEM procurement targets. Quarterly NdPr production of below 1,000 metric tons from the sole U.S. separation facility measures the supply deficit against EV programs that collectively require tens of thousands of metric tons annually.
In Q2 2026, MP Materials produced 840 metric tons of NdPr, up 41% from Q2 2025, confirming that output gains are real but variable quarter to quarter depending on circuit optimization. Figures from MP Materials' Q2 2026 results show that concentrate production fell 16% in the same quarter, reflecting the operational tradeoffs between maximizing concentrate throughput and prioritizing separated oxide yield. OEMs watching those production swings are simultaneously funding backup supply agreements rather than relying on a single non-Chinese source.
In April 2025, Solvay inaugurated its new production line at the La Rochelle facility in France, expanding the commercial supply of magnet-grade light rare earth materials and announcing plans to scale into dysprosium and terbium for high-temperature magnet applications. European magnet manufacturers now have a traceable, EU-domiciled oxide source for the first time at commercial scale, reducing procurement risk ahead of EU supply chain due diligence regulations taking effect.
Restraint: China's Processing Monopoly Cannot Be Bypassed by Mining Alone
Western governments and investors consistently conflate mine diversification with supply chain security, but separation technology concentration creates a structural chokepoint that new mines do not resolve. As reported by the USGS Mineral Commodity Summaries 2026, U.S. apparent consumption of rare-earth compounds and metals was an estimated 27,000 metric tons REO equivalent in 2025, against domestic production of 8,900 metric tons, leaving net import reliance at 67%. A country with 51,000 metric tons of mine output but only 8,900 metric tons of processed output is exporting ore and reimporting finished compounds, which describes the current U.S. supply chain structure precisely.
The United States imported approximately 21,000 metric tons of rare-earth compounds and 1,100 tons of ferrocerium alloys in 2025, as reported by USGS, which means processed material import dependency persists even as Mountain Pass mine output grows. Environmental permitting for greenfield rare earth processing facilities in the U.S. and Canada routinely runs 10 to 15 years, meaning separation capacity investments committed today will not deliver commercial output before 2035 at the earliest under a standard regulatory timeline.
Opportunity: Recycling and Allied Nation Processing Close the Supply Gap
MP Materials' NdPr sales reached 1,006 metric tons in Q1 2026, up 117% from 464 metric tons in Q1 2025, as reported by MP Materials. Sales growth outpacing production growth at that rate reflects both inventory drawdown and accumulated customer qualification work paying off simultaneously. The commercial pipeline building behind Western separation output is the signal that buyers are committing long-term offtake rather than treating non-Chinese supply as a spot-market alternative.
Urban mining from spent EV batteries, wind turbine magnets, and hard drives offers a geopolitically neutral secondary supply route where neodymium recovery rates currently average below 5%, creating a white space for closed-loop recycling operators. In August 2025, American Rare Earths confirmed that ore from its Halleck Creek project in Wyoming processed into high-purity concentrates reaching up to 97.1% REO grade for a Department of Defense-linked agency, demonstrating that U.S. domestic ore streams can meet specification requirements for defense-grade processing. Green Steel and clean energy infrastructure buildouts further extend rare earth demand into industrial motor and generator segments, widening the total addressable market beyond EV and wind forecasts.
Porter's Five Forces
Competitive intensity across the rare earths supply chain is shaped by a supplier power asymmetry that overrides all other forces. China's control over separation and processing translates into supplier bargaining power that no single buyer or allied government policy has yet neutralized. As reported by the USGS Mineral Commodity Summaries 2026, U.S. heavy-rare-earth compound imports totaled an estimated 100 metric tons REO equivalent in 2025 against net import reliance of 100%, confirming that for heavy rare earths specifically, buyers have no credible alternative supplier base and therefore no pricing leverage. The threat of new entrants is structurally low at the processing stage due to capital intensity and permitting timelines, but moderate at the mining stage where junior explorers backed by government grants continue to advance projects. Buyer power is limited for OEM end-users because rare earth magnets have no volume-scale substitute in EV motors or wind turbines, removing the standard threat-of-switching check on supplier pricing. Competitive rivalry among Western producers is moderate and collaborative rather than purely competitive, as most ex-China producers are too small to meet OEM volumes alone and are building consortium and offtake structures to aggregate supply.
AI and Gen AI Impact
Artificial intelligence is reshaping rare earth supply chain management at the demand forecasting and logistics optimization layers before it reaches primary extraction. Magnet manufacturers use machine learning models to correlate EV production schedules with NdPr oxide procurement timing, reducing the overstocking cycles that historically pushed oxide prices below production cost during demand troughs. Generative AI tools now accelerate geological data interpretation for exploration projects, compressing the time from drilling data to resource estimate by months at advanced rare earth projects in Australia and North America.
Processing operations benefit from AI-driven solvent extraction circuit optimization, where real-time sensor data feeds predictive control models that reduce reagent consumption and increase separated oxide purity consistency. Early movers who deploy these systems at separation facilities hold a cost-per-kilogram advantage over facilities running manual or rule-based process controls. Laggards risk losing OEM qualification contracts as buyers increasingly require production traceability and quality consistency documentation that AI-monitored processes can generate automatically.
Market Trends
Geopolitical Classification Reshapes Rare Earth Investment Logic
China's export restrictions on rare earth processing technology and finished magnets have reclassified rare earths from industrial commodities into national security assets across NATO and Indo-Pacific allied governments. Battery Materials and rare earth magnet supply chains now attract state-backed co-financing through instruments like Japan's JOGMEC and Australia's Critical Minerals Facility, displacing purely commercial investment logic at the project level. Rare earth-free motor technology using ferrite and switched reluctance alternatives is receiving OEM R&D investment as a long-term hedge, but no alternative reaches NdFeB performance density at commercial cost within the forecast window.
Market Competition Overview
The rare earths supply chain market is structurally consolidated at the processing stage and fragmented at the mining stage. Chinese state-controlled groups hold dominant share across separation, metals conversion, and magnet manufacturing, competing against each other on volume and customer allocation rather than price. Outside China, a small number of producers are scaling rapidly from near-zero bases. As reported by Lynas' March 2026 quarterly results, Lynas produced 3,233 tonnes of total REO and 1,996 tonnes of NdPr in that quarter, with REO sales reaching 3,691 tonnes, making it the largest non-Chinese rare earth producer by separated output.
In March 2026, Lynas Rare Earths produced its first batch of samarium oxide at its expanded Malaysia facility ahead of schedule, becoming the only commercial producer of separated heavy rare earth oxides outside China. Lynas reported a company-wide rolling 12-month lost-time injury frequency rate of 1.3 per million hours worked at end of March 2026, reflecting operational maturity that OEM customers in regulated industries use as a supplier qualification criterion alongside pure output metrics. The competitive gap between the top two or three Western producers and the dozens of junior explorers remains wide, and market consolidation through government-supported M&A is likely before 2030.
Pricing Analysis
Rare earth oxide prices in 2025 showed a clear differentiation between light and heavy materials. As reported by the USGS Mineral Commodity Summaries 2026, average 2025 prices were $69 per kilogram for 99%-minimum NdPr oxide, $74/kg for praseodymium oxide, and $73/kg for neodymium oxide. Heavy rare earth oxides commanded multiples of those prices, with terbium oxide averaging $1,010/kg and dysprosium oxide averaging $239/kg in the same period, reflecting the near-total supply concentration in Chinese hands.
MP Materials' U.S. government price-protection agreement, operational from October 1, 2025, covered the difference between market pricing and a benchmark of $110 per kilogram of NdPr, generating $51.0 million of price-protection income in Q4 2025 alone, as reported by MP Materials. That agreement structure reveals the gap between Chinese-benchmarked spot prices and the price required to sustain viable U.S. separation economics, confirming that non-Chinese separation capacity requires structural subsidy or offtake guarantees to compete on cost against integrated Chinese producers.
Company Profiles
MP Materials operates Mountain Pass in California, the only rare earth mining and separation facility in the United States at commercial scale, positioning the company as the primary beneficiary of U.S. government rare earth policy instruments. As reported by MP Materials' investor disclosures, the company produced 50,692 metric tons of REO in concentrate during 2025 and 2,599 metric tons of separated NdPr oxide, while selling 1,994 metric tons of NdPr oxide in the same year. The gap between 2,599 metric tons produced and 1,994 metric tons sold reflects qualification and inventory buildup as downstream magnet customers complete technical audits before committing to long-term purchase agreements. In Q4 2025, the company produced 12,080 metric tons of REO concentrate and 718 metric tons of NdPr oxide, demonstrating consistent quarterly separated output at a scale no other U.S. operator currently matches.
Lynas Rare Earths holds the most strategically differentiated position outside China, operating a mining operation at Mount Weld in Australia and a separation facility in Malaysia that constitutes the only large-scale rare earth separation plant outside China currently in commercial production. During the quarter ended June 30, 2025, Lynas produced 3,212 tonnes of total REO, including 2,080 tonnes of NdPr, marking the first quarter in which its NdPr output exceeded 2,000 tonnes, as confirmed by Lynas quarterly disclosures. The Malaysia facility's expansion into samarium oxide separation further extends Lynas's midstream footprint into heavy rare earth territory where its competitive advantage is unique outside China.
Key Players
- China Northern Rare Earth Group
- China Rare Earth Group
- Lynas Rare Earths
- MP Materials
- Shenghe Resources
- Iluka Resources
- Arafura Rare Earths
- IREL (India) Limited
- Neo Performance Materials
- Solvay
- Energy Fuels
- JL MAG Rare-Earth
- VACUUMSCHMELZE GmbH
- Shin-Etsu Chemical Co., Ltd.
- TDK Corporation
- Proterial, Ltd.
- Australian Strategic Materials Ltd
- Hastings Technology Metals Limited
- USA Rare Earth
- Niron Magnetics
Supply Chain and Value Chain Analysis
The rare earths value chain flows from ore extraction through concentration, solvent-extraction separation, metals conversion, alloy production, magnet sintering, and final OEM assembly. Maximum value accrues at the separation stage, where commodity concentrate converts into specification oxides priced at 5 to 10 times the concentrate value per kilogram. As reported by MP Materials' Q2 2026 results, REO-concentrate production reached 11,072 metric tons in Q2 2026, down 16% from Q2 2025, showing how operational decisions at a single facility ripple through downstream oxide availability for buyers dependent on that source.
The biggest bottleneck sits between concentrate production and separated oxide output. China controls the solvent extraction knowhow, specialized reagent supply, and trained engineering workforce required to build and operate separation circuits at scale. Western recyclers attempting to feed secondary material back into the separation stage face the same technical barriers as primary processors, meaning that recycling scale-up depends on solving the same processing technology gap that constrains primary supply diversification.
Regulatory Landscape
U.S. regulatory action in 2025 combined loan financing with procurement mandates under the Defense Production Act, creating a funded policy framework that integrates supply development with national security requirements. The U.S. DOE announced up to $134 million in December 2025 for a full-scale integrated rare-earth extraction, separation, and refining demonstration facility, as confirmed by DOE Critical Minerals and Energy Innovation announcements. That investment signals a government commitment to proving commercial-scale U.S. separation technology before committing larger capital to commercial-scale facilities.
India's rare-earth permanent-magnet manufacturing scheme, approved in 2025, carries a total outlay of ₹7,280 crore, including ₹6,450 crore in sales-linked incentives and a ₹750 crore capital subsidy, as reported by PIB India. The sales-linked incentive structure rewards production volume rather than capacity installation, which avoids the subsidy trap of paying for idle facilities and aligns government payments with demonstrated market supply. EU supply chain due diligence regulations and the Critical Raw Materials Act set procurement thresholds that European magnet buyers must meet by 2030, creating a compliance deadline that converts policy targets into binding procurement mandates for OEMs.
Investment and White Space Analysis
U.S. government investment in 2025 targeted the heavy rare earth segment specifically because it represents the most complete supply dependency. As reported by the USGS Mineral Commodity Summaries 2026, the U.S. Department of War provided a $150 million loan for heavy-rare-earth separation, an $80 million loan to one recycler, and a $5.1 million award to another recycler for rare earth recovery. Concentrating capital in heavy rare earth separation and recycling reflects a deliberate strategy to address the 100% net import reliance for those materials rather than simply expanding light rare earth output where partial domestic production already exists.
White space opportunities are clearest in heavy rare earth processing outside China, closed-loop magnet recycling from EV and wind decommissioning streams, and allied-nation processing capacity under bilateral defense supply agreements. Canada, Australia, Estonia, and Japan each hold partial capabilities that bilateral co-investment could combine into integrated ex-China processing chains. Deep-sea nodule programs in Pacific exclusive economic zones represent a long-duration strategic reserve play, but commercial extraction economics and environmental permitting timelines push those programs beyond the current forecast window for investable near-term positions.
Recent Developments
- November 2025: USA Rare Earth, Inc. completed its acquisition of UK-based Less Common Metals Ltd. for $100 million in cash and 6.74 million common shares, forming an integrated mine-to-magnet supply chain spanning U.S. ore and UK specialty metals processing.
- November 2025: Saudi Arabia's Ma'aden signed a binding term sheet with MP Materials and the U.S. Department of War to establish a strategic rare earth refinery joint venture in Saudi Arabia, marking the first state-level rare earth processing commitment from the Gulf region under a bilateral U.S. defense framework.
- July 2025: Apple committed $500 million in a partnership with MP Materials to expand its Texas factory and launch a recycling line in California, targeting 100% recycled rare earth magnets for Apple products and anchoring the first OEM-funded closed-loop magnet supply chain in the United States.
- December 2025: India officially approved a ₹7,280 crore Scheme to Promote Manufacturing of Sintered Rare Earth Permanent Magnets to build a 6,000 MTPA integrated domestic ecosystem, with the majority of the outlay structured as sales-linked incentives rather than capacity grants.
- January 2026: USA Rare Earth entered a non-binding Letter of Intent with the U.S. Department of Commerce's CHIPS Program for $1.6 billion in total funding, comprising $277 million in federal funding and a $1.3 billion secured loan, paired with a $1.5 billion private equity raise, representing the largest single-project rare earth financing commitment in U.S. history.
Report Details
| Report Characteristics |
| Market Value (2026) |
USD 10.90 Billion |
| Forecast Revenue (2035) |
USD 31.74 Billion |
| CAGR (2026–2035) |
12.6% |
| Base Year for Estimation |
2025 |
| Historic Period |
2020 – 2024 |
| Forecast Period |
2026 – 2035 |
| Report Coverage |
Revenue Forecast, Market Dynamics, Competitive Landscape, Recent Developments |
| Segments Covered |
By Value-Chain Stage (Separation & Refining, Mining & Concentration, Metals & Alloy Conversion, Permanent Magnet Manufacturing, Recycling & Material Recovery), By Material Family (Light Rare Earths, Heavy Rare Earths, Magnet Rare Earths), By Downstream Demand (Electric Vehicles, Wind Energy, Electronics, Aerospace & Defense, Industrial Motors & Automation, Other Applications), By Supply Route (Domestic Integrated Supply, Cross-Border Imports, Recycled Supply, Strategic Stockpiles & Government Procurement) |
| Regional Analysis |
North America – US and Canada; Europe – Germany, France, The UK, Spain, Italy, and Rest of Europe; Asia Pacific – China, Japan, South Korea, India, Australia, and Rest of APAC; Latin America – Brazil, Mexico, and Rest of Latin America; Middle East & Africa – GCC, South Africa, and Rest of MEA |
| Competitive Landscape |
China Northern Rare Earth Group, China Rare Earth Group, Lynas Rare Earths, MP Materials, Shenghe Resources, Iluka Resources, Arafura Rare Earths, IREL (India) Limited, Neo Performance Materials, Solvay, Energy Fuels, JL MAG Rare-Earth, VACUUMSCHMELZE GmbH, Shin-Etsu Chemical Co., Ltd., TDK Corporation, Proterial Ltd., Australian Strategic Materials Ltd, Hastings Technology Metals Limited, USA Rare Earth, Niron Magnetics |
| Customization Scope |
Customization for segments and region or country level will be provided. Additional customization can be done based on requirements. |
| Purchase Options |
Three license options: Single User License, Multi-User License (Up to 5 Users), and Corporate Use License (Unlimited Users and Printable PDF) |
Frequently Asked Questions
What is the biggest investment opportunity in the Rare Earths Supply Chain market?
▾ Heavy rare earth separation capacity outside China holds the clearest investment gap, with U.S. net import reliance for heavy rare earth compounds at 100% in 2025. Government-backed financing through the Defense Production Act and DOE loan programs reduces the capital risk for first movers building separation facilities before the market consolidates around two or three credible non-Chinese suppliers.
Who are the top companies in the Rare Earths Supply Chain market?
▾ China Northern Rare Earth Group, China Rare Earth Group, Lynas Rare Earths, MP Materials, and Shenghe Resources represent the top five players by production scale and strategic positioning. Lynas and MP Materials hold the largest ex-China processing footprints and are the primary beneficiaries of Western government procurement and financing programs.
Which segment is growing fastest in the Rare Earths Supply Chain market and why?
▾ Recycling and Material Recovery is the fastest-growing value-chain stage, and Heavy Rare Earths is the fastest-growing material family. Recycled Supply is the fastest-growing supply route. All three reflect the same underlying driver: OEMs and governments are funding closed-loop and secondary supply as a geopolitical hedge against Chinese export controls that constrain primary material availability.
Which region is growing fastest in the Rare Earths Supply Chain market and why?
▾ North America is the fastest-growing region, driven by U.S. government financing, Defense Production Act mandates, and a funded project pipeline that did not exist at scale before 2023. The region's growth rate reflects a near-zero starting base for domestic separation capacity against escalating defense and clean energy procurement demand that OEMs can no longer source purely from Chinese suppliers.
What is the biggest challenge holding the Rare Earths Supply Chain market back?
▾ China's control of over 85% of global rare earth separation capacity is the structural constraint that mine diversification alone cannot solve. Environmental permitting timelines of 10 to 15 years for greenfield processing facilities in Western jurisdictions mean that capacity investments committed today will not deliver commercial output within the primary demand window that EV and wind buildout programs define.