Market Snapshot
- Market Size (2026): USD 58.4 Bn
- Forecast Value (2035): USD 125.8 Bn
- CAGR (2026-2035): 8.9%
- Largest Region (2026): North America, approximately 32%
- Fastest-Growing Region: Asia Pacific
- Leading Service Type (2026): API Manufacturing, around 38%
- Leading Molecule Type (2026): Generic APIs, close to 34%
- Key Players: Lonza, Thermo Fisher Scientific, Catalent, and others
What is Small Molecule CDMO Market and its Market Size?
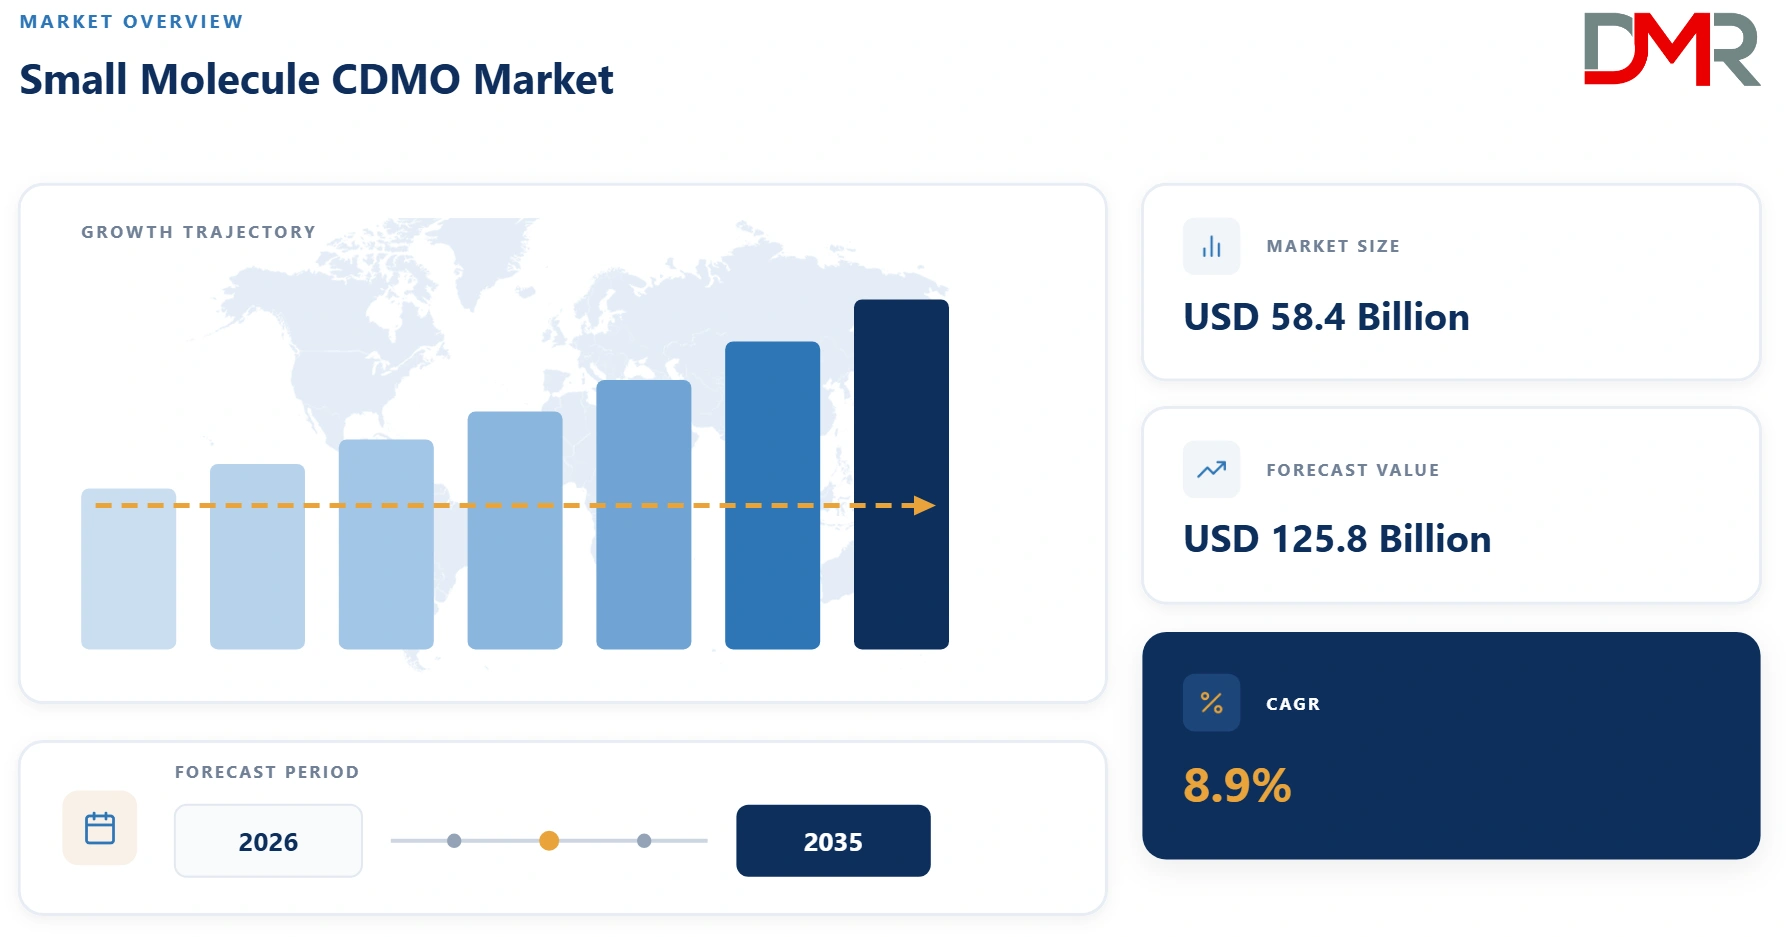
Global Small Molecule CDMO Market size is estimated to reach USD 58.4 Bn in 2026 and is further anticipated to reach USD 125.8 Bn by 2035, at a CAGR of 8.9%.
ℹ
To learn more about this report –
Download Your Free Sample Report Here
The market covers contract development and manufacturing services for chemically synthesized active pharmaceutical ingredients and their finished dosage forms, performed on behalf of pharmaceutical and biotechnology sponsors rather than for a CDMO's own branded portfolio. Scope runs from process research and route scouting through scale up, current good manufacturing practice production of drug substance and drug product, and the analytical and packaging work that sits alongside it. Cell and gene therapy manufacturing, large molecule biologics, and in house captive production by an originator for its own pipeline sit outside this boundary; the market counts only services sold to a third party sponsor.
Buyers fall into three groups with distinct motives. Large pharmaceutical companies use CDMO capacity to keep supply running for products nearing the end of an internal plant's economic life, avoiding fresh capital spending on aging single purpose facilities. Generic manufacturers route high volume, price sensitive active ingredient production to CDMOs whose multi purpose reactor trains beat the unit economics of a plant built for one molecule. Small and mid size biotech companies, frequently without any in house chemistry, manufacturing and controls infrastructure, hand the entire path from candidate to clinical supply to a contracted partner.
The structural backdrop is shifting on two fronts at once. A wave of branded small molecules losing patent protection over the next decade is pushing volume toward generic suppliers that rarely own enough capacity internally, while oncology and central nervous system pipelines are lifting demand for high potency handling that few sponsors choose to build themselves. Both forces favor specialized contract manufacturers over in house expansion.
Use Cases
- Late Stage Innovator Supply Continuity: Large pharmaceutical companies contract small molecule CDMOs to keep manufacturing branded products whose original facilities are approaching retirement, avoiding new capital spending on single purpose plants while tech transfer and revalidated processes keep commercial supply uninterrupted.
- Generic API Cost Optimization: Generic drug manufacturers place high volume, low margin active ingredient production with CDMOs whose shared, multi purpose reactor capacity delivers a landed cost that a facility sized around one molecule cannot reasonably match at scale.
- Emerging Biotech Development Outsourcing: Venture funded biotech sponsors without their own chemistry, manufacturing and controls infrastructure hand off process development and clinical trial material production entirely to a CDMO partner, with small and mid size biotech already accounting for close to 22% of 2026 end user demand.
- High Potency and Controlled Substance Handling: Sponsors developing oncology or scheduled compounds route production to CDMOs holding the specific containment licenses and isolator capacity that handling above standard occupational exposure limits requires, since building that infrastructure rarely clears an internal capital threshold.
Key Takeaways
- Market Size & Share: The market is valued at USD 58.4 Bn in 2026 and is set to reach USD 125.8 Bn by 2035, expanding at a CAGR of 8.9%.
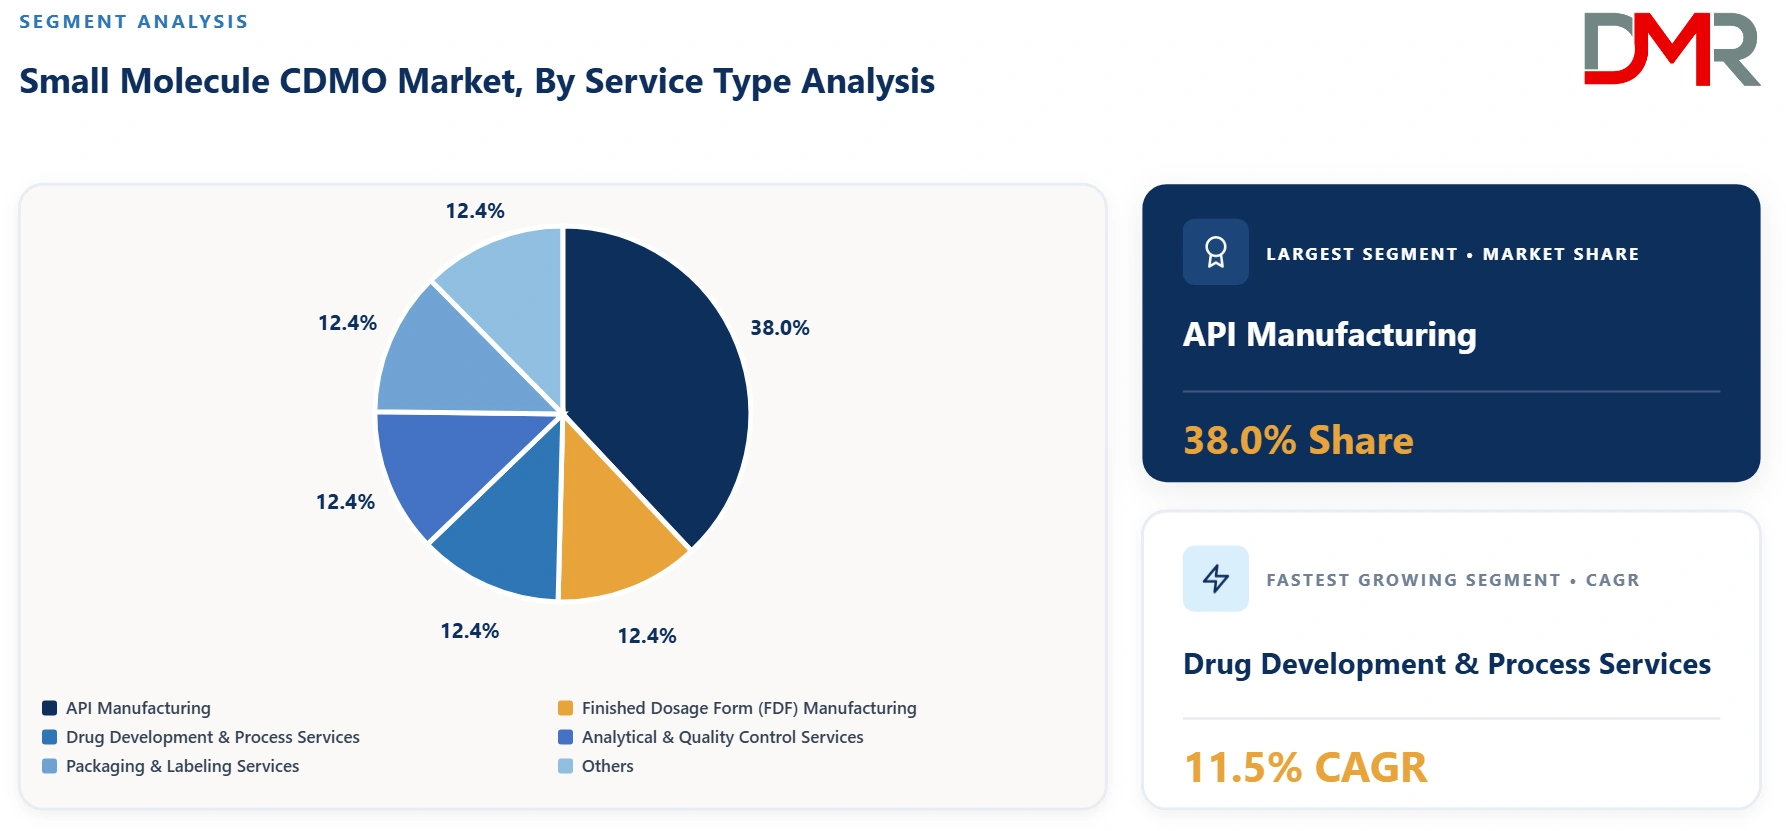
- Service Type Analysis: API manufacturing is expected to lead the service mix, accounting for around 38% of 2026 revenue, on the strength of installed reactor capacity that sponsors cannot quickly replicate.
- Regional Analysis: North America is projected to hold the largest share, at approximately 32% in 2026, while Asia Pacific is expected to expand fastest through 2035.
- Molecule Type Analysis: Generic APIs are estimated to hold close to 34% of 2026 revenue, while high potency APIs grow fastest at a CAGR of 13.6% on rising oncology pipeline volume.
- Investment Momentum: Private capital continues to flow into mid size specialists, with capacity build outs across the United States and Asia Pacific reshaping the competitive map faster than organic growth alone would.
- Quality Compliance: Sponsor selection increasingly hinges on a facility's inspection history, pushing capacity toward sites with a clean current good manufacturing practice record and away from those working through remediation.
How AI/Gen AI is Transforming the Small Molecule CDMO Market?
Artificial intelligence in this market is overwhelmingly operational rather than customer facing. The clearest gains sit in process chemistry, where machine learning models trained on reaction databases propose synthetic routes and flag likely impurity formation before a single batch runs in a pilot plant, and in visual quality control, where computer vision systems catch particulate and fill defects that a manual line inspector would miss at commercial line speed.
A second wave targets the paperwork and knowledge transfer that slow a project down rather than the chemistry itself. Digital twins of a production suite let a receiving site simulate a tech transfer before the first campaign, cutting the trial and error that historically consumed weeks of scarce reactor time, while large language model tools now draft first passes of batch records and regulatory submission narratives for a chemist to review rather than write from scratch. None of this displaces the analytical chemist or the qualified person who signs off a batch; it removes the slower, repeatable steps around them.
- Computer Aided Route Scouting: retrosynthetic models suggest and rank candidate synthesis pathways against cost, yield and impurity risk before development chemists commit bench time.
- Computer Vision Batch Inspection: automated visual systems screen finished dosage form lines for cosmetic and fill defects at a speed and consistency manual inspection cannot sustain.
- Digital Twin Tech Transfer: simulated models of a receiving reactor train de risk scale up before a physical campaign, shortening the validation runs needed between sites.
- LLM Assisted Regulatory Documentation: language models draft initial batch records and submission narratives, leaving quality and regulatory staff to review and finalize rather than originate.
Key Drivers in the Global Small Molecule CDMO Market
Two forces, one demand side and one supply side, are doing most of the work behind current growth.
- Patent Cliffs Redirecting Volume to Contract Manufacturing: A concentrated run of branded small molecule patent expiries through the early 2030s is releasing volume that originator sites, sized for exclusivity era output, were never built to absorb at generic pricing. Generic manufacturers stepping into that gap rarely hold enough internal capacity and instead route active ingredient and finished dose production to CDMOs with shared, multi purpose lines. The effect shows up directly in the service mix, where generic facing production already anchors a large share of API manufacturing revenue, and it compounds every time a further blockbuster loses protection, since the replacement capacity decision defaults to an existing contract partner rather than a multi year internal build.
- Rising Outsourcing Penetration Among Small and Mid Size Biotech: Biotech sponsors raising capital in short, milestone driven rounds cannot justify building chemistry, manufacturing and controls infrastructure that a single asset may never need again after its first clinical readout. That capital discipline pushes the entire development to early commercial workflow onto a CDMO partner, a group already representing close to a quarter of end user demand in 2026. As funding cycles recover from prior troughs, the sponsors reentering the pipeline arrive with no internal manufacturing option at all, reinforcing the CDMO's position as the default rather than the fallback.
Restraints in the Global Small Molecule CDMO Market
Growth is real but not frictionless; two constraints slow how fast capacity can respond.
- Capital Intensity of High Potency and Controlled Substance Capacity: Isolator equipped suites, dedicated air handling and the specific licenses needed to handle scheduled substances or compounds above standard occupational exposure limits carry a cost and lead time that deters all but the largest or most specialized operators. Europe's compliance dense manufacturing base, holding close to 29% of 2026 revenue, illustrates the pattern: sites there compete on regulatory track record precisely because the entry cost of matching that infrastructure keeps new capacity from arriving quickly. A sponsor needing high potency capacity this year is choosing among a short list, not commissioning a new build.
- Skilled Workforce Shortages in Process Chemistry and Quality: Expanding a reactor suite is only useful with enough qualified process chemists, validation engineers and quality assurance staff to run it under current good manufacturing practice, and that talent pool has not grown as fast as announced capacity. Sites in established chemistry hubs increasingly compete with each other for the same graduating cohorts, which lengthens the time between a facility going mechanically complete and it running at qualified, revenue generating output.
Growth Opportunities in the Global Small Molecule CDMO Market
The clearest white space sits where an operating model shift meets underused capacity.
- Continuous Manufacturing Retrofits Across Commercial Sites: Commercial manufacturing already anchors more than half of 2026 workflow revenue, yet most of that output still runs on batch reactors built decades ago. CDMOs that retrofit existing commercial suites for continuous flow chemistry can offer sponsors a shorter, cheaper validation path than a greenfield build, converting an aging batch asset into a differentiated commercial offering rather than a candidate for closure.
- Asia Pacific Capacity Expansion for Cost Arbitrage: Asia Pacific combines the fastest projected regional growth with a cost base that undercuts North America and Europe on labor and utilities, and government incentive programs in several countries are underwriting new reactor capacity that would otherwise take longer to justify. CDMOs building there first capture generic and early clinical work priced on cost, then move up toward higher value innovator and high potency projects as track record and inspection history accumulate.
Trends in the Global Small Molecule CDMO Market
Two shifts are changing how the market competes, separate from the growth drivers above.
- Consolidation Through Private Equity Backed Roll Ups: Financial sponsors are assembling mid size specialists into platforms that offer sponsors a broader service menu, from early process development through commercial fill, without the sponsor having to manage multiple contracts across separate companies. Roll ups concentrated in high potency and controlled substance capability are reshaping who can bid for the largest, most complex programs.
- Dual Sourcing Strategies Reducing Single Site Dependency: Sponsors burned by pandemic era single site disruptions now specify a second qualified manufacturing site as a contract condition on new and renewed CDMO agreements. That shift is spreading volume across more facilities per program than before and rewarding CDMOs with multiple, cross qualified sites over single large plants.
Research Scope and Analysis
Segment performance is assessed across five axes: service type, workflow stage, molecule type, therapeutic area and end user. Each axis identifies the sub-segment carrying the largest share of 2026 revenue and the one expanding fastest through 2035, with the commercial reason behind each position.
ℹ
To learn more about this report –
Download Your Free Sample Report Here
By Service Type
API manufacturing is projected to hold the largest share of the service mix in 2026, accounting for around 38% of revenue, since every program eventually needs a validated active ingredient supply and sponsors rarely switch that supplier once qualified. Growth, however, is concentrated in drug development and process services, expanding at a CAGR of 11.5% between 2026 and 2035 as biotech sponsors entering the pipeline with no internal chemistry function push early stage route scouting and process work onto CDMOs well before any commercial volume exists.
By Workflow
Commercial manufacturing is expected to remain the largest workflow segment in 2026, holding close to 56% of revenue, because validated commercial supply agreements run for years and generate steady, recurring volume once a product clears approval. The steeper trajectory sits with Phase I and Phase II clinical supply, growing at a CAGR of 12.8% as recovering biotech funding pushes a larger number of early stage candidates into first in human and proof of concept trials that all require outsourced clinical material.
By Molecule Type
Generic APIs are estimated to account for close to 34% of 2026 revenue, the largest share by molecule type, reflecting the sheer volume of off patent small molecules still under production long after their originator's exclusivity period ends. Growth, however, is concentrated in high potency APIs, expanding at a CAGR of 13.6% as oncology pipelines requiring containment above standard exposure limits keep expanding faster than the specialized capacity built to serve them.
By Therapeutic Area
Oncology is projected to lead therapeutic area demand in 2026, accounting for approximately 27% of revenue, given the sheer density of small molecule candidates in active development against solid tumor and hematologic targets. The fastest growth, though, sits with metabolic disorders, at a CAGR of 14.2%, as a new generation of oral small molecule candidates targeting weight and glycemic control moves from clinical trial into commercial scale manufacturing.
By End User
Large pharmaceutical companies are expected to remain the leading end user group in 2026, holding around 44% of revenue, since their broad, multi asset portfolios generate steady manufacturing volume across every workflow stage at once. Growth, however, is concentrated among small and mid size biotech and pharma sponsors, expanding at a CAGR of 13.1% as venture funded companies without any internal manufacturing option enter the pipeline in greater numbers.
The Global Small Molecule CDMO Market Report is Segmented Based on the following
By Service Type
- API Manufacturing
- Finished Dosage Form (FDF) Manufacturing
- Drug Development & Process Services
- Analytical & Quality Control Services
- Packaging & Labeling Services
- Others
By Workflow
- Commercial Manufacturing
- Phase III Clinical Supply
- Phase I/II Clinical Supply
- Preclinical & Process Development
- Others
By Molecule Type
- Generic APIs
- Innovator/Branded APIs
- High Potency APIs (HPAPIs)
- Controlled Substances
- Peptide-based Small Molecules
- Others
By Therapeutic Area
- Oncology
- Cardiovascular
- Central Nervous System
- Infectious Diseases
- Metabolic Disorders
- Respiratory
- Others
By End User
- Large Pharmaceutical Companies
- Generic Drug Manufacturers
- Small & Mid-size Biotech/Pharma
- Academic & Research Institutes
- Others
Regional Analysis
Region with the Largest Revenue Share
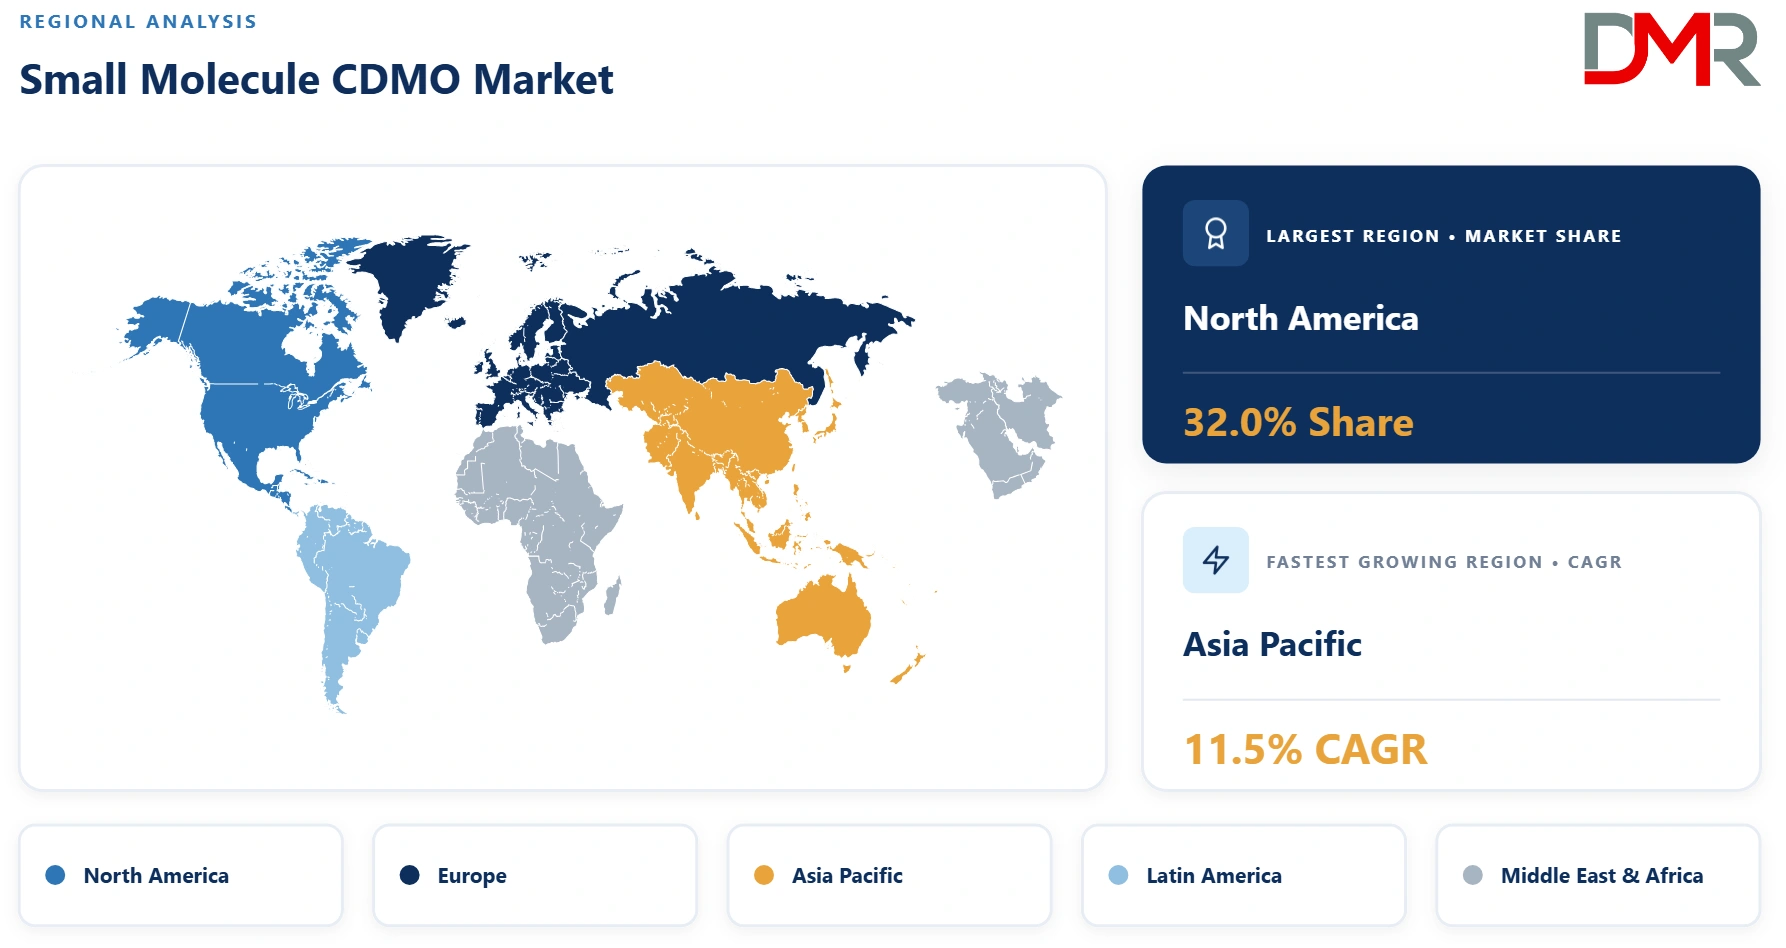
North America is projected to hold the largest regional share in 2026, at approximately 32% of global revenue. The region concentrates a dense cluster of branded pharmaceutical sponsors and venture funded biotech companies whose procurement budgets sit close to CDMO decision makers, and its regulatory proximity to the US Food and Drug Administration gives sponsors a shorter, more predictable inspection path than an offshore site. Established chemistry hubs across the Northeast and Midwest United States also carry decades of accumulated process know how that a newer region cannot replicate quickly, keeping high value innovator and high potency work anchored there even as cost driven generic volume migrates elsewhere.
ℹ
To learn more about this report –
Download Your Free Sample Report Here
Region with the Highest CAGR
Asia Pacific is forecast to expand fastest through 2035, at a CAGR of 11.5%. Government incentive programs in China and India are underwriting new reactor capacity that lowers the effective cost of entry for both domestic and multinational CDMOs, while a growing pool of chemistry graduates narrows the skilled labor gap that constrains expansion elsewhere. A rapidly expanding domestic biotech sector across the region is also generating its own local sourcing demand, layering organic regional growth on top of capacity built originally to serve export markets.
By Region
North America
Europe
- Germany
- France
- The UK
- Italy
- Spain
- Rest of Europe
Asia-Pacific
- China
- Japan
- India
- Australia
- South Korea
- Rest of APAC
Latin America
- Mexico
- Brazil
- Colombia
- Argentina
- Rest of LATAM
Middle East & Africa
- Saudi Arabia
- The UAE
- South Africa
- Rest of MEA
Regulatory Landscape
Oversight runs through the US Food and Drug Administration and the European Medicines Agency, whose current good manufacturing practice inspections and warning letter activity function as an informal scoring system that sponsors consult before awarding new work. What is shifting now is a sharper focus on data integrity and electronic batch record traceability rather than paperwork completeness alone, pushing sites to invest in system validation ahead of their next inspection cycle. The commercial opening sits with facilities that maintain a clean, current inspection history, since a compliant site increasingly commands premium pricing over a peer working through a remediation plan, a dynamic reinforced by Europe's compliance dense manufacturing base holding close to 29% of 2026 revenue. The brake is timing: a single adverse inspection outcome can strand qualified capacity for a year or more while corrective actions are verified, removing supply from the market at exactly the moment sponsors are trying to dual source around it, which tightens pricing across the remaining compliant capacity.
Investment and White Space Analysis
Private capital has moved decisively into mid size specialists over the past two years, with financial sponsors assembling platforms that bundle process development, API manufacturing and finished dose capability under one ownership structure. What is shifting now is the target profile: acquirers are chasing high potency and controlled substance capability specifically, rather than generic scale, since that capacity is scarcer and commands better margins. The clearest white space sits in continuous manufacturing retrofits of existing commercial suites and in Asia Pacific greenfield capacity, both of which offer a faster path to differentiated supply than building conventional batch capacity from scratch. The risk is valuation discipline: multiples paid for scarce high potency assets have climbed to a point where integration missteps or a slower than expected ramp can erase the return an acquirer underwrote, a risk that grows as more platforms compete for the same short list of acquisition targets.
Competitive Landscape
The market remains fragmented at the tail even as a dozen large, diversified players account for a meaningful share of total revenue, since no single company holds enough capacity across every service type, molecule class and region to serve every sponsor need. Competition centers on regulatory track record, breadth of licensed capacity for high potency and controlled substances, and the ability to offer a sponsor a single contract spanning development through commercial supply. Dominant strategies include continued capacity investment in the United States and Asia Pacific, bolt on acquisition of specialist capability rather than organic build out, and long term dual sourcing partnerships that lock in sponsor volume across multiple sites at once.
Some of the Prominent Players in the Global Small Molecule CDMO Market Are
- Lonza Group
- Thermo Fisher Scientific
- Catalent Inc.
- Recipharm AB
- Siegfried Holding AG
- Piramal Pharma Solutions
- Cambrex Corporation
- Aenova Group
- Fareva
- Corden Pharma
- Sterling Pharma Solutions
- Almac Group
- Curia
- Ajinomoto Bio-Pharma Services
- PCI Pharma Services
- Metrics Contract Services
- Cerbios-Pharma
- Delpharm
- Dottikon Exclusive Synthesis
- Hovione
- Adare Pharma Solutions
- Societal CDMO
- CoreRx
- Pfizer CentreOne
- Evonik Industries
- Merck KGaA Life Science
- WuXi AppTec
- Divi's Laboratories
- Hetero Labs
- Laurus Labs
- Neuland Laboratories
- Suven Pharmaceuticals
- Asymchem Laboratories
- Porton Pharma Solutions
- SK Pharmteco
- Jubilant Pharmova
- Alcami Corporation
- Novasep
- Dishman Carbogen Amcis
- Zhejiang Hisun Pharmaceutical
- Other Key Players
Recent Developments
- In March 2026, Cambrex completed initial engineering studies for a new large scale API plant in Charles City, Iowa, part of a previously announced 120 million dollar investment in US manufacturing capacity, with groundbreaking scheduled for later in the year.
- In March 2026, Siegfried outlined a series of acquisitions aimed at expanding its small molecule drug substance capacity across sites in the United States and Australia.
- In March 2026, Dottikon Exclusive Synthesis provided an update on a multi year, billion dollar program to expand its small molecule API manufacturing capacity.
- In 2025, Lonza launched an AI enabled route scouting service for small molecules, pairing computer aided synthesis planning technology with its own process research and supply chain data to speed up synthetic pathway selection.
- In 2025, Cambrex completed a 38 million dollar expansion at its small molecule API facility in High Point, North Carolina.
Report Details
| Report Characteristics |
| Market Size (2026) |
USD 58.4 Bn |
| Forecast Value (2035) |
USD 125.8 Bn |
| CAGR (2026–2035) |
8.9% |
| The US Market Size (2026) |
USD 14.6 Bn |
| Historical Data |
2021 – 2025 |
| Forecast Data |
2026 – 2035 |
| Base Year |
2025 |
| Segments Covered |
By Service Type, By Workflow, By Molecule Type, By Therapeutic Area, and By End User |
| Regional Coverage |
North America – The US and Canada; Europe – Germany, France, The UK, Italy, Spain, Rest of Europe; Asia-Pacific – China, Japan, India, Australia, South Korea, Rest of APAC; Latin America – Mexico, Brazil, Colombia, Argentina, Rest of LATAM; Middle East & Africa – Saudi Arabia, The UAE, South Africa, Rest of MEA |
Frequently Asked Questions
How big is the Global Small Molecule CDMO Market?
▾ The market is estimated at USD 58.4 Bn in 2026 and is projected to reach USD 125.8 Bn by 2035. Growth is anchored by patent driven generic volume and rising outsourcing among biotech sponsors without in house manufacturing, both of which push a larger share of chemically synthesized drug production onto contracted capacity through the forecast period.
What is the growth rate of the Global Small Molecule CDMO Market?
▾ The market is projected to expand at a CAGR of 8.9% between 2026 and 2035. That pace reflects steady, established category economics rather than an early stage boom, with generic conversion and biotech outsourcing providing durable, incremental volume growth rather than one time step changes in demand.
Which region holds the largest share in the Global Small Molecule CDMO Market?
▾ North America is expected to hold the largest regional share in 2026, at approximately 32% of global revenue. Dense clustering of branded pharmaceutical and biotech sponsors, proximity to US regulators, and decades of accumulated chemistry know how across established hubs keep high value work anchored in the region.
Who are the key players in the Global Small Molecule CDMO Market?
▾ Prominent participants include Lonza Group, Thermo Fisher Scientific, Catalent Inc., Siegfried Holding AG, Cambrex Corporation, Piramal Pharma Solutions and WuXi AppTec, alongside a broad tier of regional specialists and adjacent chemical suppliers competing on regulatory track record and licensed capacity.
Which service type leads the Global Small Molecule CDMO Market?
▾ API manufacturing leads the service mix, accounting for around 38% of 2026 revenue, since sponsors rarely switch active ingredient suppliers once a process is validated and qualified. Drug development and process services, however, is the fastest growing service line as early stage biotech outsourcing accelerates.
Which molecule type is expanding fastest in the Global Small Molecule CDMO Market?
▾ High potency APIs are expanding fastest, at a CAGR of 13.6% between 2026 and 2035, as oncology pipelines requiring specialized containment above standard occupational exposure limits grow faster than the licensed capacity built to serve them, keeping this sub segment supply constrained relative to demand.
What is driving demand in the Global Small Molecule CDMO Market?
▾ Demand in the Small Molecule CDMO Market is driven chiefly by patent expiries redirecting branded volume toward generic contract manufacturing and by capital disciplined biotech sponsors outsourcing their entire development to early commercial workflow rather than building internal chemistry, manufacturing and controls infrastructure of their own.