Market Overview
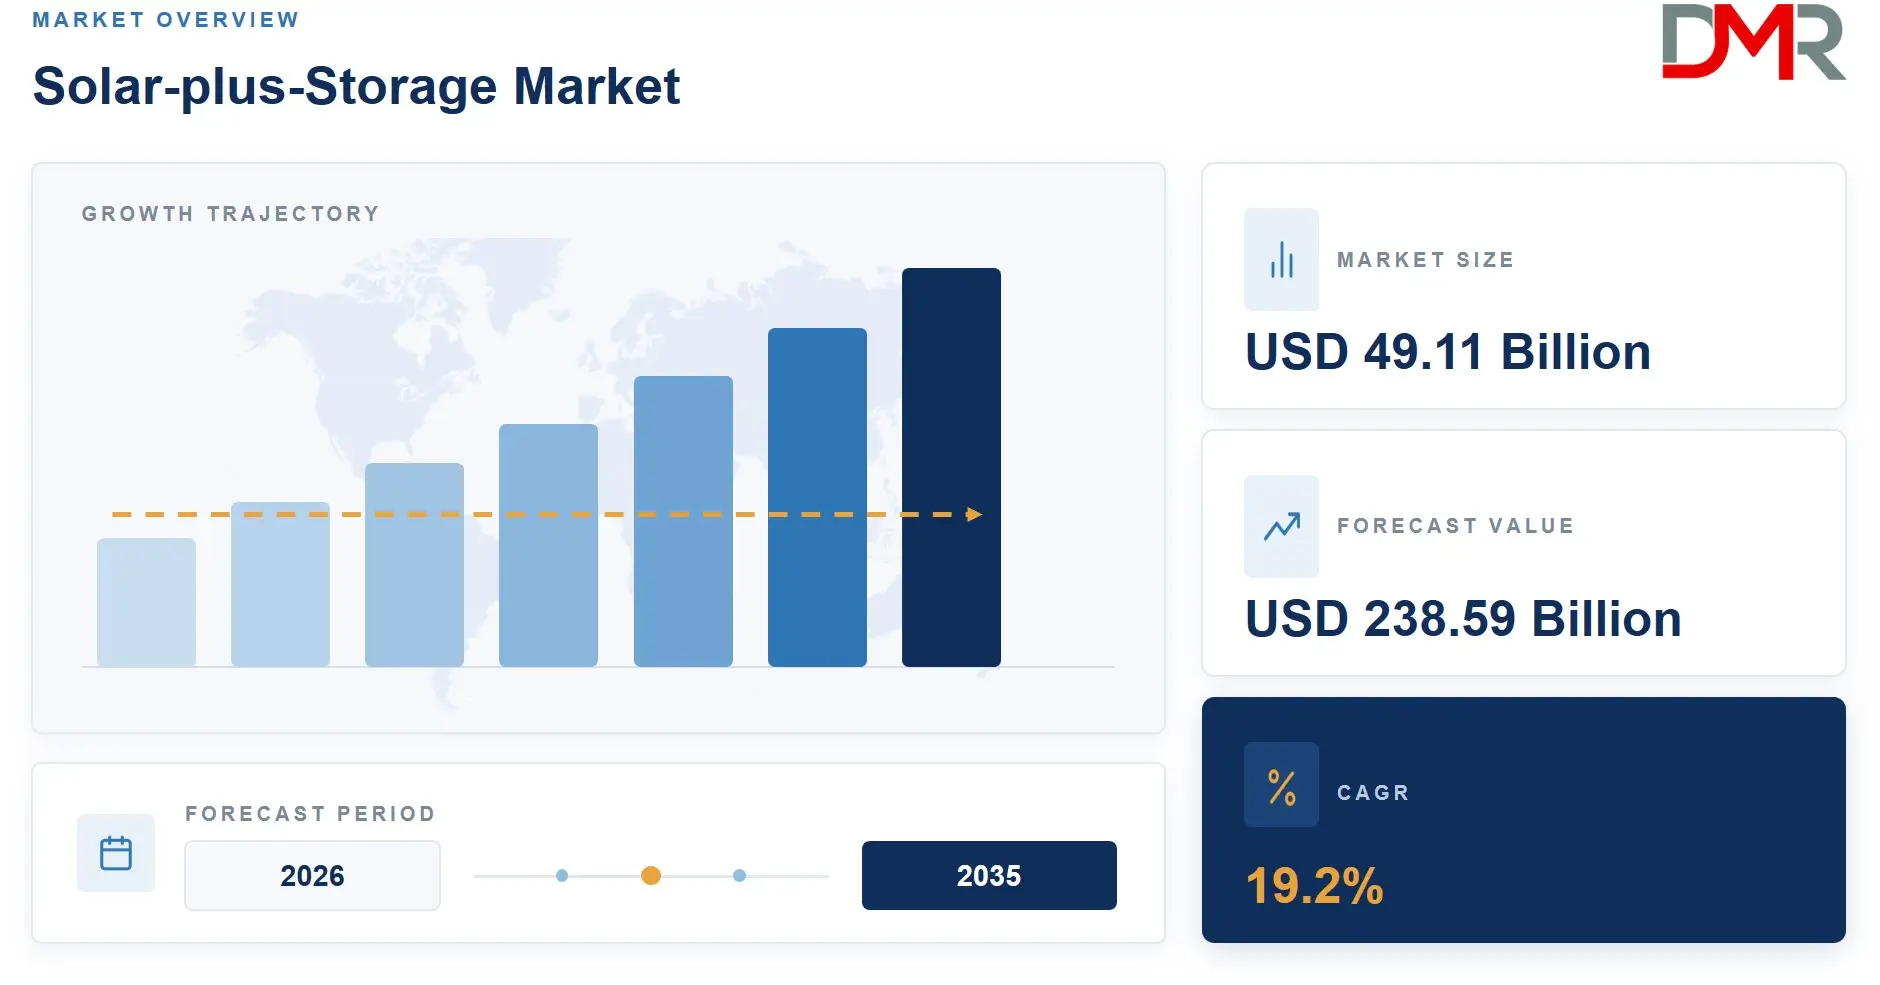
The Global Solar-plus-Storage Market size is estimated at USD 49.11 Billion in 2026, and is projected to reach USD 238.59 Billion by 2035, exhibiting a CAGR of 19.2% during the forecast period. Developers added 87 GW of co-located solar and storage capacity globally in 2025, with projects delivering electricity at an average cost of $57/MWh, as reported by BloombergNEF. That output volume confirms the market has crossed from pilot-scale to mainstream procurement. Buyers now treat solar-plus-storage as the default energy asset type, not a premium option. California's Bellefield Solar and Energy Storage Farm entered commercial operation in December 2025 with 500 MW of photovoltaic capacity paired with 500 MW of battery power capacity, as confirmed by the U.S. Energy Information Administration. Projects at that scale signal that grid operators are writing large-volume contracts with confidence that delivery timelines are reliable.
The pipeline behind Bellefield reflects the same confidence across multiple U.S. states and international markets. Solar-plus-storage integrates photovoltaic generation with battery dispatch into a single controllable asset. Grid Scale Energy Storage and Energy Storage Systems form the technical backbone of this market, distinguishing it from standalone solar by enabling sellers to deliver power on demand rather than only when the sun generates it. The broader energy transition depends on this dispatchability characteristic as variable renewable penetration rises.
ℹ
To learn more about this report –
Download Your Free Sample Report Here
Key Takeaways
- The market size is USD 49.11 Billion in 2026, and is projected to hit USD 238.59 Billion by 2035 at a CAGR of 19.2%.
- By Component: Battery Energy Storage Systems led as the largest category with a 43.1% share in 2026.
- By Battery Chemistry: Lithium Iron Phosphate (LFP) led with a 62.3% share in 2026.
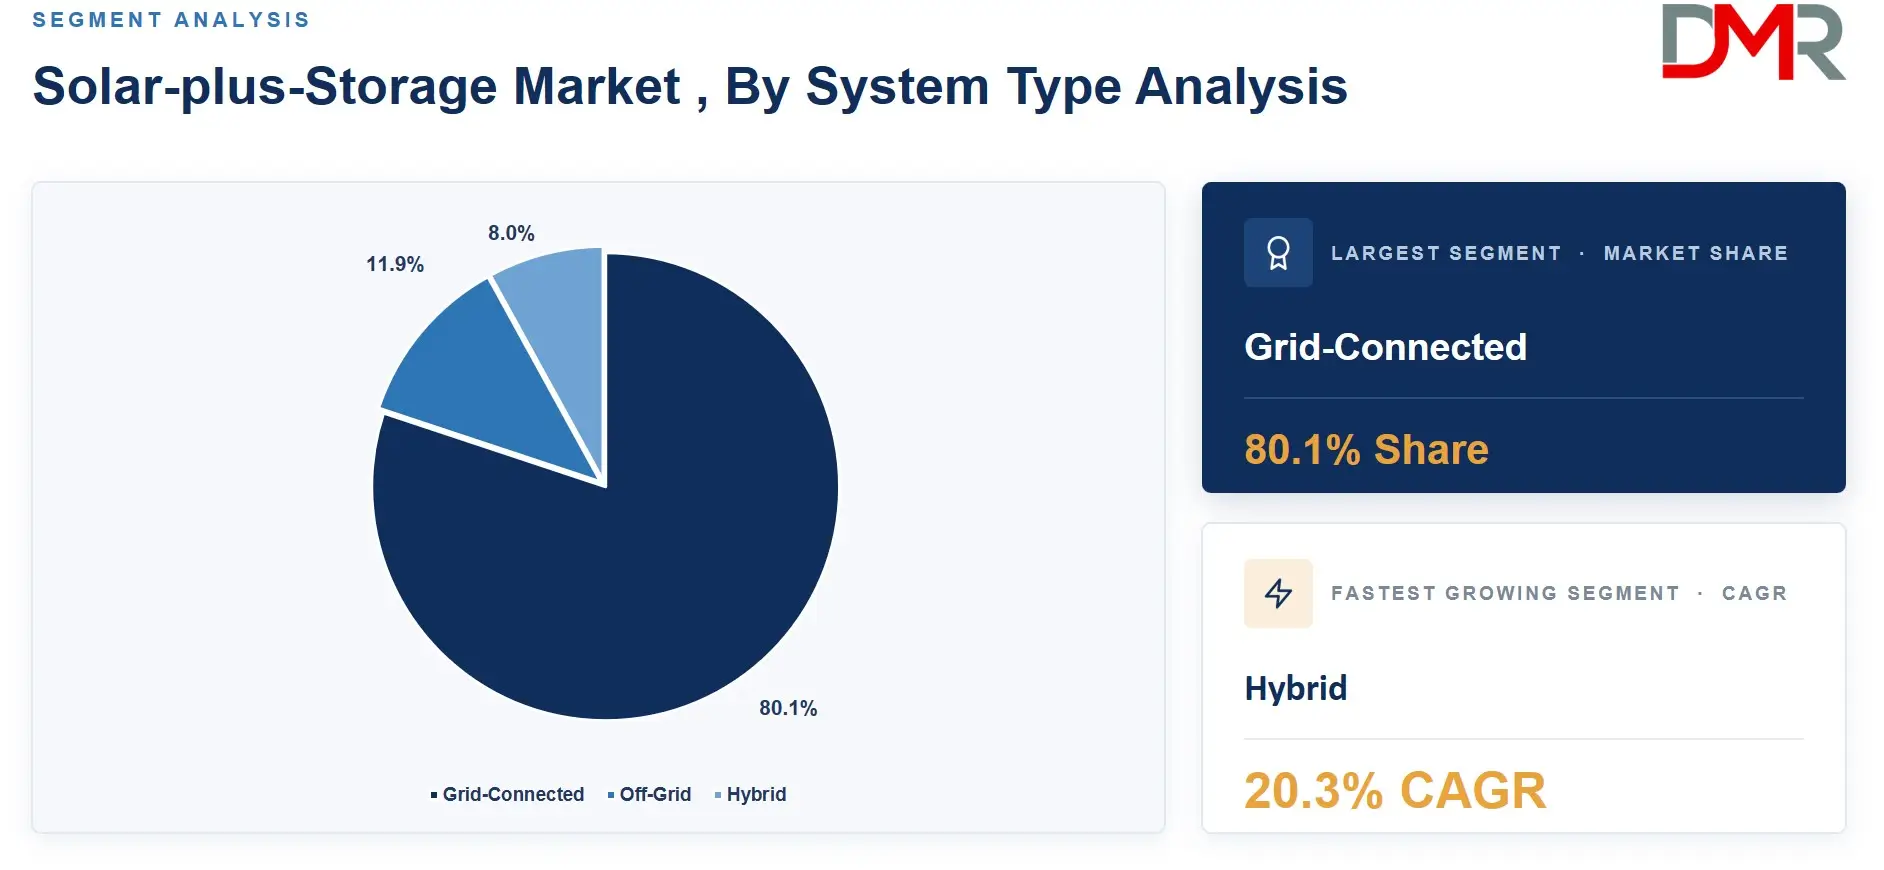
- By System Type: Grid-Connected led with a 80.1% share in 2026.
- By Capacity: Above 10 MW led with a 45.2% share in 2026.
- By Application: Energy Shifting & Self-Consumption led with a 35.2% share in 2026.
- By End User: Utility-Scale led with a 57.2% share in 2026.
- By Deployment: New-Build Solar-plus-Storage led with a 64.2% share in 2026.
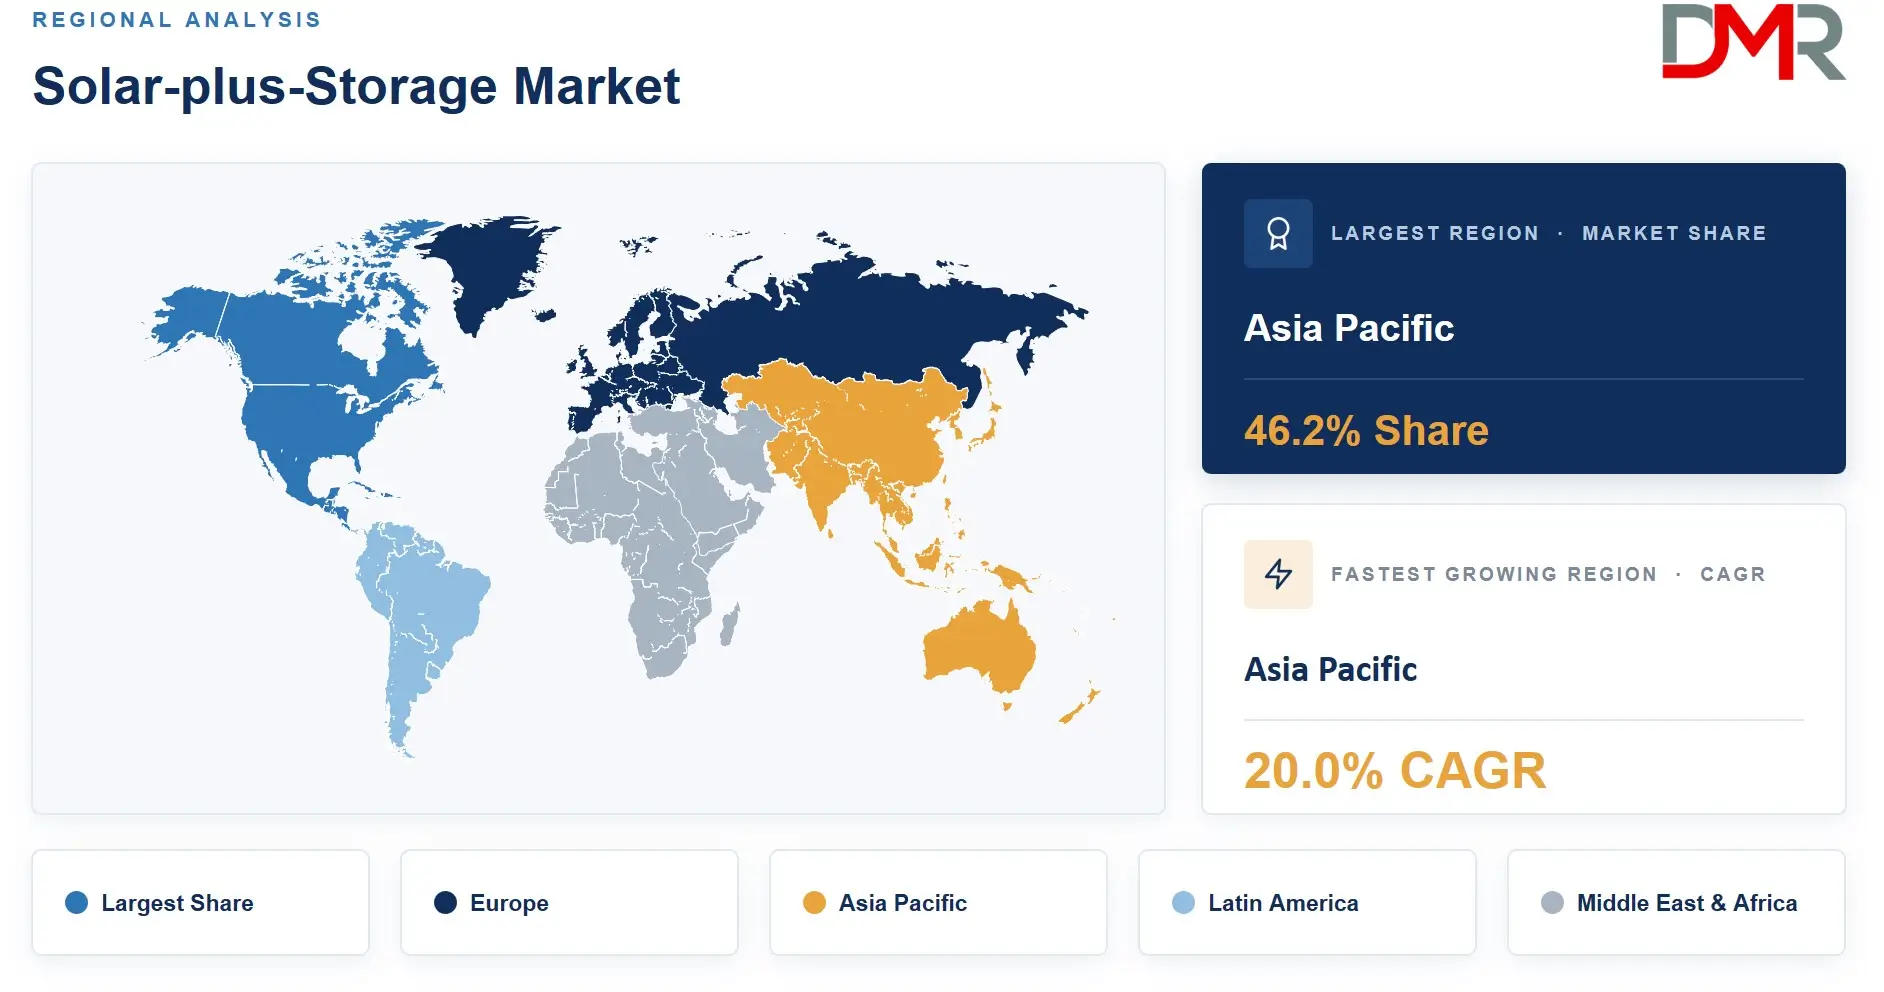
- By Region: Asia Pacific led with a 46.2% share, valued at USD 18.5 Billion, in 2026.
- Top 5 key players: Tesla, Inc., CATL, Sungrow Power Supply Co., Ltd., BYD Company Ltd., Huawei Digital Power.
Component Analysis
Battery Energy Storage Systems accounted for 43.1% of component demand in 2026, the highest of any category. BESS units are the single largest cost driver and the primary differentiator between a solar farm and a dispatchable clean energy asset. Buyers in utility procurement processes now evaluate BESS specifications — chemistry, cycle life, and safety certifications — with the same rigor previously reserved for turbine contracts. The Solar Energy and Battery Storage integration dynamic means that BESS vendors command pricing leverage that pure solar module suppliers cannot match. Solar PV Modules, Power Conversion Systems, and Energy Management and Controls each occupy distinct portions of the remaining component share. DOE's 2025 Q1 benchmark placed a commercial 250 kWdc PV-plus-storage system at $2.96/Wdc at minimum sustainable price, with operation and maintenance costs running $67/kWdc per year, as published by the U.S. Department of Energy. Residential systems carry a higher per-watt cost: the DOE's same benchmark quarter priced an 8 kWdc residential system with 13.5 kWh of storage at $4.59/Wdc at modeled market price, with $64/kWdc per year for O&M. The cost gap between residential and utility-scale reflects balance-of-system economies of scale that push volume buyers toward larger project sizes.
Battery Chemistry Analysis
Lithium Iron Phosphate (LFP) led the Battery Chemistry segment with a 62.3% share in 2026. LFP's dominance reflects a chemistry trade-off that buyers resolved in favor of safety and cycle life over energy density. Utility developers operating 20-year project finance structures prioritize degradation rates over volumetric efficiency. LFP cells deliver both at a cost point that NMC cannot currently match at scale. Nickel Manganese Cobalt chemistry retains relevance in applications where space constraints penalize LFP's lower energy density, particularly in commercial rooftop deployments. Lead-acid holds residual share in off-grid installations where capital cost matters more than cycle life. Sodium-Ion is the fastest-growing chemistry category, advancing on the strength of its cobalt-free bill of materials and its attractiveness for projects requiring domestic content compliance. Flow batteries are gaining evaluation traction in projects exceeding six-hour discharge requirements, where their independent scaling of power and energy gives engineers design flexibility that lithium-ion cannot replicate.
System Type Analysis
With a 80.1% share in 2026, Grid-Connected outpaced all other System Type categories. Grid-connected systems dominate because utility offtake contracts and grid-interconnection agreements require assets to operate within regulated dispatch frameworks. Developers building under long-term power purchase agreements have no economic incentive to isolate their assets from the grid. Revenue stacking across energy arbitrage, capacity, and ancillary services is available only to grid-connected systems. Off-Grid commands a smaller but strategically important share, serving communities where grid extension economics do not close. Hybrid systems are growing as developers pursue configurations that provide both grid revenue and local resilience value simultaneously, a structure gaining traction in markets where grid reliability is inconsistent.
ℹ
To learn more about this report –
Download Your Free Sample Report Here
Capacity Analysis
A 45.2% share made Above 10 MW the clear leader across Capacity categories in 2026. Utility-scale procurement structures inherently favor large capacity blocks. Grid operators buying firm capacity products need assets large enough to move the dispatch needle at system level. Projects below 1 MW serve different buyers — commercial facility managers, remote community developers, and aggregators — whose contract structures and financing terms differ fundamentally from those available to utility-scale developers. The 100 kW–1 MW and 1–10 MW bands are growing as C&I buyers with corporate renewable energy targets build mid-size behind-the-meter systems that pair solar generation with peak demand management. Below 100 kW covers residential and small commercial installations where program incentives and virtual power plant aggregation are the primary economic drivers.
Application Analysis
Energy Shifting & Self-Consumption led the Application segment with a 35.2% share in 2026. Energy shifting converts a solar asset's time-of-generation profile into a time-of-delivery profile that matches peak demand and peak pricing windows. Buyers who pay time-of-use rates or sell into real-time wholesale markets generate direct financial returns from the shift function that justify storage capital costs without subsidy. The economics are strongest in markets with steep evening price ramps caused by the so-called duck curve. Peak Shaving and Backup Power and Resilience together serve buyers motivated by demand charge avoidance and grid-outage protection rather than wholesale market participation. Frequency Regulation and Ancillary Services capture value from the speed of battery response, a capability that no thermal generator can match. Microgrids represent the application with the highest per-kilowatt-hour value capture but also the highest system integration complexity, which limits short-term penetration.
End User Analysis
Utility-Scale captured 57.2% of the End User segment in 2026, ahead of all rivals. Utilities and independent power producers account for the majority of contracted solar-plus-storage capacity because their project financing, interconnection timelines, and offtake structures are best suited to the asset class. A single utility-scale project can represent several hundred megawatts, meaning a handful of contracts per year generate the majority of annual installed capacity. Commercial and Industrial buyers are growing their share as corporate sustainability commitments move from aspiration to contractual obligation. C&I buyers that signed solar-only PPAs before 2023 are now re-contracting with storage provisions added. Residential Battery Energy Storage Systems represent the fastest-growing end-user category, driven by retail electricity price volatility, self-consumption economics, and virtual power plant programs that compensate homeowners for grid services.
Deployment Analysis
New-Build Solar-plus-Storage led the Deployment segment with a 64.2% share in 2026. New-build projects dominate because greenfield sites allow developers to optimize system sizing, storage ratio, and interconnection from the outset. Engineering integration decisions made at the design stage produce better economic outcomes than retrofit installations constrained by legacy equipment and grid connection terms. Lenders also prefer new-build assets with clean documentation trails and modern safety certifications. Retrofit Storage Addition to Existing Solar is growing as owners of solar assets built before the ITC standalone storage provisions seek to unlock incremental revenue. Retrofitting an operating solar farm avoids land and interconnection acquisition costs, but inverter compatibility, original warranty terms, and utility permission-to-operate requirements all create friction that slows the process relative to greenfield development.
Key Market Segments
By Component
- Battery Energy Storage Systems
- Solar PV Modules
- Power Conversion Systems
- Energy Management & Controls
- Balance of System & Services
By Battery Chemistry
- Lithium Iron Phosphate (LFP)
- Nickel Manganese Cobalt (NMC)
- Lead-Acid
- Flow Batteries
- Sodium-Ion
- Other Chemistries
By System Type
- Grid-Connected
- Off-Grid
- Hybrid
By Capacity
- Above 10 MW
- Below 100 kW
- 100 kW–1 MW
- 1–10 MW
By Application
- Energy Shifting & Self-Consumption
- Peak Shaving
- Backup Power & Resilience
- Frequency Regulation & Ancillary Services
- Microgrids
By End User
- Utility-Scale
- Commercial & Industrial
- Residential
By Deployment
- New-Build Solar-plus-Storage
- Retrofit Storage Addition to Existing Solar
Regional Analysis
Asia Pacific led the Solar-plus-Storage Market with a 46.2% share valued at USD 18.5 Billion in 2026.
Asia Pacific
Asia Pacific combines the world's largest solar manufacturing base with the fastest-growing electricity demand, a structural pairing that no other region replicates. China drives volume through state-directed procurement and vertically integrated supply chains that compress project costs below levels achievable anywhere else. India accelerated its position through competitive auctions: the country's first solar-plus-six-hour-storage auction in early 2026 cleared at INR 3.12/kWh ($34/MWh), as reported by Ember, a tariff competitive with new coal-fired capacity on a like-for-like basis. Japan Solar Energy installations, while smaller in scale, contribute to the region's storage attachment momentum as grid operators contend with high renewable curtailment rates on isolated island networks.
North America
U.S. permit data shows that state-level residential solar-storage attachment rates ranged from 85.1% in Hawaii to 20.0% in Texas in 2025, according to Scout Data. Hawaii's near-universal attachment reflects a grid environment where export compensation has been curtailed and self-consumption economics are compelling. California at 50.2% reflects both mature retail incentives and time-of-use tariffs that reward storage dispatch in evening hours. The breadth of the state-level spread signals that North America's growth will be uneven, concentrated in high-tariff and high-curtailment states rather than distributed uniformly.
ℹ
To learn more about this report –
Download Your Free Sample Report Here
Europe
European buyers accelerated procurement after the 2022 energy price shock exposed structural dependence on gas-fired backup generation. Corporate buyers in Germany, France, and Iberia now treat solar-plus-storage as a hedge against wholesale price volatility rather than purely a sustainability instrument. Regulatory frameworks at EU level support storage by classifying it as a distinct asset class separate from generation, removing double-taxation concerns that previously slowed investment decisions.
Latin America
Brazil and Chile dominate Latin American solar-plus-storage deployment, driven by irradiance resources among the strongest globally and electricity systems chronically short of midday demand management tools. Both markets use public auctions as the primary procurement mechanism, and storage provisions are now written into standard RFP terms rather than offered as optional add-ons. Mexico's grid reform uncertainty slowed corporate investment from 2021 through 2024, but off-take structures outside CFE's remit are drawing private capital back into hybrid projects.
Middle East & Africa
Gulf Cooperation Council states are deploying solar-plus-storage at gigawatt scale as sovereign energy strategies shift from hydrocarbon export dependency toward domestic clean power. Sub-Saharan Africa presents a fundamentally different demand profile: off-grid and microgrid deployments serve the underelectrified majority where utility extension economics fail. Both segments are growing, but GCC projects are larger in individual contract size while African projects are growing faster in unit count.
Key Regions and Countries
North America
Europe
- Germany
- France
- The UK
- Spain
- Italy
- Rest of Europe
Asia Pacific
- China
- Japan
- South Korea
- India
- Australia
- Rest of APAC
Latin America
- Brazil
- Mexico
- Rest of Latin America
Middle East & Africa
- GCC
- South Africa
- Rest of MEA
Macroeconomic Impact
Interest rate environments directly affect solar-plus-storage project economics because capital-intensive assets with 20-year payback periods are highly sensitive to the cost of debt. Rate cuts in 2024 and 2025 across major central banks improved the net present value of projects in the pipeline, pulling forward final investment decisions that developers had deferred. Higher rates in prior years had widened the gap between project IRR and hurdle rates, stalling several mid-size developments. Avantus' Aratina 1 project entered commercial operation in July 2026 with 200 MW of solar and 500 MWh of storage, serving more than 105,000 California homes annually, as confirmed by Avantus. Projects of that scale require multi-year financing commitments, and their delivery confirms that capital markets have re-priced long-duration clean energy credit risk downward. Tariff policy changes affecting imported battery cells represent the primary macroeconomic uncertainty facing developers in 2026 and beyond.
Market Dynamics
Driver: Storage Cost Declines Redefine Project Economics at Scale
The global benchmark levelized cost for a four-hour battery project fell 27% year over year to $78/MWh in 2025, as reported by BloombergNEF. At that price point, solar-plus-storage undercuts new-build gas peaker plants in a majority of U.S. wholesale markets on a pure cost basis. Developers who had modeled storage as an incremental premium now treat it as the cost-competitive default configuration. U.S. residential permits recorded a solar-storage attachment rate of 28.98% in 2025, representing 106,676 storage-included permits out of 368,049 solar permits filed, per Scout Data. Early 2026, Heron Power and NeoVolta secured major credit facilities specifically to advance residential and commercial solar-plus-storage deployment, demonstrating that capital providers have validated the residential attachment economics. The combination of falling hardware cost and rising installer confidence is compressing the timeline from incentive policy to deployed asset.
Restraint: Interconnection Delays and Supply Chain Concentration Compress Margins
Grid interconnection queue backlogs in MISO, PJM, and CAISO regions are delaying solar-plus-storage projects by two to five years between application and commercial operation. RWE commissioned its Stoneridge project in Texas in November 2025 with 200 MW of solar and a 100 MW/200 MWh battery, as reported by RWE, a project whose timeline nonetheless reflected the competitive but constrained Texas interconnection environment. Developers in more congested queues face far longer waits, which extends capital at risk and increases refinancing exposure. Battery cell manufacturing concentration in Chinese facilities creates dual risks for international project developers. FERC Order 2023 reforms are partially addressing queue congestion by restructuring the interconnection study process, but administrative backlogs mean the benefit of policy change will not reach projects in queue until late in the decade. In April 2026, AESC sold its Tennessee battery manufacturing facility to Fixx Energy specifically to establish domestically compliant production lines for U.S. solar-plus-storage equipment, a transaction that illustrates how seriously developers are treating domestic content requirements under the Inflation Reduction Act.
Opportunity: Hybrid Projects and Distributed Microgrids Open New Revenue Layers
Ember's 2026 cost model used installed costs of $435/kW for solar and $126/kWh of usable battery capacity, with annual operating expenses equal to 2% and 2.5% of capital expenditure respectively, and degradation rates of 0.5% and 2% per year, as published by Ember Energy. Those cost parameters place hybrid solar-storage-green hydrogen projects within reach of bankable return thresholds in high-irradiance markets. Curtailed solar energy, previously an economic loss, becomes a feedstock input for electrolyzers in hybrid configurations. Commercial developer CleanMax raised $575 million in May 2026 to develop 1 GW of data center-focused solar and hybrid energy storage projects, capitalizing on hyperscaler demand for 24/7 clean power supply. Distributed Energy Resources aggregation at residential and commercial scale offers a parallel opportunity, converting disaggregated rooftop assets into virtual power plants that provide grid services without new generation infrastructure. Both pathways expand total addressable revenue per megawatt of installed solar capacity.
Porter's Five Forces
Competitive intensity in the solar-plus-storage market reflects a structure where the barriers to entry are high at the project development level but moderate at the component supply level. New entrants face interconnection queues, multi-year permitting timelines, and capital requirements that effectively limit greenfield development to well-capitalized developers. Supplier bargaining power is concentrated in lithium-ion cell manufacturers, where Chinese producers control the majority of global capacity. DOE's 2025 residential benchmark used twenty 400 W modules rated at 20.4% efficiency paired with a 5 kWac bidirectional inverter, as reported by the DOE, illustrating the precision of component specifications that buyers demand — a specificity that gives established suppliers pricing leverage over substitutable alternatives. Buyer power at the utility-scale level is substantial: large grid operators running competitive RFP processes routinely extract price concessions and technology upgrade requirements from vendors. Substitutes are limited because no other technology currently delivers the combination of dispatchable clean generation and long-duration storage at equivalent cost. Rivalry among the top 20 players is intensifying as project pipelines converge on the same interconnection queues and land parcels, compressing margins for developers lacking proprietary site control.
AI and Gen AI Impact
Artificial intelligence is most active in the energy management and dispatch layer of the solar-plus-storage value chain. Systems that optimize charge and discharge cycles against real-time and day-ahead electricity prices can materially improve project revenue without adding physical capacity. Ember's 2026 technical model quantified energy-conversion losses at 3.76% from PV to grid, 4.5% from PV to battery, and 5.5% from battery to grid, as published by Ember Energy. AI-driven dispatch algorithms target these conversion inefficiencies by minimizing round-trip cycling and maximizing direct export windows when grid prices are highest. Early movers deploying AI energy management platforms are capturing revenue uplift that static dispatch schedules cannot replicate. Laggards operating on fixed charge-discharge schedules risk leaving 10–15% of potential arbitrage revenue unrealized as intraday price volatility rises with higher renewable penetration. Generative AI is entering the design phase, automating system sizing optimization across hundreds of meteorological and load scenarios simultaneously.
Market Trends
Residential Attachment Rates and Long-Duration Technologies Reshaping Demand Mix
U.S. residential solar-storage attachment rose to a recorded rate of 38.16% across available 2026 permit data, covering 67,615 storage-included permits from 177,173 solar filings, per Scout Data. Vehicle to Grid integration is emerging alongside residential storage as a complementary demand-side asset, allowing EVs to participate in the same virtual power plant frameworks as dedicated battery systems. Long-duration storage technologies including iron-air and zinc hybrid chemistries are now appearing in utility RFPs alongside lithium-ion, a shift that will fragment procurement decisions and reward developers with chemistry-agnostic system design capabilities.
Market Competition Overview
Arevon's Eland project reached full operations in August 2025 with 758 MWdc of solar and 300 MW/1,200 MWh of storage, as reported by Arevon, making it one of the largest co-located solar-plus-storage facilities in North America at commissioning. The facility contains 1.36 million solar panels and 172 lithium-iron-phosphate battery units, and Arevon reports it can supply 7% of Los Angeles' electricity. A project of that scale requires a developer with full-stack capabilities spanning land control, interconnection management, EPC contracting, and long-term operations — capabilities that only a narrow group of competitors currently hold. The market sits between fragmentation at the residential and C&I installer tier and consolidation at the utility-scale developer and component manufacturer tier. Battery cell manufacturers with Chinese-headquartered production dominate the supply side, giving them leverage over project developers who need cell supply certainty to finance projects. Mid-tier developers without proprietary supply agreements or differentiated interconnection positions are increasingly absorbed by larger platforms seeking to accelerate their pipelines.
Pricing Analysis
Turnkey battery-system costs used in solar-plus-storage economics declined by 31% during 2025, according to Ember's 2026 India analysis. That cost reduction is the primary reason Indian auction clearing prices compressed: four-hour battery projects cleared at INR 2.9–3.5/kWh ($32–39/MWh) in 2025 Indian auctions, as reported by Ember Energy. DOE's 2025 Q1 utility-scale benchmark placed the modeled market price at $1.81/Wdc for a 100 MWdc system with 240 MWh of storage, with annual O&M running $33/kWdc, as published by the U.S. Department of Energy. Residential system pricing remains structurally higher than utility-scale due to smaller order sizes, higher installer labor content, and fragmented permitting processes. Market leaders use vertically integrated manufacturing to defend margin while challengers compete on installation speed and software capabilities rather than hardware price. Regional price floors are set by Chinese manufacturers whose domestic cost structures give them advantages that Western producers address through domestic content incentives rather than direct cost competition.
Company Profiles
Tesla, Inc. holds a distinctive position in the solar-plus-storage market by operating across both the residential and utility-scale tiers simultaneously. The Powerwall product line gives Tesla a direct channel to the residential attachment market, while the Megapack system serves utility developers building grid-scale storage. Vertical integration from cell chemistry through software gives Tesla's energy division a data advantage: each deployed system feeds operational learning back into future product iterations, compressing the gap between product generation cycles. CATL anchors the supply side of the global solar-plus-storage market as the dominant lithium-ion cell manufacturer by volume. CATL's strategy centers on chemistry innovation — the company has been advancing LFP, sodium-ion, and condensed battery platforms simultaneously — paired with multi-continent manufacturing expansion designed to reduce geopolitical supply concentration risk. Developers relying on CATL cell supply face a supplier with substantial bargaining power, but also access to the lowest per-kWh manufacturing costs available outside Chinese domestic production channels.
Key Players
- Tesla, Inc.
- CATL
- Sungrow Power Supply Co., Ltd.
- BYD Company Ltd.
- Huawei Digital Power
- LG Energy Solution
- Fluence Energy, Inc.
- Enphase Energy, Inc.
- SolarEdge Technologies
- Wärtsilä
- GE Vernova
- Schneider Electric SE
- SMA Solar Technology AG
- Samsung SDI Co., Ltd.
- Panasonic Energy
- Hitachi Energy Ltd.
- Sonnen GmbH
- FIMER S.p.A.
- Trina Solar Co., Ltd.
- JinkoSolar Holding Co., Ltd.
Supply Chain and Value Chain Analysis
DOE's representative 2025 utility solar-plus-storage design combined 100 MWdc of PV with 60 battery cabinets rated at 4 MWh each, providing 240 MWh of energy and 60 MWac of output for a four-hour discharge duration, as published by the U.S. Department of Energy. That design specification defines the procurement chain: upstream lithium raw material extraction feeds cell manufacturers, who supply battery cabinets to system integrators, who coordinate with PV module producers and inverter suppliers to deliver a single contracted asset to the developer. Maximum value creation occurs at the system integration and software layer, where project-specific engineering decisions lock in the long-term performance envelope. The same 2025 utility benchmark used approximately 167,000 bifacial modules rated at 600 W and 21.9% efficiency, connected to 19 central inverters rated at 4 MWac each, per DOE documentation. Module concentration in Chinese manufacturing creates the primary upstream bottleneck. Domestic content requirements under the U.S. IRA are pushing developers to identify alternative module sourcing in Southeast Asia, India, and emerging U.S. manufacturing capacity, adding supply chain complexity that increases procurement lead times and risk management costs.
Regulatory Landscape
FERC Order 2023 reforms directly address the interconnection queue backlogs that are the primary regulatory constraint on solar-plus-storage deployment in the United States. The order restructures the study process from a serial to a cluster-based approach, reducing the administrative load on transmission operators. JinkoSolar supplied storage systems for three Massachusetts installations commissioned in July 2025 under the state's SMART program, providing a combined 21.6 MWh of operational storage, as reported by JinkoSolar. State-level programs like SMART demonstrate how structured incentive frameworks accelerate distributed deployment ahead of federal policy cycles. European Union regulations classify storage as a distinct asset class separate from generation, removing a tax treatment ambiguity that previously increased the effective cost of storage investment. India's auction design has become a global reference model for competitively procuring solar-plus-storage at scale, with the regulatory structure requiring defined monthly reliability thresholds that give grid operators confidence in dispatch performance. Regulatory evolution in all three geographies is moving in the same direction: storage is being treated as infrastructure rather than equipment.
Investment and White Space Analysis
R+ Energies' Green River Energy Center began commercial operation in Utah in June 2026 with 400 MW of solar and a 400 MW/1,600 MWh battery providing four hours of rated discharge, as confirmed by R+ Energies. Projects of that scale reflect where the bulk of investment is currently flowing: large-capacity, grid-connected systems in high-irradiance markets with established interconnection positions. The white space lies in the segments and geographies not yet served by that template. Sub-Saharan Africa and Pacific island nations represent the clearest geographic white space: high electricity access deficits, strong solar resources, and an absence of utility-scale grid infrastructure that makes distributed solar-plus-storage microgrids the lowest-cost path to electrification. Within developed markets, the retrofit storage addition segment is underserved relative to its addressable base — millions of solar installations built before storage economics improved now represent a bankable retrofit pipeline that requires dedicated financing structures and streamlined permitting to unlock.
Recent Developments
- January 2024: TotalEnergies acquired Kyon Energy, a German battery energy storage developer, to accelerate utility-scale solar-plus-storage capabilities across European markets.
- Late 2024: Google and Intersect Power announced a $20 billion investment framework to develop energy parks combining solar PV with BESS, aimed at guaranteeing 24/7 reliable corporate renewable energy procurement.
- August 2025: Indian solar module manufacturer Vikram Solar raised approximately $237.5 million through an IPO on the BSE and NSE to expand its module manufacturing and utility-scale solar project pipelines.
- July 2026: Masdar reached financial close on a $6.1 billion solar-plus-storage project in Abu Dhabi, securing a $5.1 billion bank financing package to deploy 5.2 GW of solar PV paired with 19 GWh of battery storage.
- September 2026: Trina Storage was selected to supply a 562 MWh Battery Energy Storage System for Frontier Energy's Stage One Waroona solar-plus-storage project in Western Australia.
- September 2026: Premier Energies and RCT India unveiled a joint plan to build a 12 GWh BESS manufacturing facility in Telangana, targeting the co-located solar-and-storage segment directly.
Report Scope
| Report Characteristics |
| Market Value (2026) |
USD 49.11 Billion |
| Forecast Revenue (2035) |
USD 238.59 Billion |
| CAGR (2026 to 2035) |
19.2% |
| Base Year for Estimation |
2025 |
| Historic Period |
2020 to 2024 |
| Forecast Period |
2026 to 2035 |
| Report Coverage |
Revenue Forecast, Market Dynamics, Competitive Landscape, Recent Developments |
| Segments Covered |
By Component (Battery Energy Storage Systems, Solar PV Modules, Power Conversion Systems, Energy Management & Controls, Balance of System & Services), By Battery Chemistry (LFP, NMC, Lead-Acid, Flow Batteries, Sodium-Ion, Other), By System Type (Grid-Connected, Off-Grid, Hybrid), By Capacity (Above 10 MW, Below 100 kW, 100 kW–1 MW, 1–10 MW), By Application (Energy Shifting & Self-Consumption, Peak Shaving, Backup Power & Resilience, Frequency Regulation & Ancillary Services, Microgrids), By End User (Utility-Scale, Commercial & Industrial, Residential), By Deployment (New-Build, Retrofit) |
| Regional Analysis |
North America (US and Canada), Europe (Germany, France, The UK, Spain, Italy, and Rest of Europe), Asia Pacific (China, Japan, South Korea, India, Australia, and Rest of APAC), Latin America (Brazil, Mexico, and Rest of Latin America), Middle East & Africa (GCC, South Africa, and Rest of MEA) |
| Competitive Landscape |
Tesla, Inc., CATL, Sungrow Power Supply Co., Ltd., BYD Company Ltd., Huawei Digital Power, LG Energy Solution, Fluence Energy, Inc., Enphase Energy, Inc., SolarEdge Technologies, Wärtsilä, GE Vernova, Schneider Electric SE, SMA Solar Technology AG, Samsung SDI Co., Ltd., Panasonic Energy, Hitachi Energy Ltd., Sonnen GmbH, FIMER S.p.A., Trina Solar Co., Ltd., JinkoSolar Holding Co., Ltd. |
| Customization Scope |
Customization for segments and region or country level will be provided. Additional customization can be done based on requirements. |
| Purchase Options |
Three license options: Single User License, Multi-User License (Up to 5 Users), Corporate Use License (Unlimited Users and Printable PDF) |
Frequently Asked Questions
What is the biggest investment opportunity in the Solar-plus-Storage market?
▾ The strongest near-term investment opportunity lies in utility-scale new-build projects in high-irradiance markets with existing interconnection positions. Hybrid solar-storage-green hydrogen configurations represent the highest-upside emerging opportunity for developers with access to curtailed solar resources and electrolyzer supply chains.
Who are the top companies in the Solar-plus-Storage market?
▾ The leading companies are Tesla, Inc., CATL, Sungrow Power Supply Co., Ltd., BYD Company Ltd., and Huawei Digital Power. These players hold competitive positions across cell manufacturing, system integration, and software-driven dispatch optimization.
Which segment is growing fastestin the Solar-plus-Storage market and why?
▾ Residential is the fastest-growing end-user segment, and Sodium-Ion is the fastest-growing battery chemistry. Residential growth is driven by rising retail electricity prices, self-consumption economics, and virtual power plant programs that compensate homeowners for grid services. Sodium-Ion chemistry is advancing on its cobalt-free bill of materials and domestic content compliance advantages.
Which region is growing fastestin the Solar-plus-Storage market and why?
▾ Asia Pacific is both the dominant and fastest-growing region, holding a 46.2% market share valued at USD 18.5 Billion in 2026. The region's combination of the world's lowest manufacturing costs, large state-directed procurement programs, and the fastest-growing electricity demand creates a structural growth advantage no other region can replicate at comparable scale.
What is the biggest challenge holdingin the Solar-plus-Storage market back?
▾ Grid interconnection queue backlogs in major U.S. markets are delaying projects by two to five years between application and commercial operation. Battery supply chain concentration in Chinese cell manufacturing adds geopolitical procurement risk and complicates domestic content compliance for developers operating under IRA provisions.